It has been a tough 7 days for Bitcoin, Ethereum and the NASDAQ composite index as The Fed is anticipated to raise their target rate AND engage in quantitative tightening.
While the NASDAQ composite index has been deflating over past 7 days, Bitcoin and Ethereum plunged in recent days. What is going on??
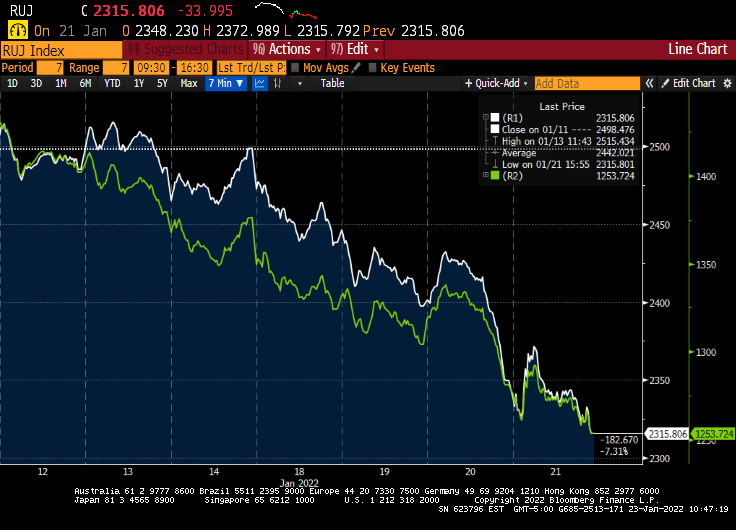
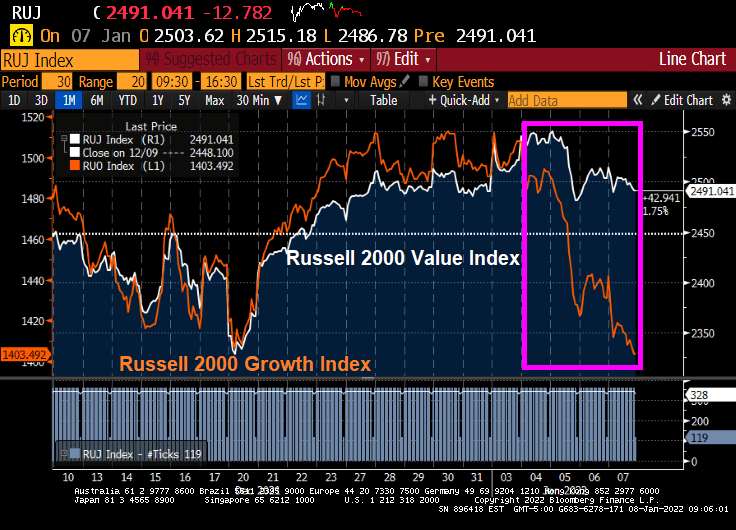
The Russell 2000 value (white) and growth (green) indices are both deflating.
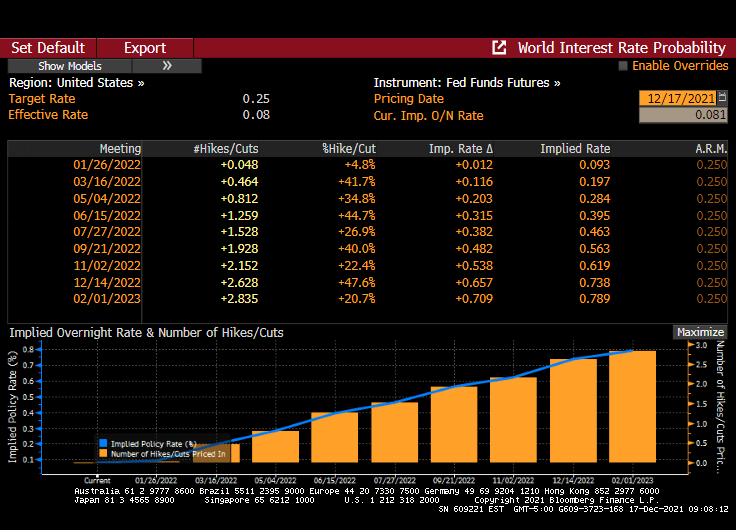
With regards to anticipated Fed rate increases, Fed Funds Futures are signaling almost 4 rate hikes in 2022 and 4 by the February 2023 meeting.
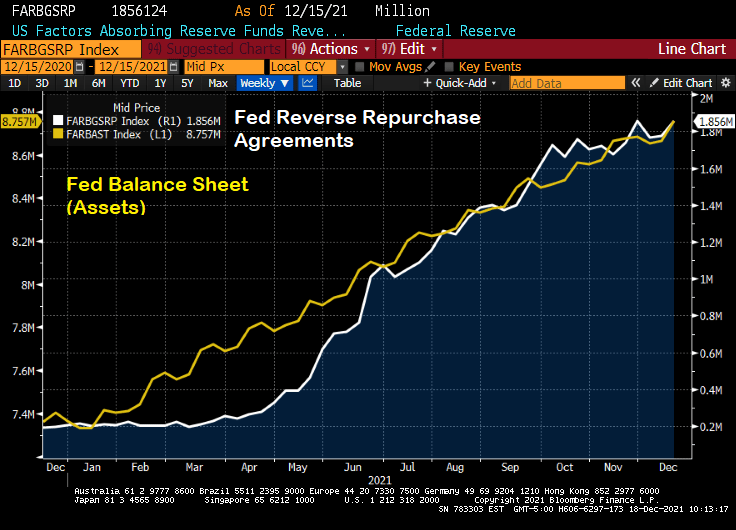
Then we have the massive increase in The Fed’s balance sheet after COVID struck in early 2020. Now, with the S&P 500 skyrocketing (until 7 days ago), why is The Fed buying sooooo much Agency MBS??
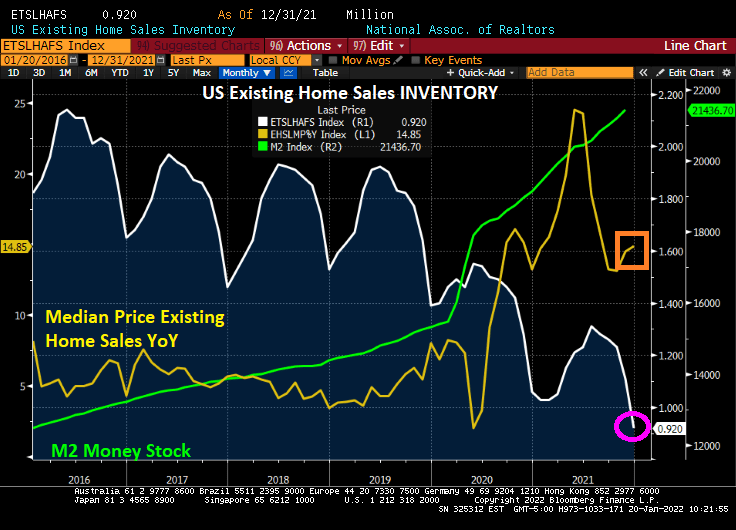
The banner headline is … US existing home sales declined 4.6% MoM in December. But that isn’t the interesting news. The interesting news is the mystery of the missing housing inventory. While various pundits told us that inventory would be returning … it isn’t. And the median price of existing home sales is up 14.85% YoY with insane Fed stimulus still in play.
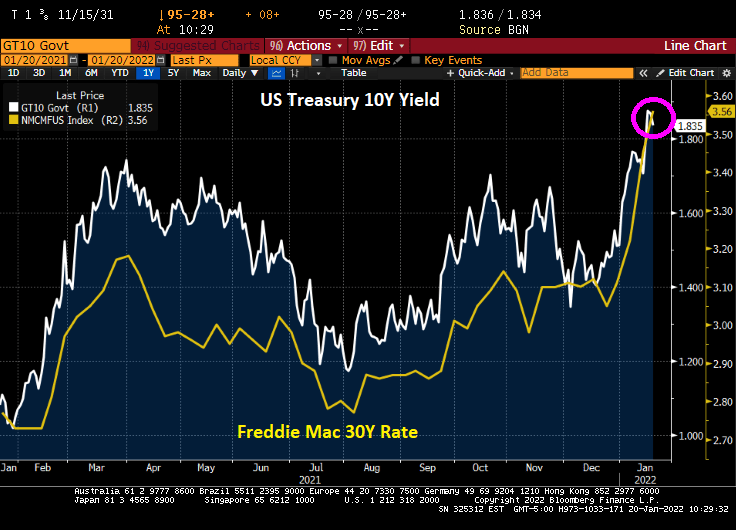
That was December. What will January bring with rising mortgage rates? Freddie Mac’s 30-year commitment rate rose to 3.56% today.
When will housing inventory for sale start to increase? Probably about the same time The Fed ACTUALLY starts raising interest rates and paring back on the monetary stimulus.
Treasury Secretary Janet Yellen is having trouble with the curve (yield curve, that is). It keeps inching up, meaning that Treasury’s cost of debt financing is inching up too.
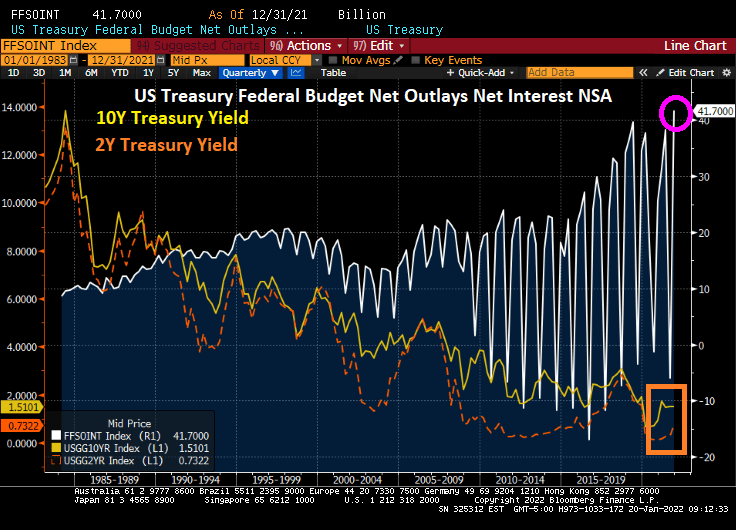
As Treasury yields keep rising, so does the problem of financing the massive Federal debt load. Here is a chart showing the interest outlays in the Federal budget against the cost of Federal funding at the 10-year and 2-year tenors.
Now, The Fed is predicted to raise their target rate 4 times in 2022 (according to Fed Funds Futures data) and it looks like a whopping 100 basis points (or 1%). Holding the rest of the yield curve constant, this will considerably flatten the 10Y-3M Treasury curve. Resulting in a more expensive refinancing of the Federal Debt load.
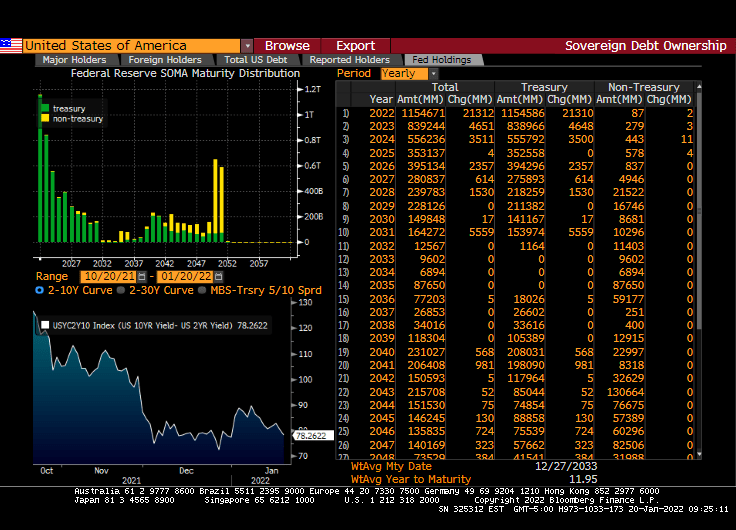
If we look at The Fed’s System Open Market Holdings (SOMH), we can see that The Fed’s holdings are primarily Treasuries with non-Treasuries (primarily agency mortgage-backed securities) not maturing (or running off) until 2050.
The majority of The Fed’s COVID expansion was picked-up by The Fed (light blue line).
How about the Treasury Inflation-protected Securities curve? Negative yields across the tenor range.
With Congress trying to spend trillions more (since Build Back Broke failed, Democrats are producing MORE spending legislation with the voting act included, of course), Treasury is going to have progressively more trouble with the (Treasury) curve.
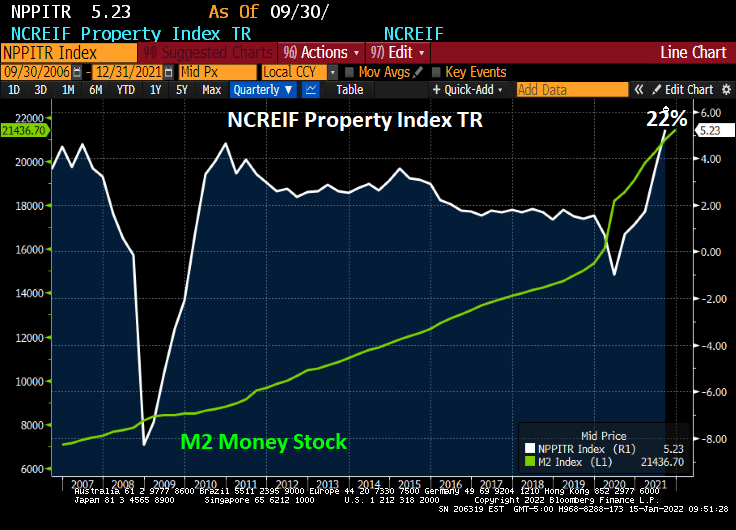
Inflation is burning out of control. While home price growth has been off the cherts (as Jean-Ralphio would say), commercial real estate has jumped incredibly at 22% YoY. The Bloomberg charting function hasn’t updated for the Q4 NCREIF report yet so I had to manually write-in 22% on the following chart.
So, what will happen IF The Fed follows through with its monetary stimulus reduction? JPMC’s Jaime Dimon warns that The Fed could hike 7 times in 2022 and not be ‘sweet and gentle’.
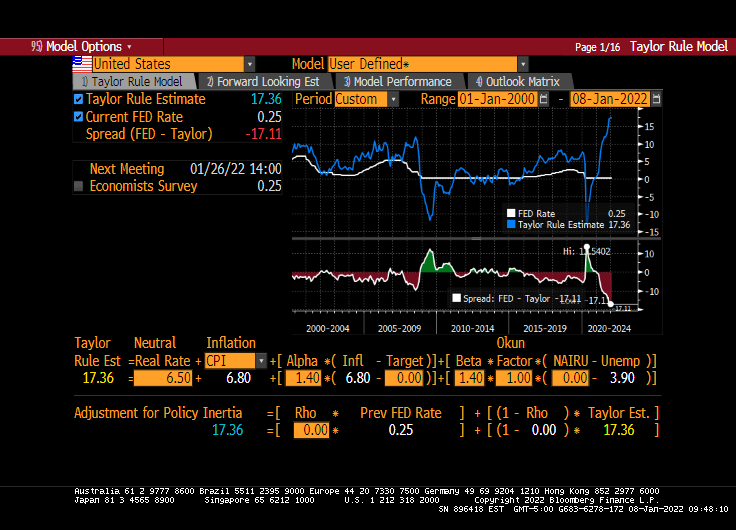
It is somewhat mystifying that markets would be soooooo sensitive to 3 rate increases from The Fed, particularly since the Taylor Rule suggests that The Fed’s target rate should be 17.36%. Even if you don’t like the Taylor Rule or disagree with its inputs, you must admit that the gap between where The Fed is (0.25%) and where they should be (17.36%) is … k-razy.
Treasury yields rose a second day, with five-year rates hitting the highest since before the pandemic took hold in the U.S., amid increasing conviction that the Federal Reserve will raise rates at least three times beginning in May.
The five-year Treasury note’s yield climbed as much as 3.8 basis points to 1.392%, the highest since Feb. 20, 2020, while 30-year yields bumped up toward their 200-day moving average.
Yields across the curve are rising for a second straight day, after Monday’s selloff lifted the 10-year note’s yield by nearly 12 basis points in its worst start to a year since 2009. The two-year yield topped 0.80% for the first time since March 2020.
At the 10-year mark, we see Canada’s sovereign notes rising 18.7 basis points.
Also at the 10 year mark, we see the US 1-year breakeven inflation rate (red line) surging.
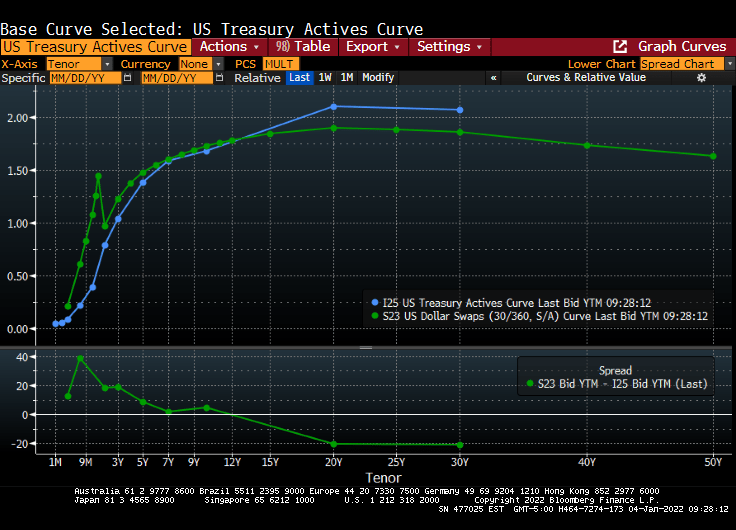
The US Treasury actives curve and Dollar Swaps curve remain steeply upward sloping.
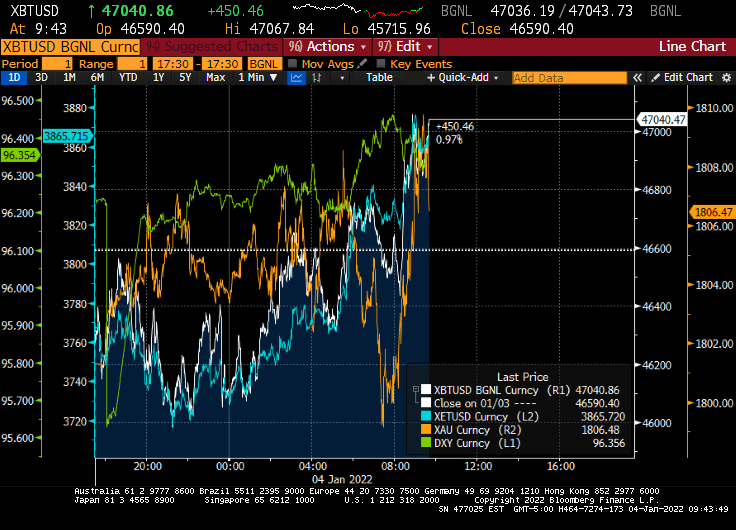
And on the crypto and gold front, gold surged this morning after tanking in the evening, while Ethereum (blue) is doing quite well along with Bitcoin.
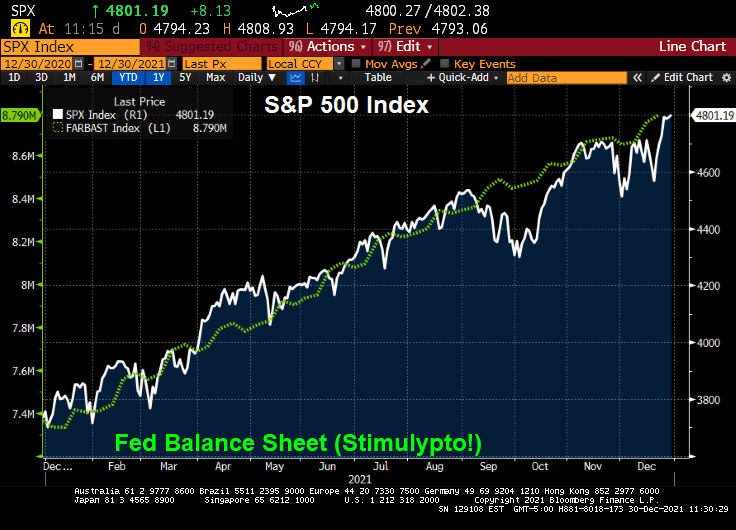
My favorite non-bond, non-alt investment chart. The S&P 500 index charted against The Fed’s M2 Money Stock.
Following my friend Jesse’s habit of posting great French food dishes, here is one from my favorite Parisian eatery, Le Duc de Richelieu. Mmmmmmm.
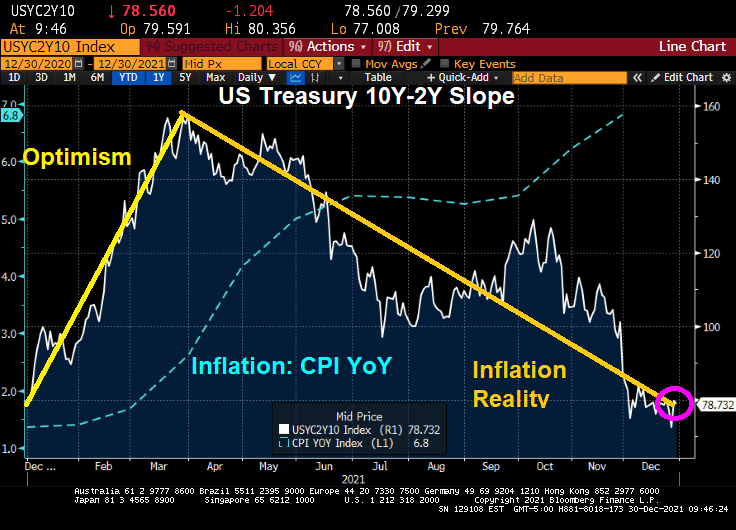
It has been almost a year since Joe Biden has been President of the United States and a Democrat majority took control of The House and Senate. And what has happened to the US Treasury yield curve slope over the past year?
The yield curve is back where it started. There was the “honeymoon effect” where the curve slope rose. After all, Biden was Obama’s Vice President for 8 years and The Democrats has promised so much in the 2020 election. But by early April, the reality of the massive Federal spending (combined with Fed Stimulypto) began showing what was feared: inflation (blue line) started to grow at a rapid rate of speed. With inflation now at 6.8% YoY,
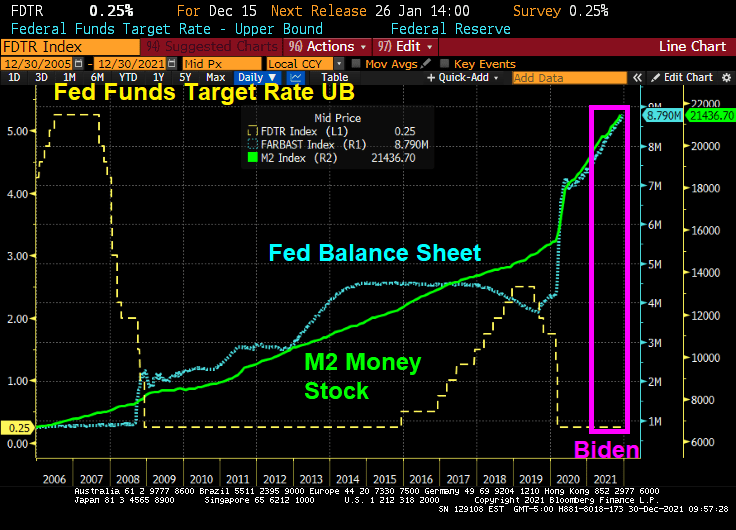
In fairness to Biden, The Federal Reserve has been overstimulating the economy since The Federal Reserve since Ben Bernanke and the Fed Open Market Committee (FOMC) dropped the hammer on The Fed Funds Target Rate once the rate hit 5.25% in September 2007. They kept cutting it reached 25 basis points (or 0.25%) in December 2008. In August 2008, Bernanke and Company began their “Quantitative Easing” or asset purchasing programs. Between The Fed’s Target Rate and QE, The Fed has continued to overstimulate markets ever since. Under Biden, The Fed Funds Target Rate remains at 0.25% and The Fed’s Balance sheet has grown to $8.79 Trillion (bigger than the entire economies of Japan and Germany put together!).
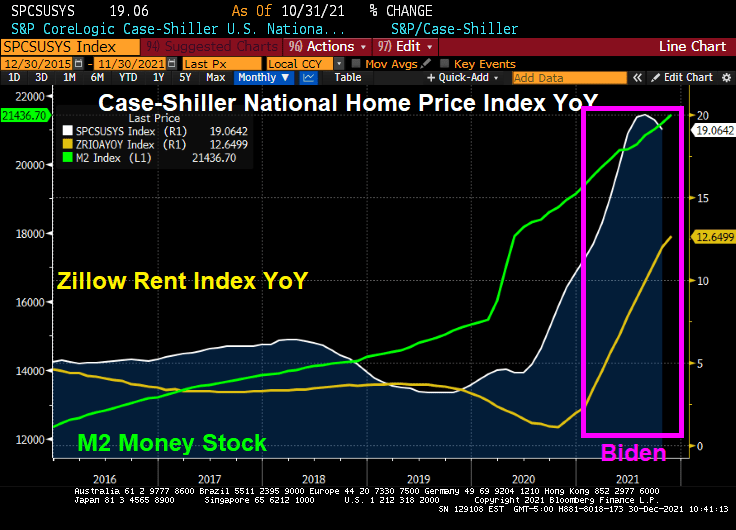
How about housing? Home prices are growing at 19% YoY while rents are growing at 12.65% YoY.
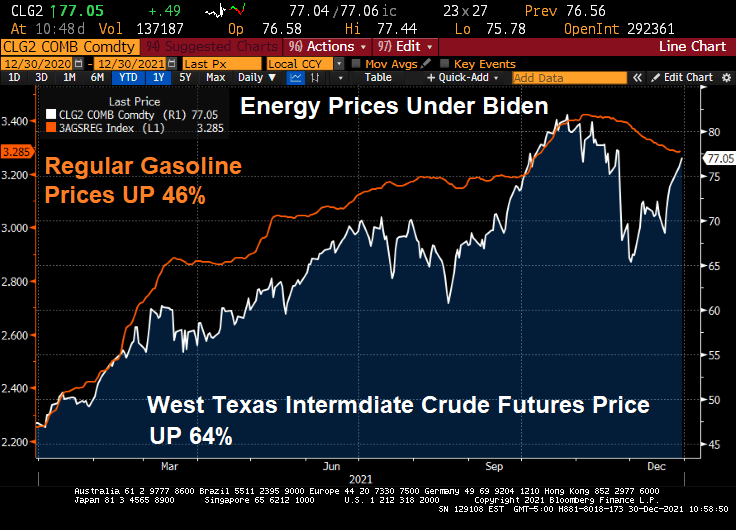
Energy prices have risen dramatically under Biden. Gasoline is up 46% despite a slight reprieve recently. WTI crude prices are up 64%.
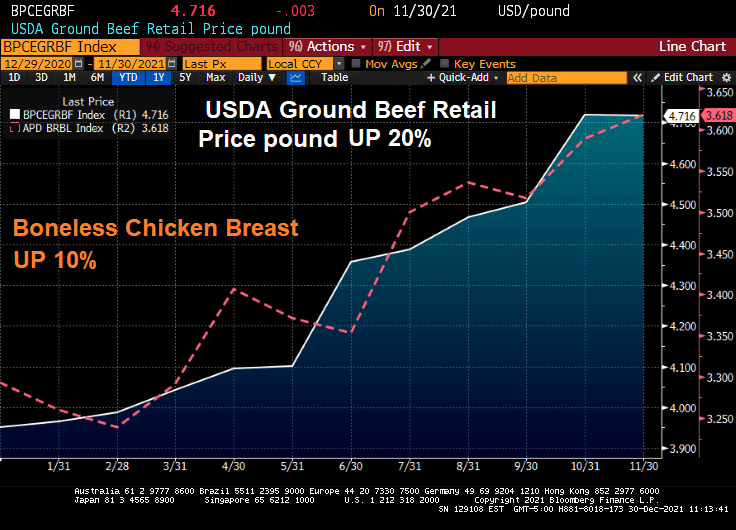
How about food? Beef prices are up 20% and chicken prices are up 10%.
On a positive note, the S&P 500 index has soared … thanks has soared during Biden’s term thanks to Fed stimulus and Federal spending on COVID.
The Build Back Better Act if passed (in its entirety or on a piecemeal basis) will lead to even MORE inflation.
Perhaps Biden’s spokesperson Jen Psaki can recreate the Biden Administration as a lovable, hilarious family like the comic strip Gasoline Alley with old Joe Biden as Skeezix. And insider-trading star, House Speaker Nancy Pelosi as the family matriarch.
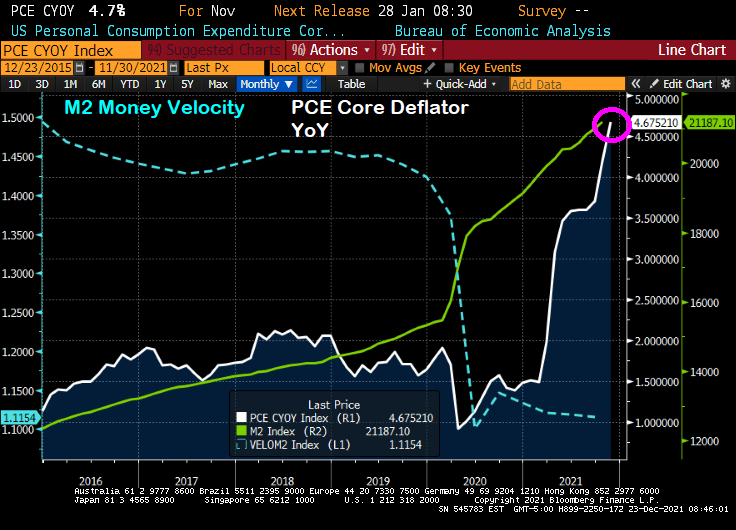
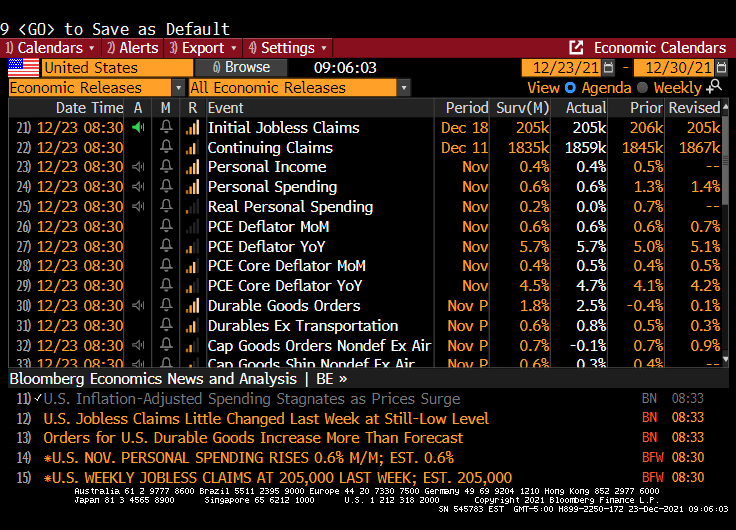
The core Personal Consumption Expenditures (PCE) deflator numbers for November were released this morning and the print was a whopping 4.7% YoY, the highest rate since 1989.
Meanwhile, U.S. consumer spending, adjusted for inflation (aka, REAL personal spending), stagnated in November as the fastest price gains in nearly four decades eroded purchasing power. Stagnated to 0.
Purchases of goods and services, after adjusting for higher prices, were little changed following a 0.7% gain in October, Commerce Department figures showed Thursday.
And as Paul Harvey would say, here is the rest of the story.
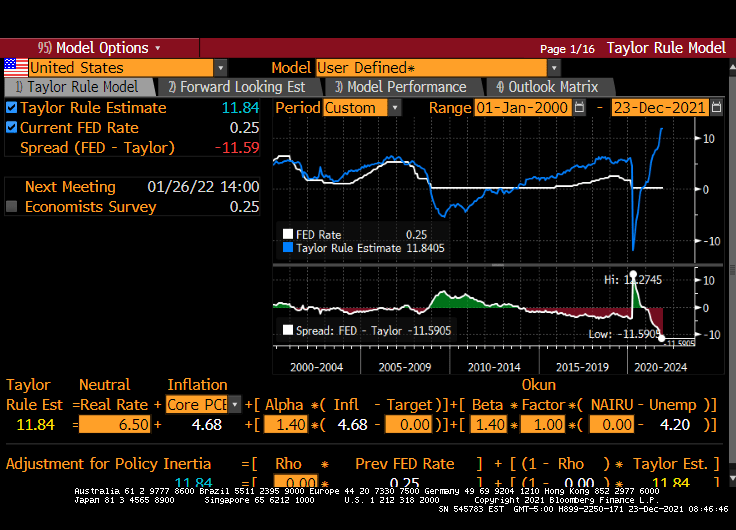
Core PCE growth YoY of 4.68% implies a Fed Funds target rate of 11.84%. Powell and the gang have the target rate at 0.25%. But the Taylor Rule doesn’t take into account the latest FEAR raging in Washington DC … the Omicron variant. Just another excuse for The Fed to do nothing and let asset bubbles blow out of control.
I love how The Federal Reserve talking heads, the media, economists like Paul Krugman, all refer to inflation as “transitory” and excessive liquidity as “temporary.”
Let’s look at a variety of alternative investments to the S&P 500, GameStop, Bitcoin, Ethereum and Gold after The Federal Reserve’s and Federal government massive (over)reaction to COVID in early 2020. Gold is the first asset to surge after M2 Money surged, but has declined since. Game Stop had a big surge (likely due to positive vibes on Reddit), but has been volatile and generally falling since “The Surge.” Bitcoin had a delayed surge as did Ethereum. Despite fear about government regulation, Ethereum in particular remains elevated.
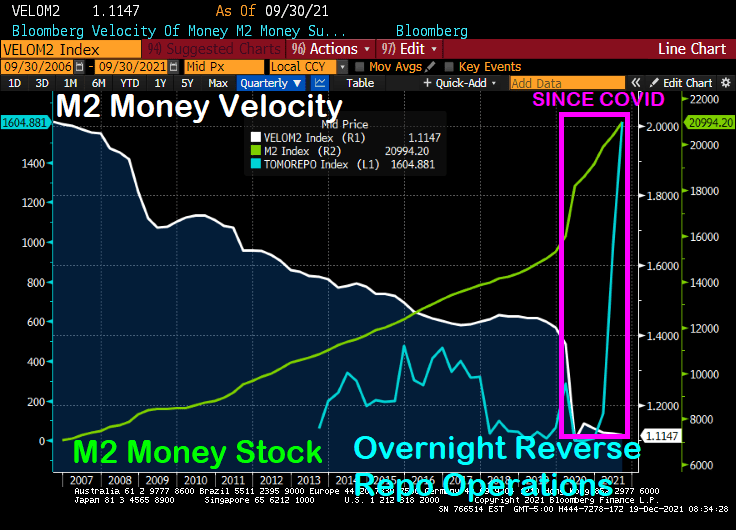
The “temporary” stimulus has resulted in the lowest M2 Money velocity in history. And we will have to see if the “temporary” excess liquidity in the financial system is truly temporary.
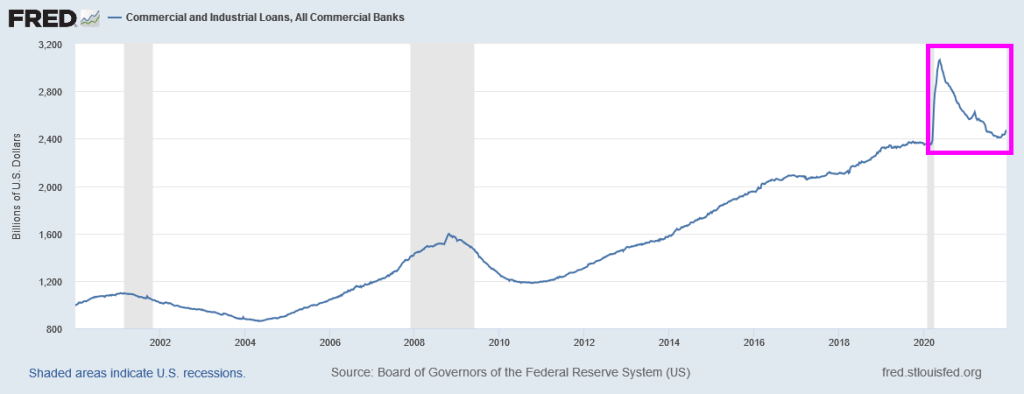
Here is a chart to show the “Stimulytpo” effect on commercial and industrial loans which surged (including PPP loans) but have simmered down to pre-COVID levels.
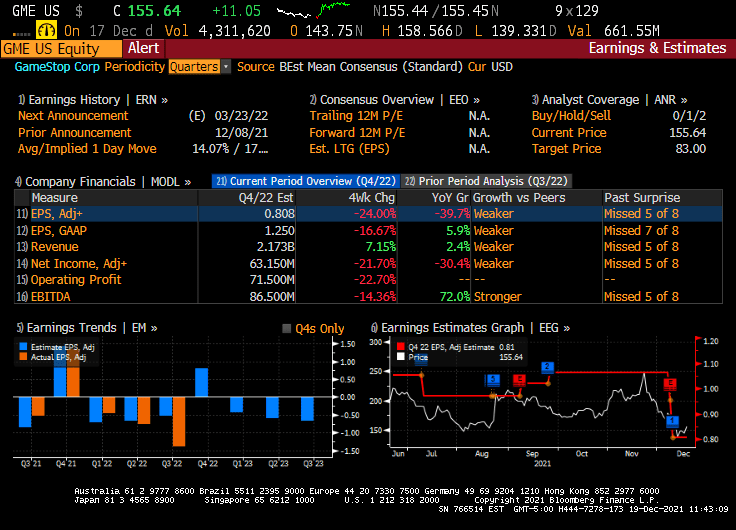
The earnings for GameStop were terrible (down 39.7% YoY). But at least Christmas season is upon us and maybe GameStop will surge with a good retail spending season.
But what happens to markets if the Federal government “stimulypto” is removed? If it ever is.
I love listening to Fed talking heads (or Fear The Talking Fed). They mostly seem to acknowledge that inflation is a problem and that the excessive monetary stimulus should be reduced.
But then I see the chart of The Fed’s balance sheet and The Fed’s reverse repo operations.
Then we have Federal Reserve Governor Christopher Waller saying that Th Fed could start raising interest rates as early as its March 15-16 meeting, after deciding to end asset purchases sooner than planned. My question is … why wait until the March meeting?
Is it fear of the Omincron Variant (which sounds like a Frederick Forsyth thriller)? Does The Fed not want to rock the boat prior to the Christmas season? The US is at or near full employment, so what is the real reason for delaying a rate increase until March or June? Or the fear that Congress won’t pass Biden’s Build Back Better Act?
Fed Funds Futures infer that one rate hike will occur at the June Fed Open Market Committee (FOMC) meeting and one at the November meeting.


You must be logged in to post a comment.