The US midterm elections are Tuesday. I was denied an absentee ballot for some reason, but I will get my disabled body over to the local precinct to cast my ballot.
Fortunately for Democrats, the next inflation report is not due out until November 10th. Because the forecast for the next inflation report is ugly.
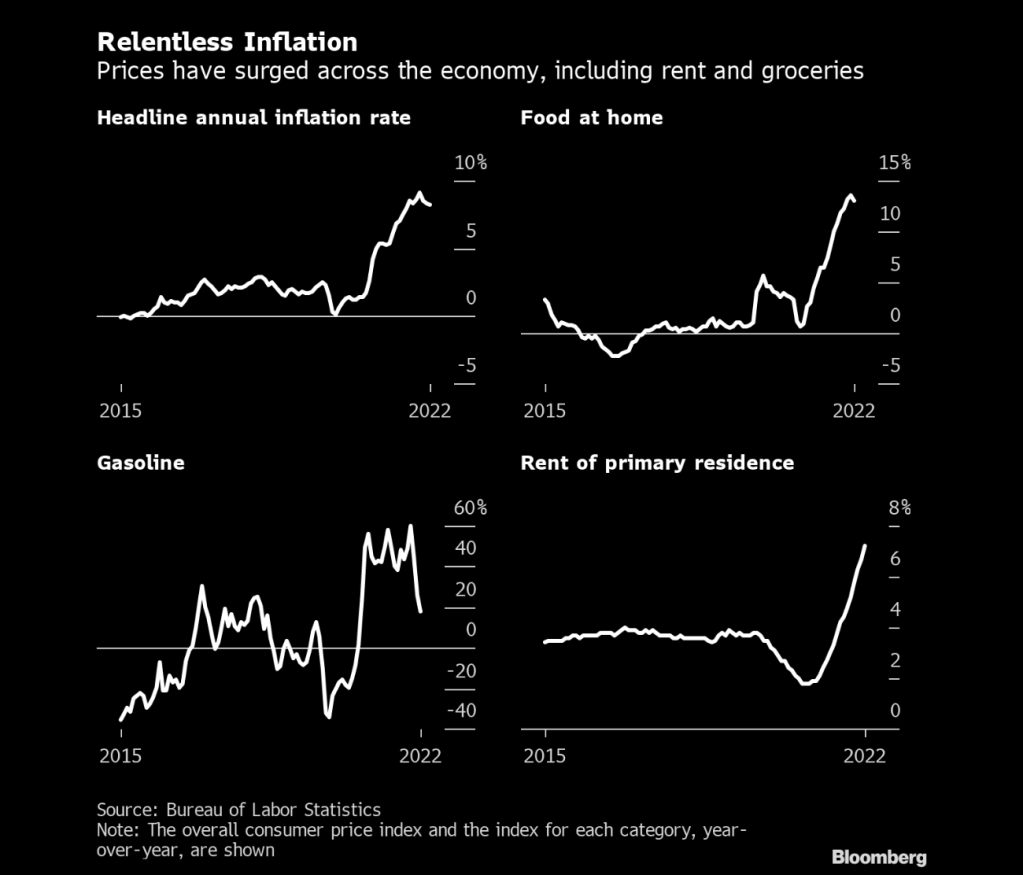
Headline CPI YoY = 7.9%
Core CPI YoY = 6.5%
These numbers are slightly lower than the last inflation report, but Americans are still suffering mightily under Biden’s Reign of Error.
Diesel fuel prices, the lifeline of the food industry, is up 102% under Biden’s mandates with the inventory of diesel fuel down 36%.
Inflation is relentless like Jason from Halloween.
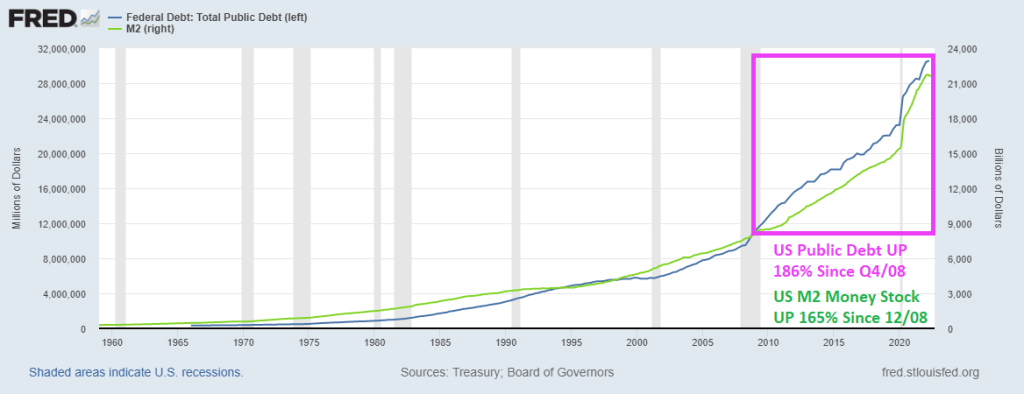
Ever since the financial crisis of 2008 and the election of President Obama and a Democrat Congressional sweep, the US has embraced Modern Monetary Theory (MMT or borrow, print and spend without consequence). And between the financial crisis and the Covid crisis of 2008, we have seen an increase in US public debt from $10.7 trillion in Q4 2008 to a staggering $30.6 trillion as of Q2 2022. That is a staggering increase of 186% in only 14 years.
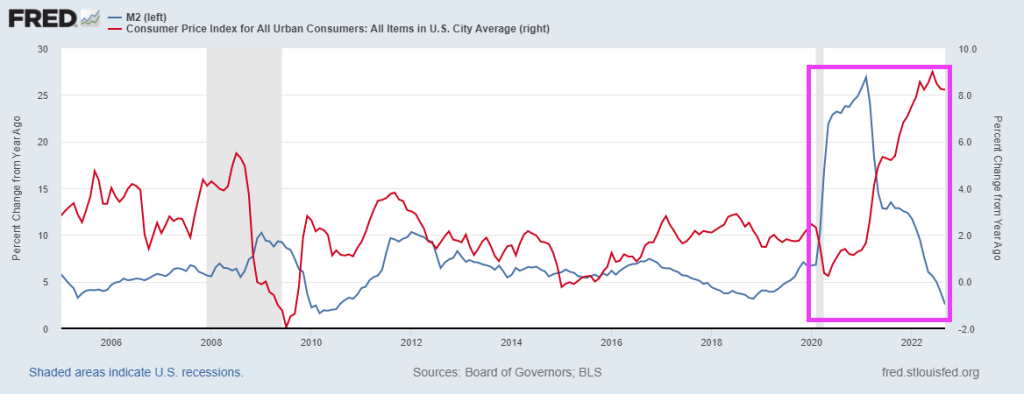
How about US Money stock? M2 Money stock has grown by 162.5% since the beginning of 2009 and the “Blue Wave” of 2008. And nothing has been the same.
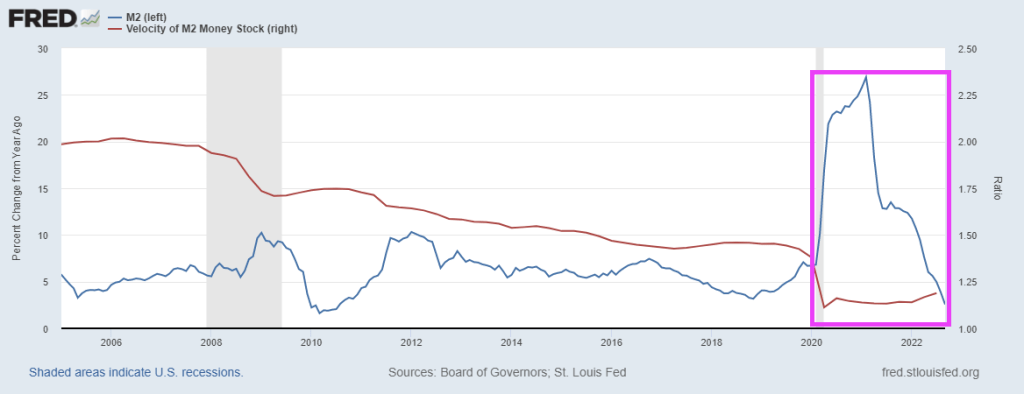
The Covid outbreak in early 2020, we saw Fed money printing that has never seen before … or since. But one thing is for sure, M2 Money Velocity (GDP/M2) is near all-time lows.
Then we have headline US inflation as a function of M2 Money growth YoY.
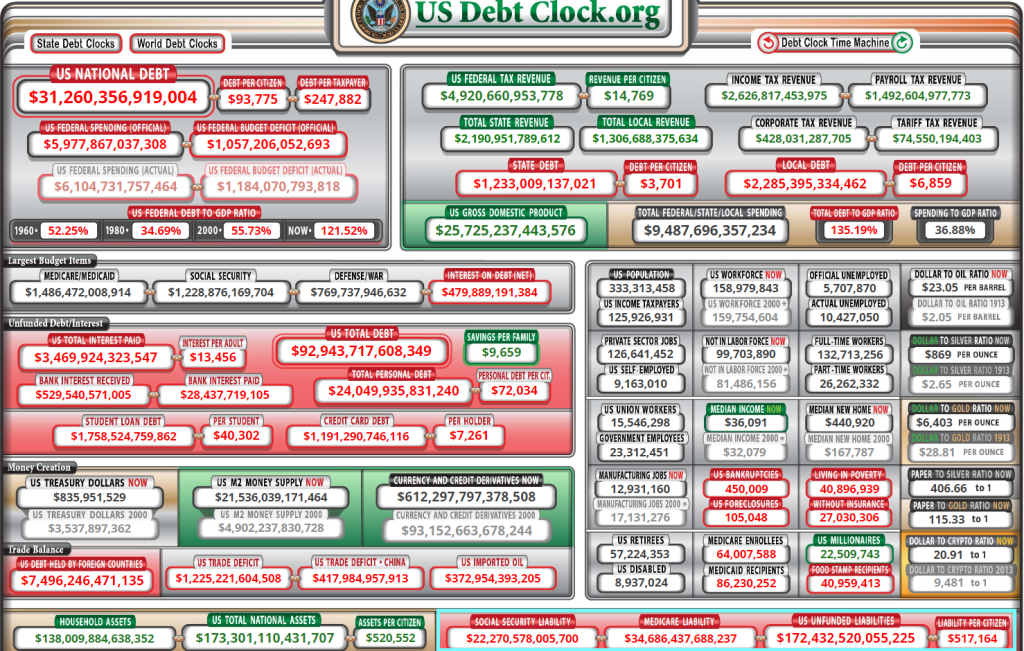
And it is the midterm election “silly season” where no politician will discuss the complete and utter mess they have made. According to US Debt Clock, US national debt is already up to $31.26 trillion (OMG!), but the REALLY scary number that not a single politician will address is UNFUNDED LIABILITIES OF $172.4 TRILLION.
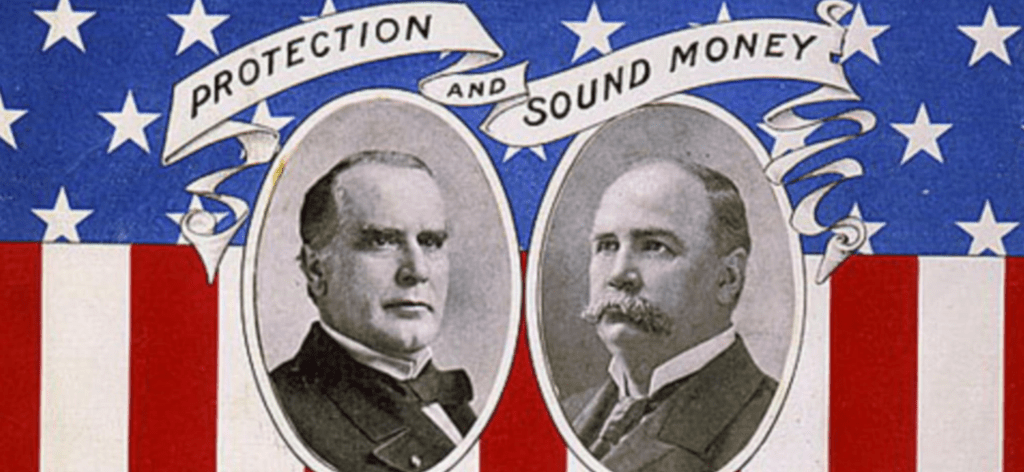
Can we go back to the gold standard? Or silver standard? Or ANY standard for that matter??
Instead, we have porous borders and patently UNSOUND money, thanks to MMT.
In addition to rampant 40-year highs in inflation, we have the Clark Griswold of the economy, Fed Chair Jerome Powell, slamming his foot on the economic breaks to combat inflation created by Biden’s energy mandates and reckless Federal spending (like the aforementioned, laughable “Inflation Reduction Act.”
So, Biden helps creates massive inflation and Powell and the Gang counterattacked by raising their target rate with more to come (at least until May 2023). And with the implied Fed Funds rate soaring (red line), we are seeing the FANG stocks (Facebook or Meta, Amazon, Netflix and Google) falling more rapidly (white line) than the S&P 500 index. Which is also falling like a rock (yellow line). All this is happening as M2 Money YoY crashes and burns.
How about growth versus value under Cousin Eddie and Clark Griswold? The Vanguard Growth ETF and Vanguard Real Estate ETF are plunging with Fed tightening (red line). Vanguard’s Value ETV (yellow line) is down too, but not by as much.
Yes, Washington DC elites. The gift that keeps on giving … bad things.
Thanks to my former GMU student Andrew Edwards for the Cousin Eddie suggestion!
Private payrolls added 233k jobs in October, which is a -27% decline from September’s revised private payroll figures.
The good news? Average hourly earnings growth is still positive, but fell to 3.7% YoY. But with inflation raging at 8.2% YoY, workers are getting clobbered by inflation.
Here is the rest of the story.
The Fed is now green-lighted to raise rates even higher.
Biden’s campaign promise was to unite rather than divide. But Biden has morphed into Gustaf Holst’s, Mars – Bringer of War! Both domestically and in the Ukraine.
It has been a wild and mostly negative ride under Biden’s Reign of Error. 40-year highs in inflation (caused by Biden’s fossil fuel mandates and Federal spending) have left the US mortgage market FINALLY seeing positive REAL mortgage rates (now 0.32%), even though the REAL 10yr Treasury yield is still negative (-2.50%).
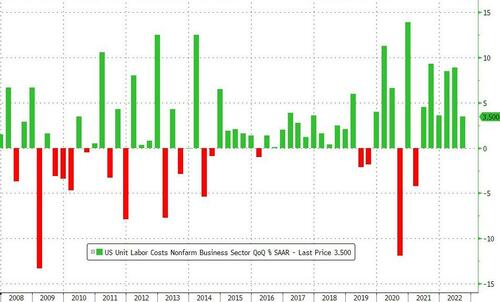
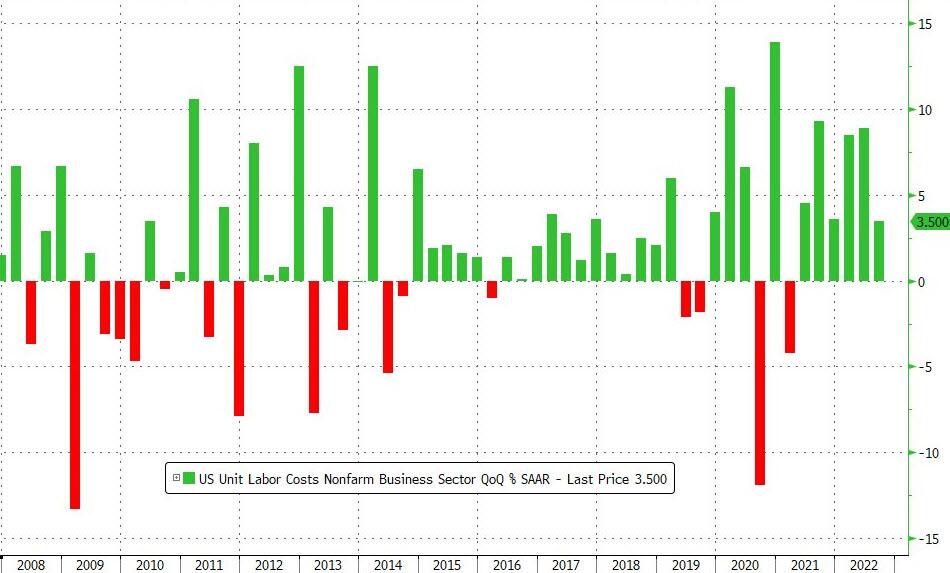
On a YoY basis, US Productivity is down for the 3rd straight quarter (and 4th quarter of the last 5).
On the mirror image of productivity, unit labor costs rose 3.5% QoQ (a notable slowing from the 8.9% QoQ growth in Q2). This was the 6th quarter in a row of rising unit labor costs (but was less than the +4.0% QoQ expected)…
However, on a YoY basis, that is the fastest growth since Q3 1982.
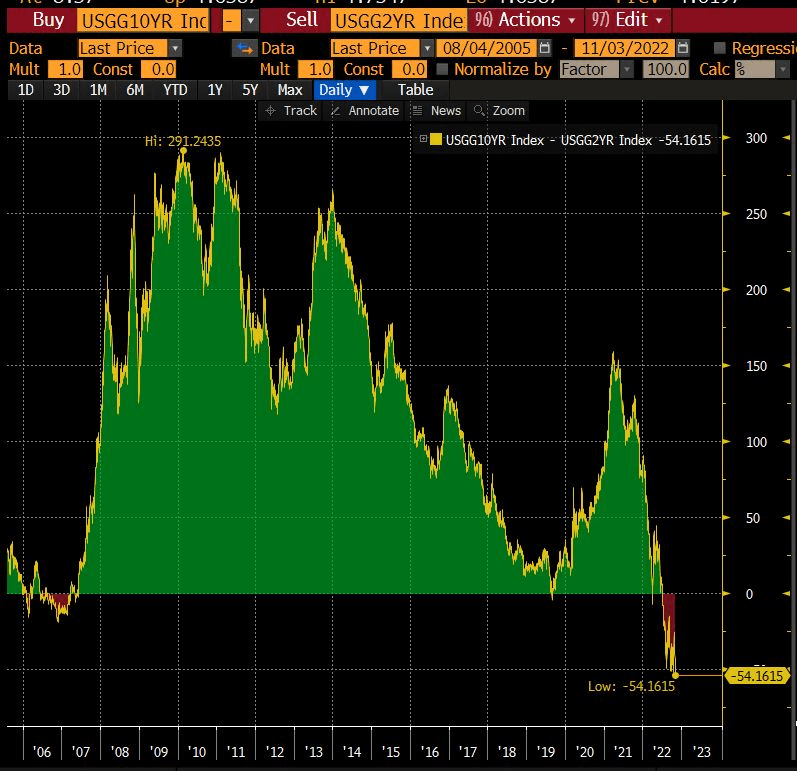
Yikes! The 2s10s Yield Curve Inversion Is the worst since the 1980s.


You must be logged in to post a comment.