Now, About Biden’s Employment Claim Of Most Jobs Created (Trump Added 2x More Jobs Post Covid-recession Than Biden)

Recently, the White House claimed that the Biden Administration created more jobs (per month) than Trump, Obama, George W Bush, George HW Bush, Clinton and Reagan.
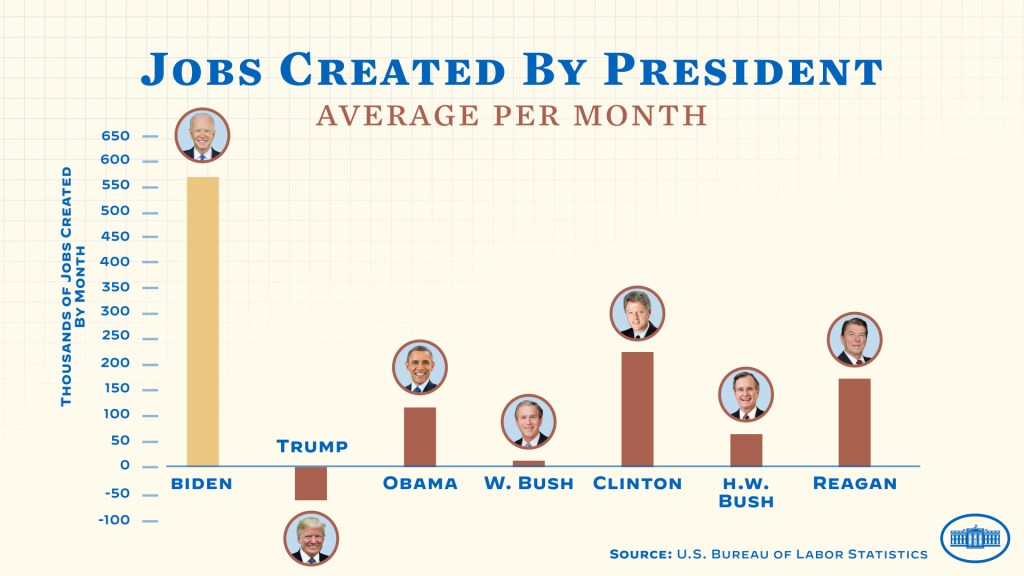
It always helps to be elected President after a recession when the economy naturally snaps back from the economic doldrums (like Obama after the financial crisis, Clinton after the first Gulf War, Reagan after Carter).

So let’s look at job totals under Trump, the COVID lockdowns, the ensuing economic damage, and the Biden “rebound.” In a brief two months in early 2020 thanks to COVID and lockdowns, the US economy lost 22.362 MILLION jobs. But the snap-back effect under Trump was 12.342 MILLION jobs added back by the time Biden was sworn-in as President.
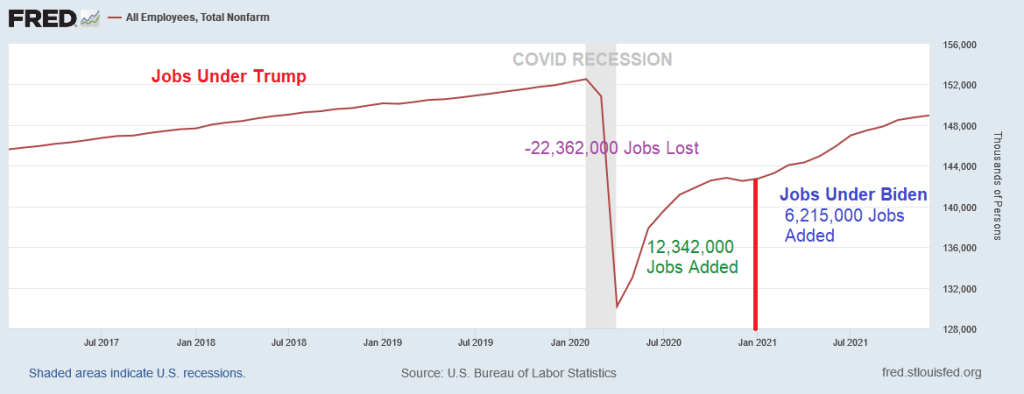
Under his term as President, Biden has benefited from “Snap-back inertia” and saw 6.215 MILLION jobs added in just a year. Pretty impressive, except that it is about half the snap-back effect experienced under Trump.

How about REAL wage growth (nominal wage growth less inflation)? Real wage growth was higher under Trump and has been declining under Biden. Strange that the White House isn’t bragging about declining real wage growth under Biden.
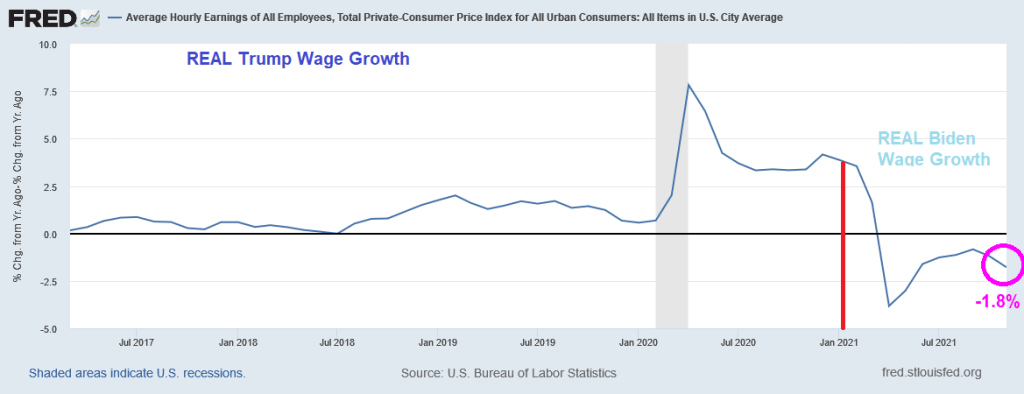
Let’s see how Omicron impacts the labor market and whether Biden/Psaki will take credit for the snap-back from Omicron.

Call this the Biden malaise (or Ka-malaise) for wage growth. Where inflation nukes positive wage gains.

Here is Vice President Ka-mailse singing “He’s me pal!” about Biden’s fantastic jobs recovery.

Home Ownership More Affordable Than Renting in Majority of U.S. Housing Markets (Except Where I Live, Of Course)

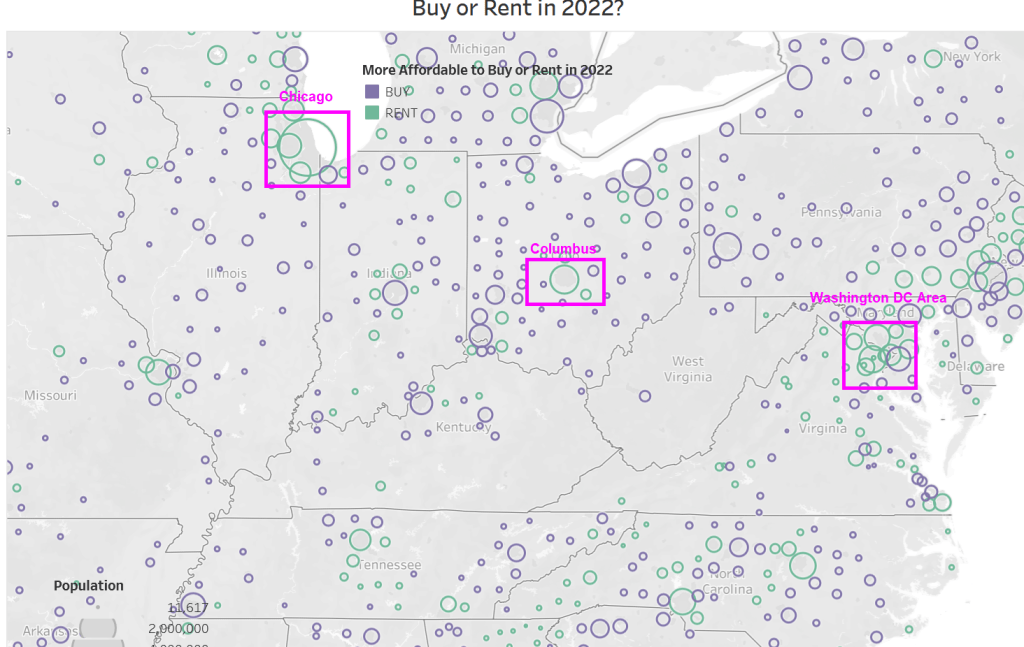
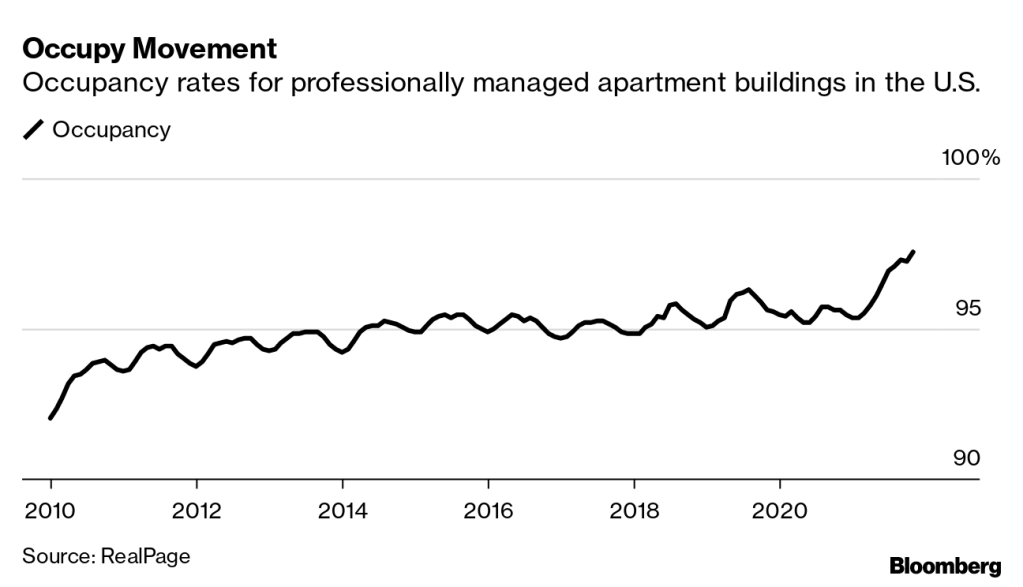
According to Attom, US home prices are growing faster than rents in nearly 90 percent of the nation; but prices are still more affordable in almost 60 percent of U.S. markets; Renting remains more financially viable in most-populous urban areas.

If we look at Attom’s map of affordability, you can see that in western states, it is more affordable to rent. And in megalopolis (Boston, New York, Philadelphia, Washington DC). And Miami. But elsewhere in the eastern states, it is more affordable to buy than to rent.

Of course, any where I live like Phoenix, Fairfax VA, Chicago IL, and Columbus OH it is more affordable to rent than to own.

You will notice that the areas where buying is more affordable than renting tend to be smaller towns with slower growth, while larger cities tend to be more affordable to rent.

People Get Ready! Value Stocks UP For 2022 While Growth Stocks DOWN (As Fed Expected To Withdraw COVID Stimulus)

People Get Ready! There’s a train a coming. Its called The Federal Reserve.

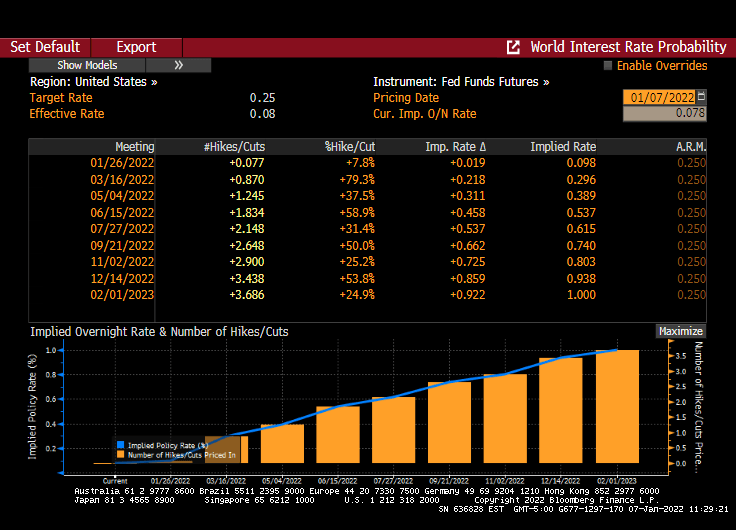
The market is pricing in 3 rate increases in 2022. And perhaps a faster than expected withdrawal of balance sheet stimulus.

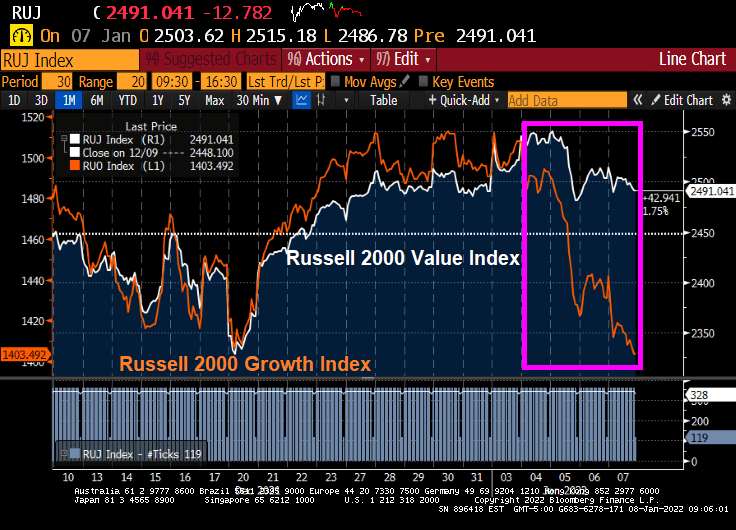
As a result, The Russell 2000 Growth index is plunging (orange line) relative to the Russell 2000 Value index (white line) which is down in 2021.

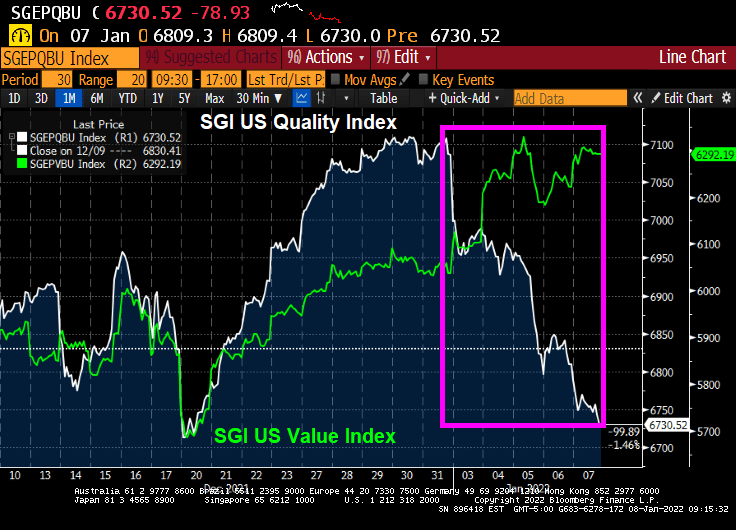
The Société Générale (SGI) US value and “quality” indices are telling the same story. The SGI US “Quality” index is falling like a paralyzed falcon while the SGI US Value index is up for 2022.

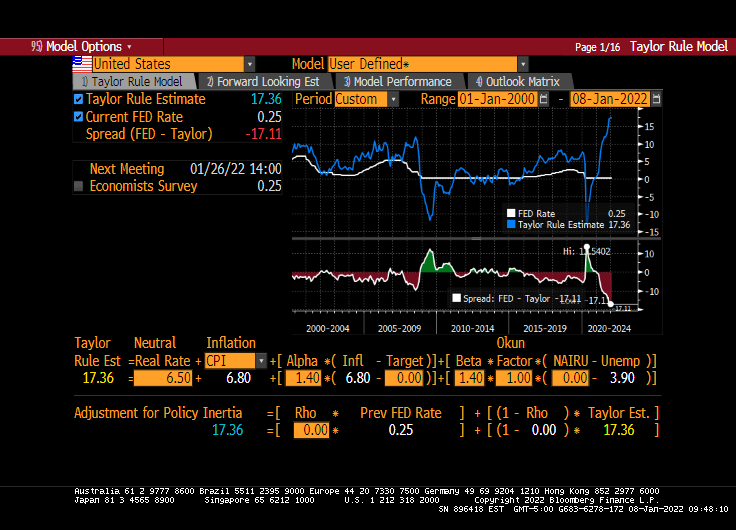
It is somewhat mystifying that markets would be soooooo sensitive to 3 rate increases from The Fed, particularly since the Taylor Rule suggests that The Fed’s target rate should be 17.36%. Even if you don’t like the Taylor Rule or disagree with its inputs, you must admit that the gap between where The Fed is (0.25%) and where they should be (17.36%) is … k-razy.

But here is where we sit.
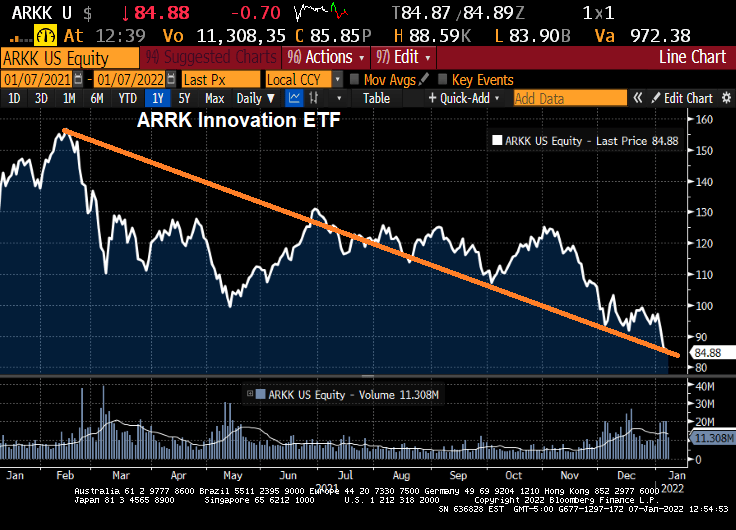
Is ARKK A Dog? ARRK Innovation ETF Down 46% Since Fed 12 (BARKK?)

Is Cathie Wood’s flagship fund a dog? Maybe she should rename it BARKK.

ARRK Innovation ETF is down 46% since Feb 12, 2021.

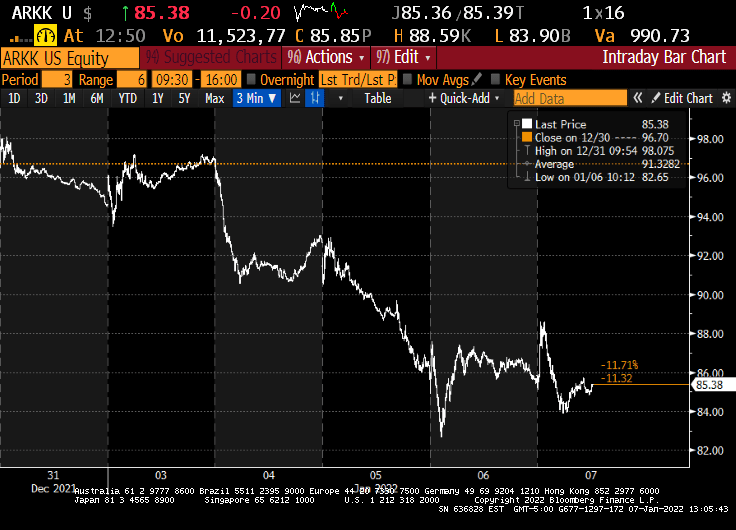
And this year? Same ETF, same dog.

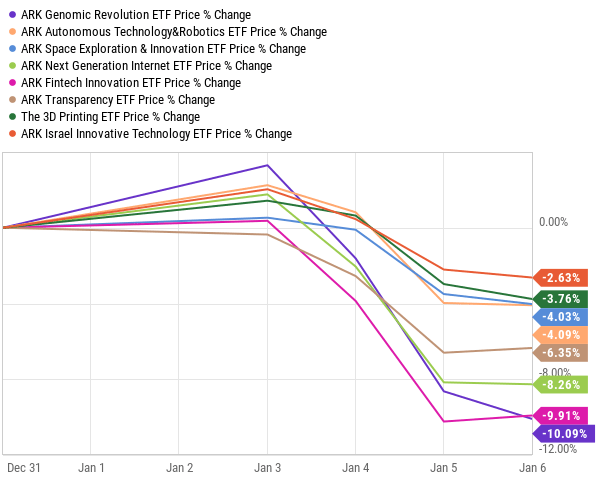
The ARK universe should be renamed the BARK universe.

Way to go Cathie!

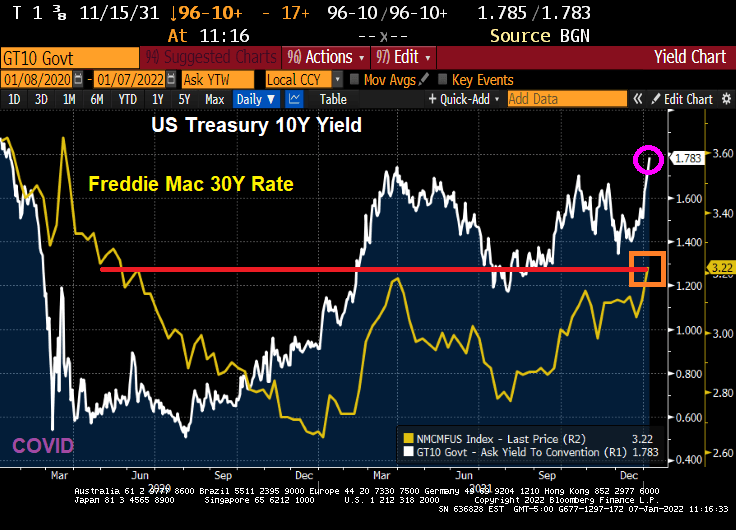
10Y Treasury Yield Climbs To 1.783% As Mortgage Rate Hits 3.22% (Highest Since May 2020) As Soaring Nominal Wage Growth Hits

It looks like markets are buying into the prospect of The Federal Reserve raising rates three times (Bob) in 2022. And ceasing COVID monetary stimulus.

Today, the 10-year Treasury yield rose to PRE-COVID levels of 1.783%. And the Freddie Mac 30-year mortgage commitment rate rose to 3.22%, the highest since May 2020.

Today’s rising wage rates (although negative in terms of REAL wage rates) will likely put a Peruvian fire under The Fed’s behind. As of this morning, Fed Funds Futures are still pointing to three rate increases in 2022 (May, July and December).

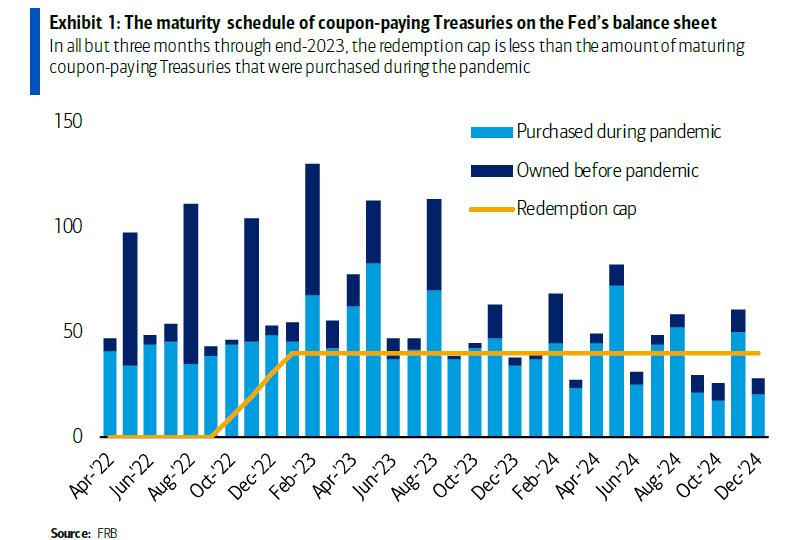
And The Fed is supposed to be winding down the COVID monetary stimulus.

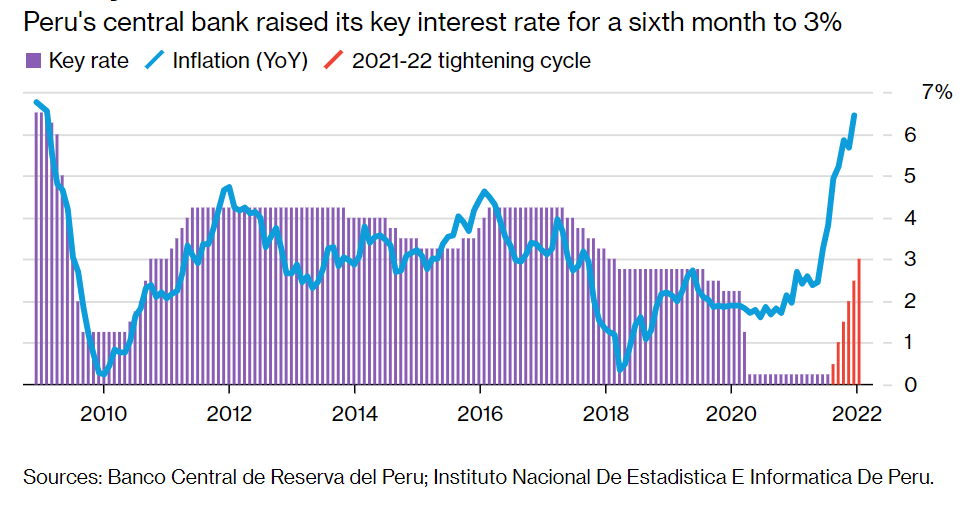
Why a Peruvian fire? Even Peru’s central bank is raising its key interest rate to 3% after soaring inflation.

Let’s see if Powell and The Gang follow through … or reveal themselves to be Peruvian Chickens.

Slowing! US November Jobs Report: Real US Average Hourly Earnings DECLINE -1.71% YoY (Only 199K Jobs Added Vs 450K Expected)

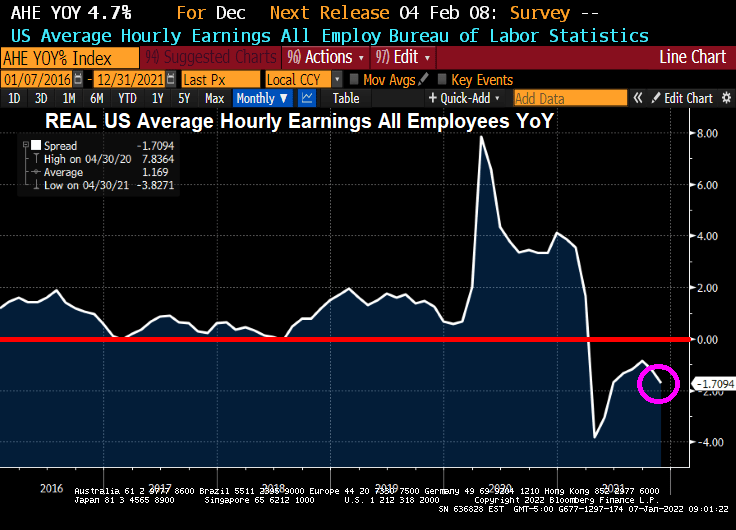
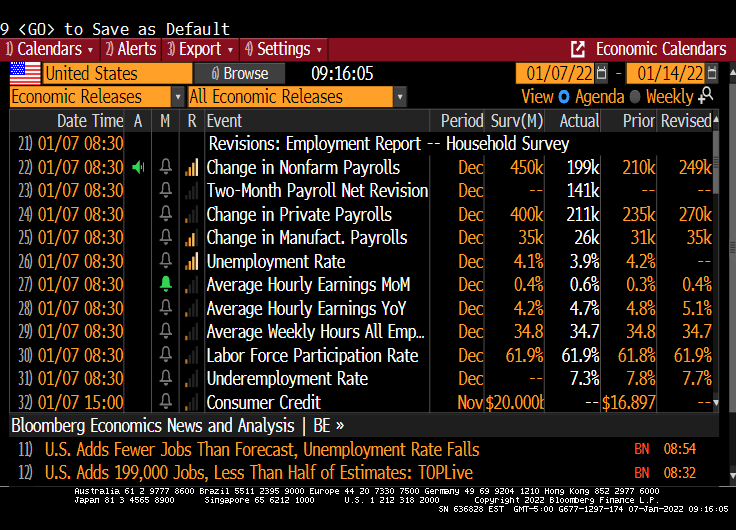
The November jobs report is out and the highlight is that US Average Hourly Earnings GREW at a rate of 4.7% YoY. Unfortunately, inflation is still raging resulting in REAL US Average Hourly Earnings DECLINING at a rate of -1.71% YoY.

REAL US home price growth is slowing and is at 12.856% YoY as REAL average hourly earnings slowed to -1.7094% YoY.

The lowlight of the November jobs report is that only 199K jobs were added versus the 450K jobs expected to be added. At least the unemployment rate fell to 3.9%.

WHERE we the jobs added? Leisure and hospitality led the way! Hey bartender.

Yes, REAL wage growth and REAL home price growth are slowing.

German Inflation Rises To 5.3% As 10Y Sovereign Yield ALMOST Rises To 0% (France Inflation 2.7% With 10Y Sov Yield At +0.25%)

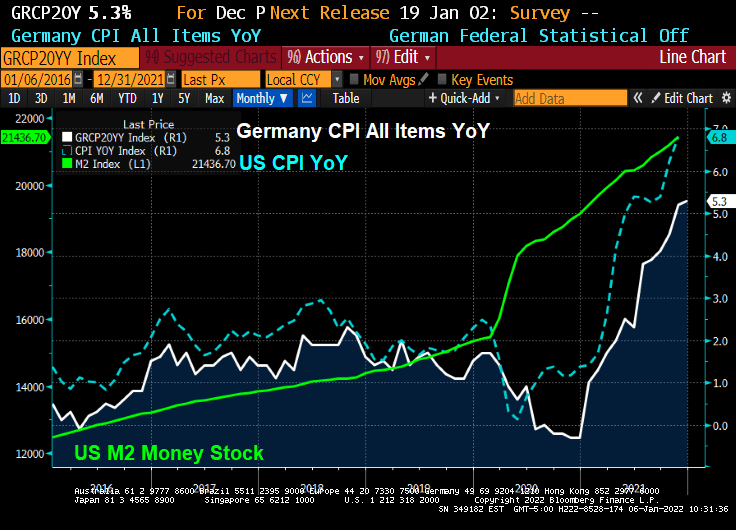
The world has become a wild and wacky place since COVID was unleashed on an unsuspecting population. Since the massive spending spree by The Federal government in the USA coupled with extraordinary monetary stimulus from The Federal Reserve, US inflation has shot up to 6.8% YoY.

German is also having an inflation moment. With their CPI YoY running at 5.3%, faster than the anticipated 5.1%.

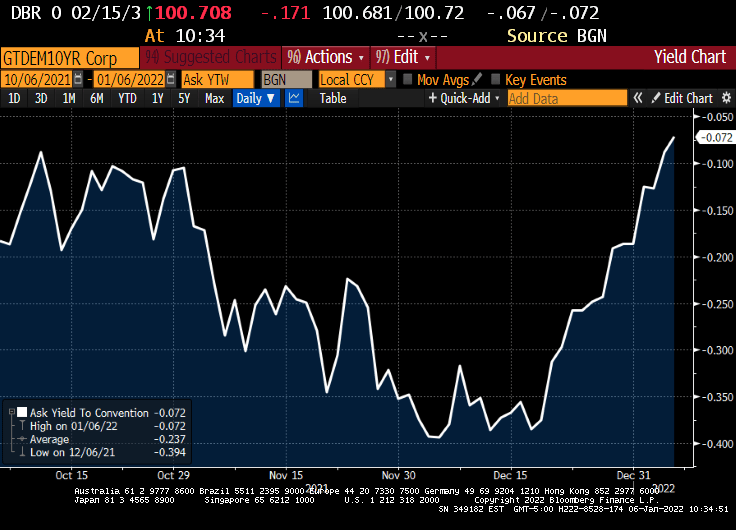
At least the German 10-year sovereign yield is ALMOST back to 0%.

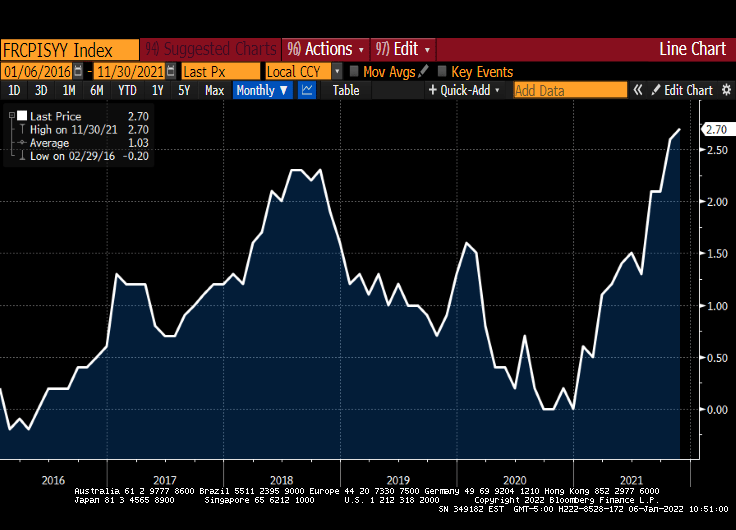
France, on the other hand, is seeing inflation rising to 2.70% YoY.

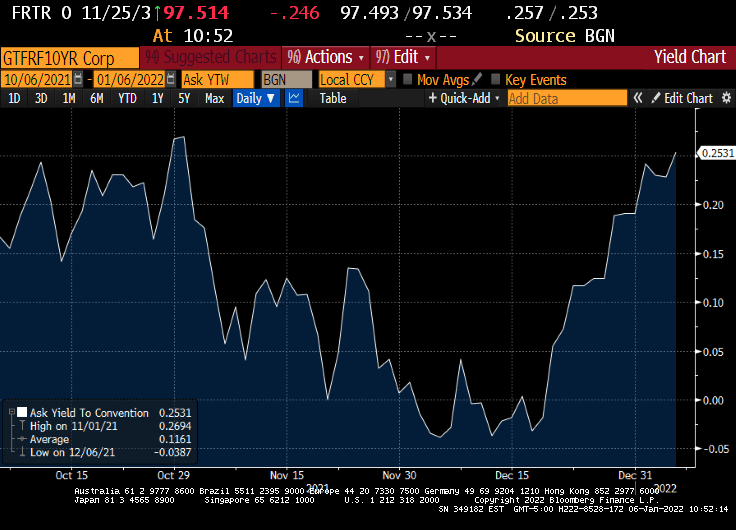
While the French 10Y sovereign yield rose to 0.2531%.

France’s Macron certainly likes to have his photo taken as if he wants to go 10 rounds with UK’s Tyson Fury.

Real Estate Hedge Against Inflation? Housing And REITs Did Better Than Inflation, NCREIF Not So Much

Now that inflation has reared its ugly head, how can investors protect themselves against the ravages of inflation?

Back in 1977, Fama and Schwert showed that housing acted as a hedge against inflation. Over the past year as inflation has reached its highest levels in 40 years, home prices have outpaced inflation by 19.08% to 6.8%.

How about real estate investment trusts? The NAREIT all-equity index rose by 35.6% YoY while inflation rose at 6.8%. The S&P 500 index rose 28.9% YoY.

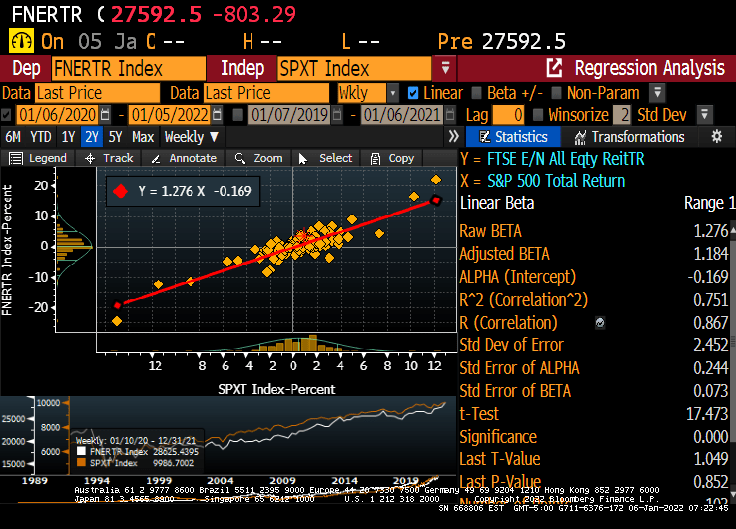
Of course, the NAREIT all-equity index has a beta of 1.276.

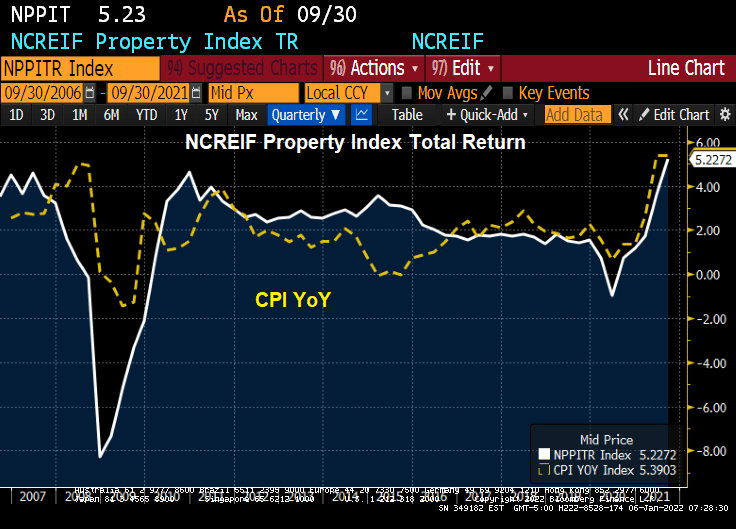
How about the NCREIF All-property commercial real estate index? For Q3, the NCREIF property index rose by 5.22%, less than the most recent inflation reading of 6.8%.

So for the past year, housing has beaten the pants-off inflation, REITs have earned a higher return than inflation, and the NCREIF index seems to be rising slower than inflation (but with its lag problems, I anxiously await the Q4 numbers which should be higher.

Tiny Or BIG Bubbles? Buffett Indicator, Shiller CAPE At Dangerous Levels Thanks To Fed And Their Champagne Policies

The Federal Reserve Open Market Committee meeting should have a Lawrence Welk bubble machine operating, particularly for their announcements.

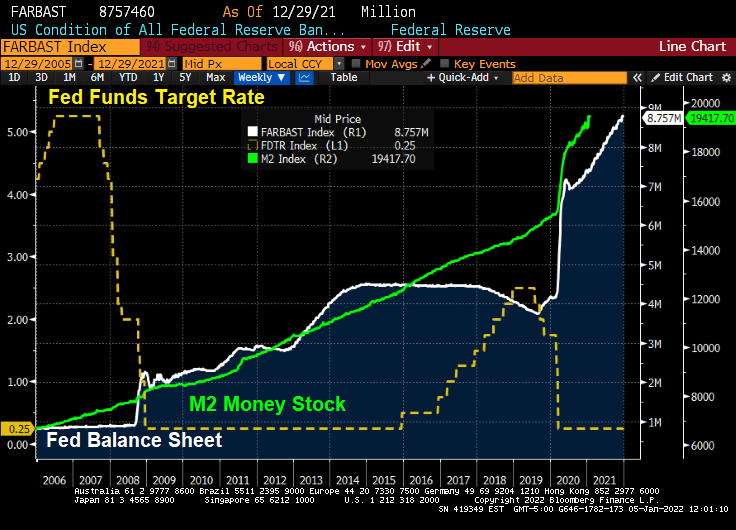
When we look at the Buffett Indicator, we can see how The Federal Reserve’s loose monetary policies (or follycies) are driving up stocks to unsustainable levels that may not survive without The Fed’s “Do Ho Big Bubble Policies.”

How about the Shiller CAPE (Cyclically-adjusted Price/Earnings) ratio? While not up to dot.com levels yet, the Shiller CAPE ratio is climbing with the assistance of The Fed and their insane money printing.

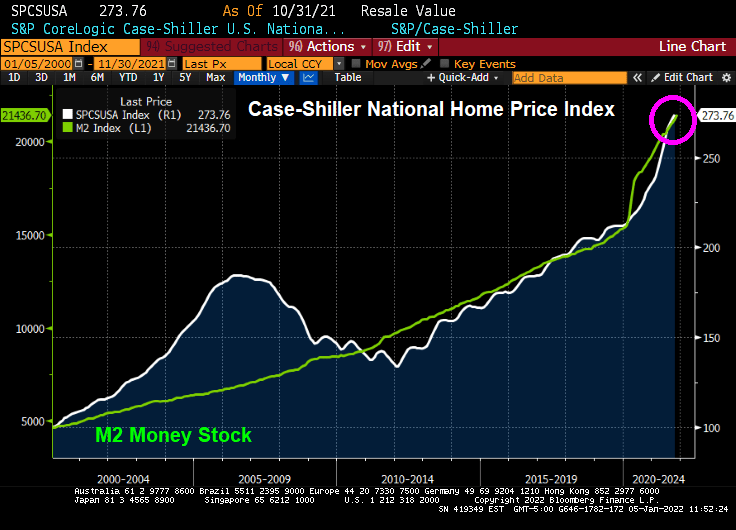
How about house prices? The Case-Shiller National home price index is far above the level last scene during the housing bubble of 2005-2007. Again, with a little help from The Federal Reserve.

I can’t wait to see how the equity market and housing market reacts IF The Fed actually follows through with reducing monetary stimulus. Probably not just adding more stimulus, just reinvesting the Treasury and MBS proceeds (aka, not shrinking the balance sheet).

Speaking of Lawrence Welk and his Champagne Music Makers, watch the blazing-hot electric guitar work worthy of Steve Morse or Jimmy Page in this video.

Here is the new logo for The Federal Reserve.

Mortgage Purchase Applications Plunge 10% WoW At End Of 2021 (But It Happens Every Year!)

The last mortgage purchase applications index from the Mortgage Bankers Association was released this morning. The headline is “Mortgage Purchase Applications Plunge 10% WoW (since the previous week). But this is called “Seasonality.” And it happens EVERY YEAR.

Here is a chart of mortgage purchase application (NON-seasonally adjusted). What will happen when the new year starts and purchase applications began rising?

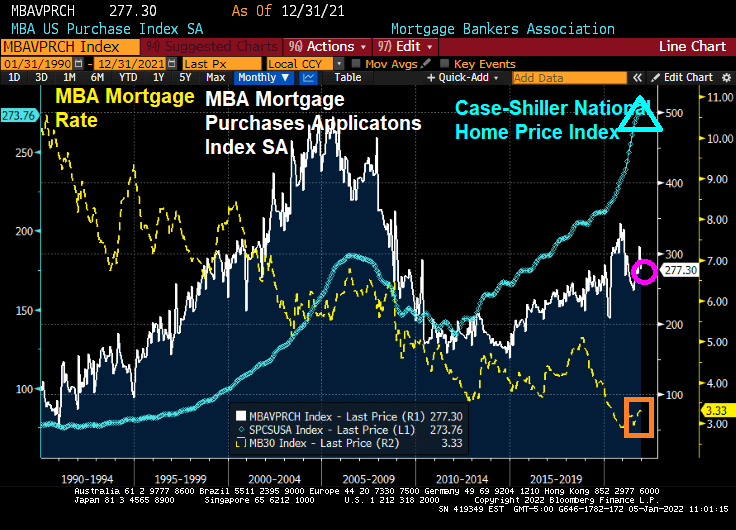
Whether seasonally-adjusted or not, all number are down for the final week of 2021, except for the 30-year mortgage rate that rose 60 basis points.

On a seasonally-adjusted basis (aka, smoothed-out), we can see the impact of super-low mortgage rates on home prices.

Here is the data summary for the last week of December 2021. All indices are down … except for the 30 year mortgage rate which was up 60 basis points.

So let’s see what 2022 brings with The Fed threatening to shrink the balance sheet and raise their target rate 3 times. As Parks and Recreation’s Joan Calamezzo said, “We’ll see.”