Bidenomics? US Treasury Rates Rise As US Fiscal Deficit Back To Financial Crisis Levels As Tax Revenues Collapse

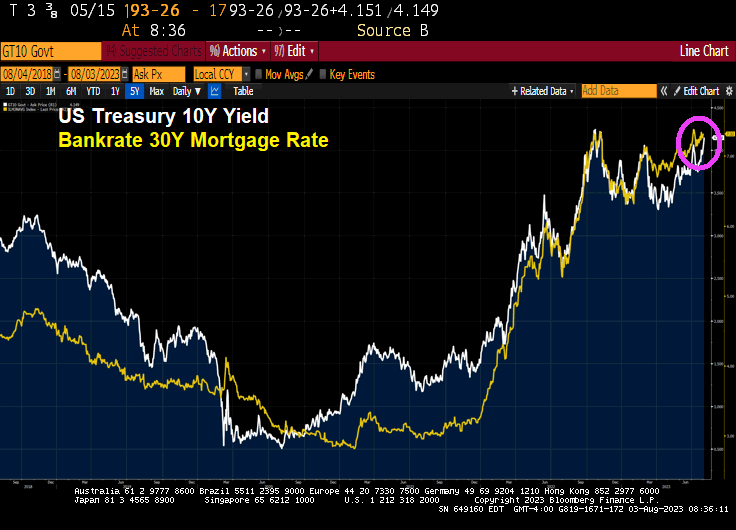
US Treasury yields are up today along with 30-year mortgage rates. There is a lot happening in bond markets.
It’s been a tumultuous week for yields, with the Bank of Japan’s policy tweak, and the Treasury increasing its funding needs. But Fitch was the weatherman with its US downgrade, telling us about the downpour we can see for ourselves just by taking a glance at the fiscal data. In short, the US faces a perfect storm of a vertiginous fiscal deficit, a near-historically swollen debt load, ballooning interest-rate costs and collapsing tax revenues.

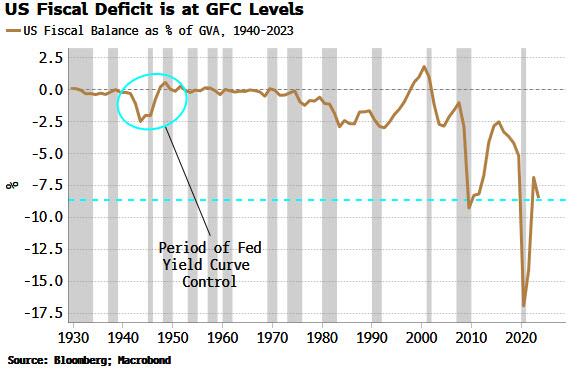
First, the deficit. It’s close to historical wides, bigger than it’s ever been outside of a recession, and almost as wide as it was in the depths of the GFC. It’s the largest in the world in GDP terms, and it is currently heading in the wrong direction. This heaps more pressure on the government debt-to-GDP level, already uncomfortably high at 112%.

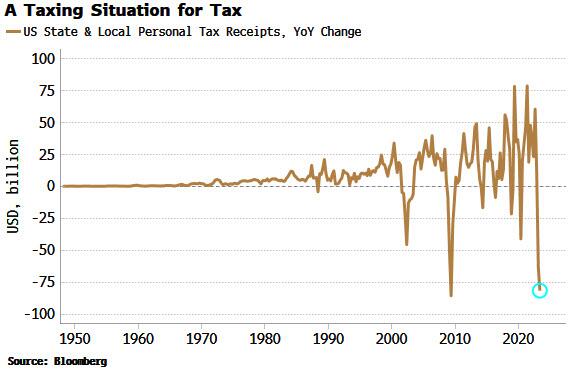
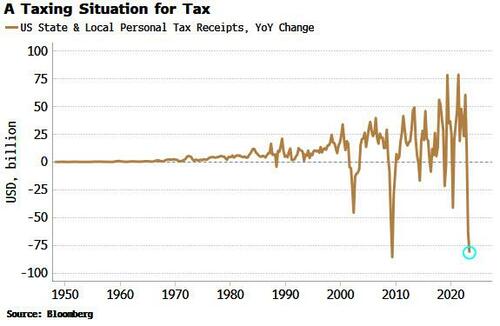
Second, tax revenues. These have seen almost their largest annual fall ever, in an economy that’s supposed to be growing at 2.4%.
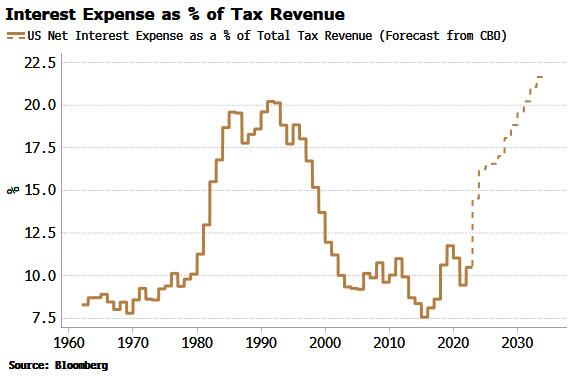
And then there’s rising interest-rate costs. The total interest expense as a percentage of tax revenue is expected to rise sharply in the next year or two, and make new highs by the end of the decade. However, these CBO forecasts should be taken with a grain of salt as they are based on a 10-year yield of only 3.8% (the ten-year average has been higher than that in every decade bar the 2010s and 2020s).

My former student at University of Chicago’s MBA program, Kevin Smith of Crescat Capital, has this charming chart of state and local income tax receipts collapsing.

There is a view the Treasury is already implementing YCC, based on the fact it has been skewing its issuance towards bills and away from coupons. But issuing more bills is simply the easiest and fastest way for the Treasury to replenish its account at the Fed (the TGA). It was run down to almost zero in the lead-up to the debt-ceiling limit, and has now risen to over $500 billion.

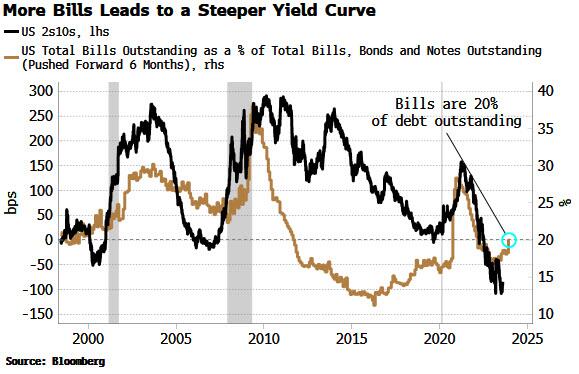
This level of bill issuance is not unusual. The Treasury has an implicit target of about 20% for the amount of bills outstanding as a percentage of total debt. As we can see from the chart below, bills have often been more than 20% of debt outstanding over the last 30 years. Moreover, the Treasury announced this week it was raising its coupon-issuance amounts.
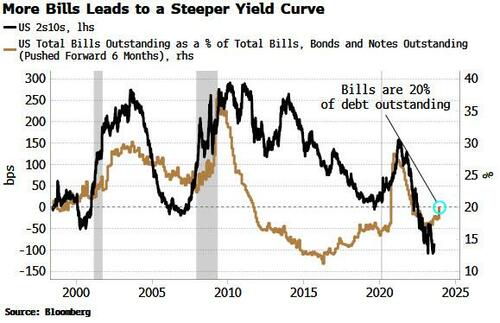
According to the stealth YCC thesis, less longer-dated Treasury issuance implicitly caps longer-term yields, but this has not historically been the case. As the chart above shows, the yield curve typically steepens – not flattens – when there is greater bill issuance – the opposite of what is desired by YCC.

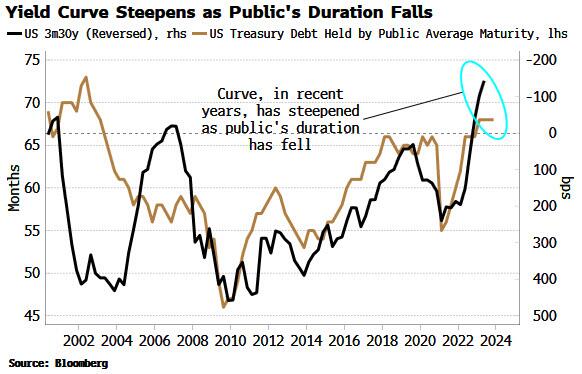
We see the same relationship if we look the duration of US government debt outstanding. When the average duration falls – as it would if issuance is skewed toward bills – the yield curve tends to steepen. The current average duration held by the public is consistent with a steeper, not a flatter, yield curve.
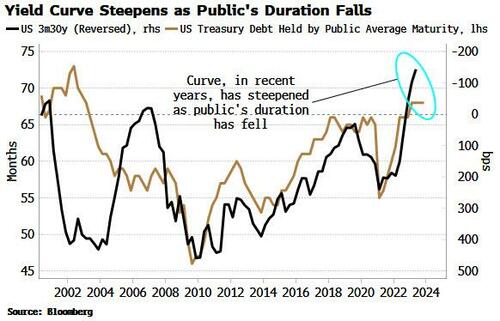
This sounds counter-intuitive. If issuance drives yields, then more issuance at the front-end of the curve versus the longer end – equating to a fall in duration – implies the yield curve should flatten.

But the fact the relationship is the other way implies it’s likely that demand is the more dominant driver of yields in the medium term. There is ready-made demand for bills, from MMFs, etc, so when supply increases, demand rises to meet it, suppressing the yield-curve impact.

It’s thus hard to argue the Treasury is engaging in yield curve control. But that does not detract from the rising possibility it will need to be implemented in some shape or form eventually.

Banks and the Fed are reducing their Treasury holdings, while foreigners now collectively own about $5 trillion less USTs – about 10% – than they did in 2021. At the same time the “Treasury put” means large fiscal deficits are likely to become a feature, not a bug. That means inflation is likely to become embedded.

Fiscal profligacy and elevated price growth are a combustible mix and a road to prohibitively high yields via rising term premium. Yield capping thus starts to look like the endgame.

How it’s done is another matter, whether it’s the Fed co-opted to cap yields as it was in WWII, Treasury buybacks, or financial repression, whereby domestic institutions are forced to hold more government debt. Whatever way, at some point yield curve control in the US is becoming increasingly likely – by stealth or otherwise.
But never fear! Janet “Too Low For Too Long Creating Asset Bubbles” Yellen is still US Treasury Secretary.


Gov Gone Wild! Wild Federal Spending, Massive Deficits And Soaring Interest Payments On Debt Requires More Fed Intervention (Bidenomics At Work!)

The US Fiscal position is very bad and the US is beginning to look like  a third world economy.  And with Biden and Democrat AGs filing indictments against Biden primary Presidential oppoonent, that country is Venezeula! Like skyrocketing interest on the Federal debt to pay for green energy hustlers and the Ukraine war.

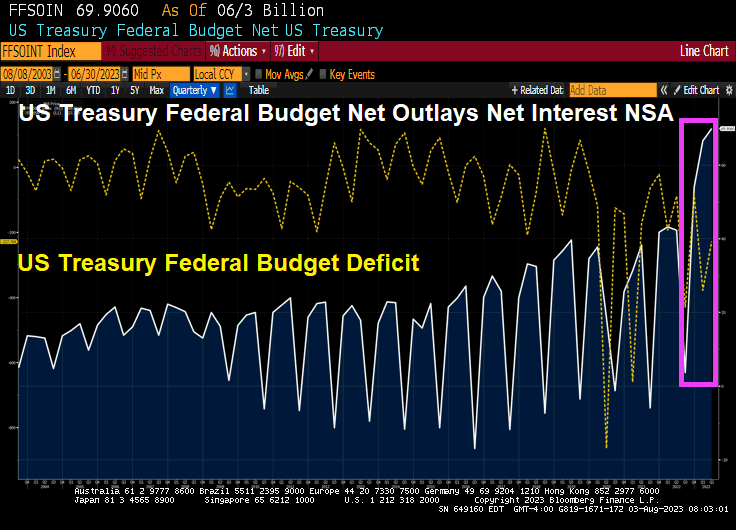
The US Federal Deficit continues to grow as seen in the charts below. A $2.25 Trillion dollar run  rate deficit is significantly worse than the $1.3 Trillion that was recorded in Fiscal 2022. This level of  deficit is unprecedented in an economy with low unemployment and theoretically no recession.  Naturally, we ask just how big the deficit will be if we have either a recession or a crisis? In the dotcom  bust, the GFC and the COVID shock, the deficit expanded massively.

Taking Garic’s math one step further, the US incurred a deficit of $1.3T in Fiscal 2022 (September). If  the current run rate is sustained that would imply an annualized deficit of $2.9 Trillion. 

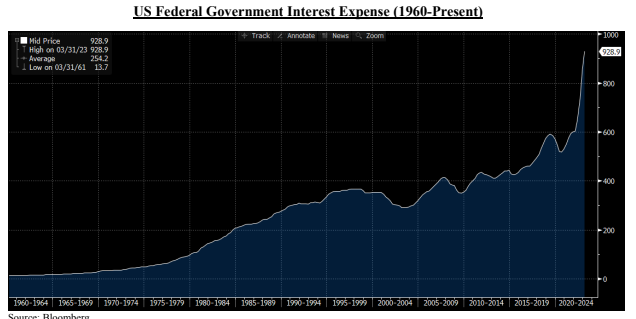
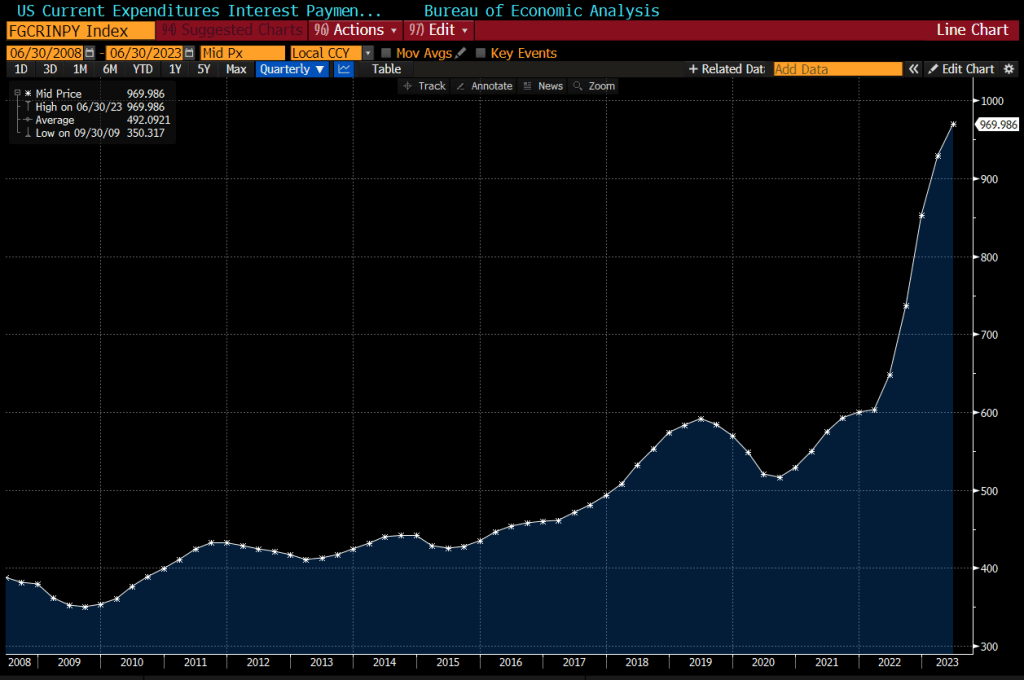
Of course, one big driver of this deficit is the interest cost incurred by the Government itself. It is rapidly  approaching a $1 Trillion dollar run rate which means the Government is spending more in interest than  on national defense. As you can see in the schedule below, the Fed’s rate hiking campaign has been very  expensive for the US Government since a large portion of the federal debt is in shorter maturities which  currently pay ~ 5.3% in interest. As recently as September of 2021, many of these same securities had  much lower interest cost – as low as only 10-30 basis points. 

Looking at the chart above, we wonder: is there anything about this that looks remotely sustainable? We  are at that point in the movie where raising interest rates to fight inflation actually makes things (including  inflation) worse. Worse because deficits swell and will need to be monetized. 

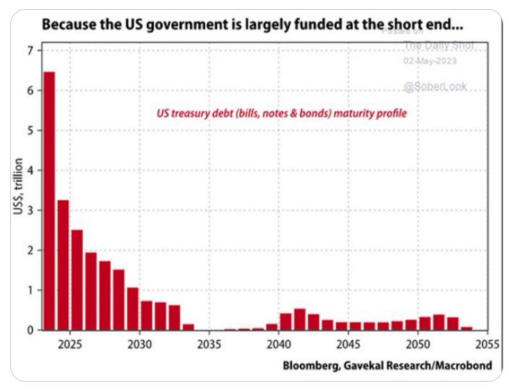
Furthermore, the issue is acute because the US Government uses the short-term bond market to Fund  most of its debt. As the chart below from Gavekal Research/Macrobond shows, the Government needs  to roll over $6 Trillion of maturing notes in 2023 and $3 Trillion of notes in 2024. This does not take  into account any of the roughly $1.2 Trillion of bonds and notes that will be sold into the market by the  Fed if Quantitative Tightening continues. Nor does it account for the ever increasing US Federal Deficit  which will easily exceed $2.2 Trillion this year. 

In short, the US Government has some serious funding challenges particularly when we consider that  foreigners have been net sellers of our bonds since 2014.

IT’S THE DEBT, STUPID 

On January 19, 2023 the US Federal Government hit its debt ceiling of $31.4 Trillion. Extraordinary  spending measures kicked in which allowed the Government to keep operating. This lasted until June  when Treasury Secretary Yellen informed Congress that a debt default was imminent if the ceiling was  not raised. 

After the usual political posturing, Congress did two things: (i) they agreed to place a two year cap on  spending increases for a small portion of the budget that amounted to only 7% of the total budget. (like  placing a band aid on a gaping wound); and (ii) they agreed to suspend the debt limit and to not replace  it with another figure until January of 2025. We do not think they have ever.

Put it differently, let’s call this “Government Gone Wild!”

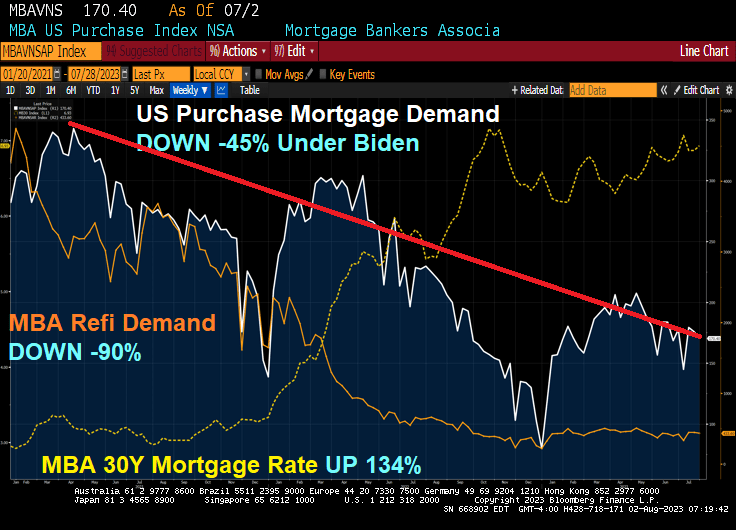
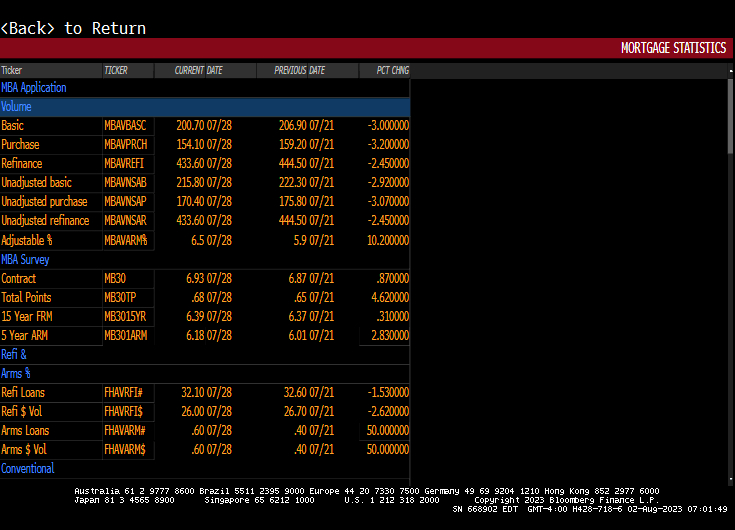
Bidenomics! Mortgage Demand Decreases 3.0% From One Week Earlier, But Purchase Demand Down 26% From Last Year, Down -45% Under Biden While Mortgage Rates Are UP 134% (US Interest Expenses Surged By 50% In Past Year To Nearly $1 Trillion On Annualized Basis)

Inflation under Biden has been very painful for the US middle class and low wage workers. That inflation has resulted to surging mortgage rates thanks to The Fed’s counterattack.

The result? Mortgage rates are up 134% under Bidenomics, while mortgage purchase demand is down -45% since Biden was selected. And mortgage refinancing demand is down a staggering -90%!

Mortgage applications decreased 3.0 percent from one week earlier, according to data from the Mortgage Bankers Association’s (MBA) Weekly Mortgage Applications Survey for the week ending July 28, 2023.

The Market Composite Index, a measure of mortgage loan application volume, decreased 3.0 percent on a seasonally adjusted basis from one week earlier. On an unadjusted basis, the Index decreased 3 percent compared with the previous week. The Refinance Index decreased 3 percent from the previous week and was 32 percent lower than the same week one year ago. The seasonally adjusted Purchase Index decreased 3 percent from one week earlier. The unadjusted Purchase Index decreased 3 percent compared with the previous week and was 26 percent lower than the same week one year ago.

US interest expenses have surged by about 50% in the past year, to nearly $1 trillion on an annualized basis.

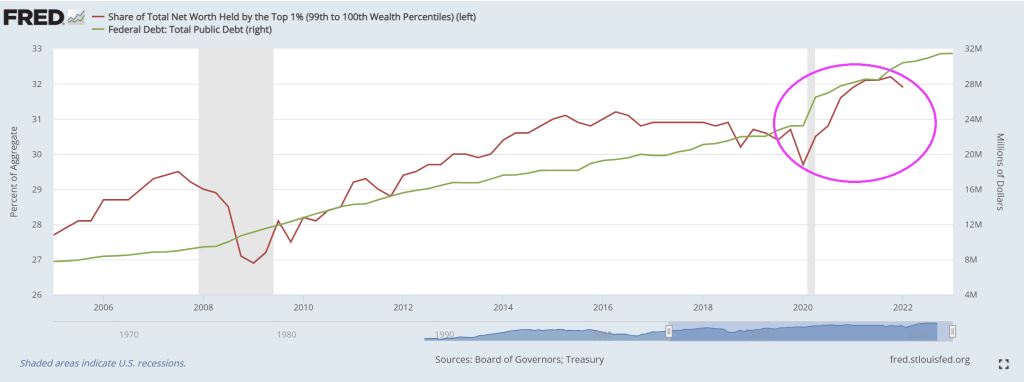
Look at the share of net worth by the top 1% as Treasury borrows more money.

Oddly, Biden is not talking about about putting US government policies up for sale to the highest bidders. But don’t worry. Biden is the King of Corruption in the District of Corruption (Washington DC).

Bidenomics! Wheels Come Off The “Strong Jobs” Myth As Job Openings Drop To 2 year Low (Number Of Hires And Quits Plunge As Fed Withdraws Monetary Stimulus)

The wheels are coming off the Bidenomics recovery.
US job openings (JOLTS) keep declining as The Fed withdraws its Covid sugar splash of monetary stimulus and raise The Fed’s target rate.
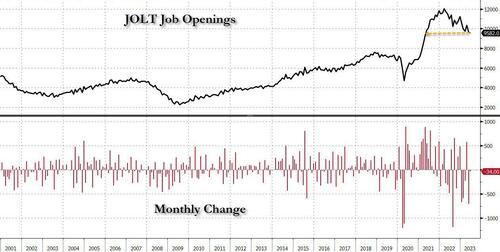
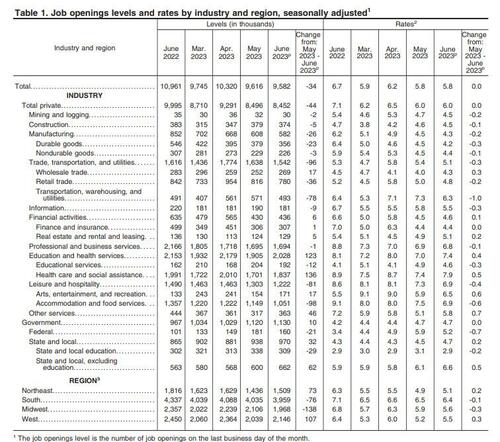
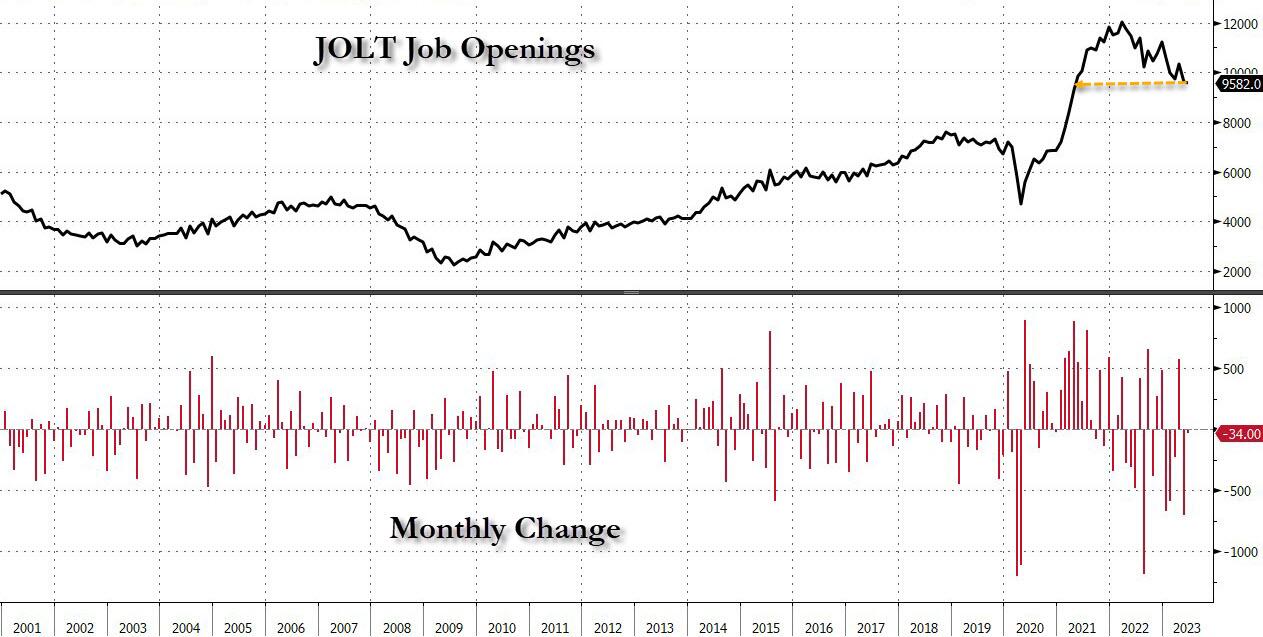
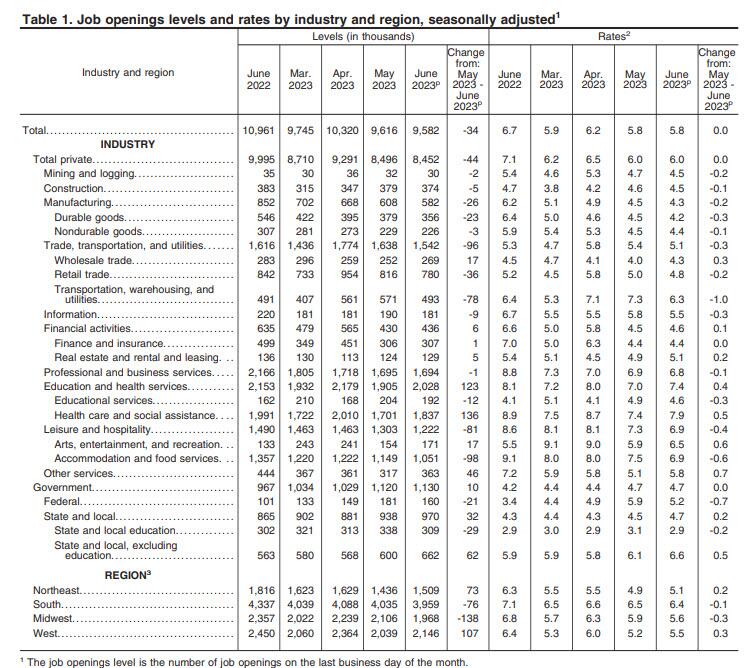
For those enthralled by the narrative that AI will cause a margin-busting corporate revolution as millions of well-paid, middle-management employees are replaced by a cheap “bullshitting” AI algo, then today’s latest JOLTS report may come as a bigger shock than the big drop in job openings from one month ago. That’s because after unexpectedly dumping by 496K in May (a number which has been revised far worse of course), the BLS just reported that in June the number of job openings was practically unchanged, dropping by just 34K, to 9.582MM from a downward revised 9.616 million. And while the monthly change was modest after the downward revision of course, the total was dragged to the lowest level since April 2021.

The number was about 1.4 million below the 11 million from a year ago and below the consensus estimate of 9.6 million, a rare miss in a series which has been best known for decisively beating Wall Street’s expectations.

According to the BLS, the largest increases in job openings was in health care and social assistance (+136,000) and in state and local government, excluding education (+62,000). Job openings decreased in transportation, warehousing, and utilities (-78,000), state and local government education (-29,000), and federal government (-21,000)

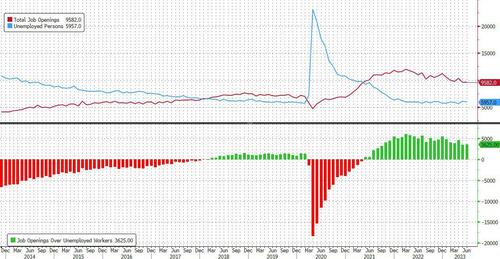
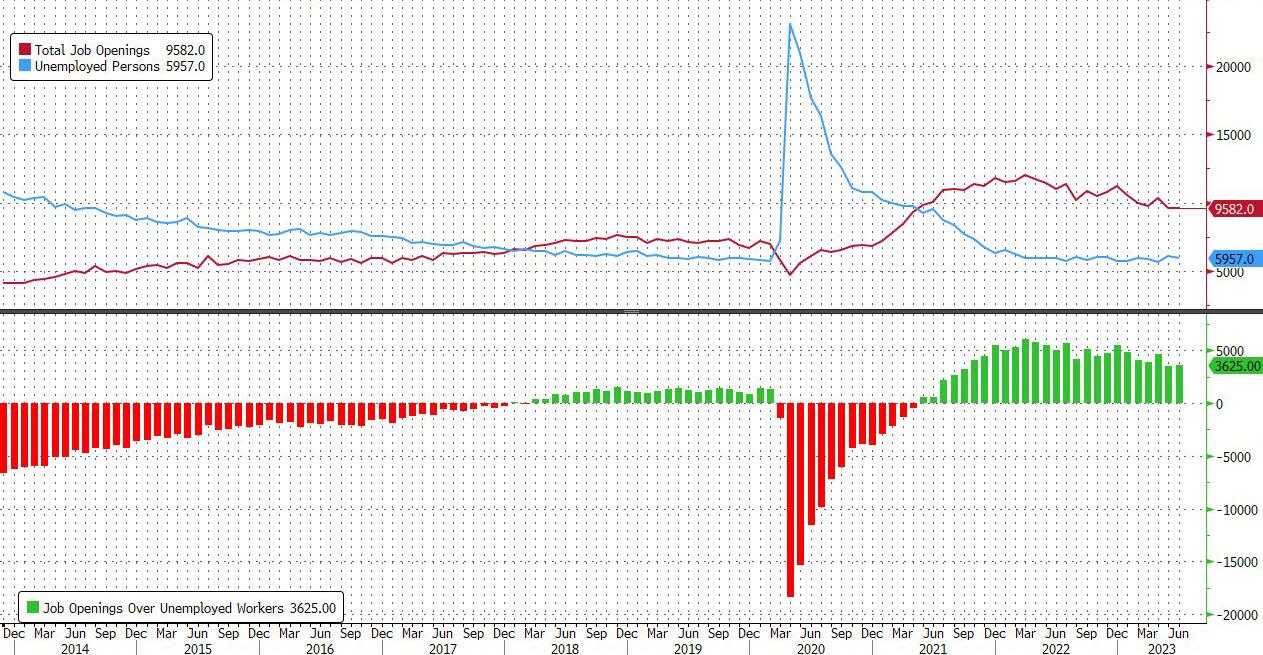
The slide in the number of job openings meant that after rising to the highest since January 2023 in April, in June the number of job openings was just 3.7625 million more than the number of unemployed workers, the lowest since Sept 2021.

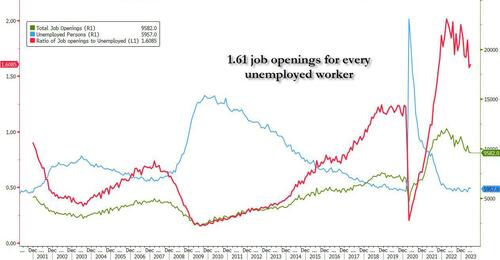
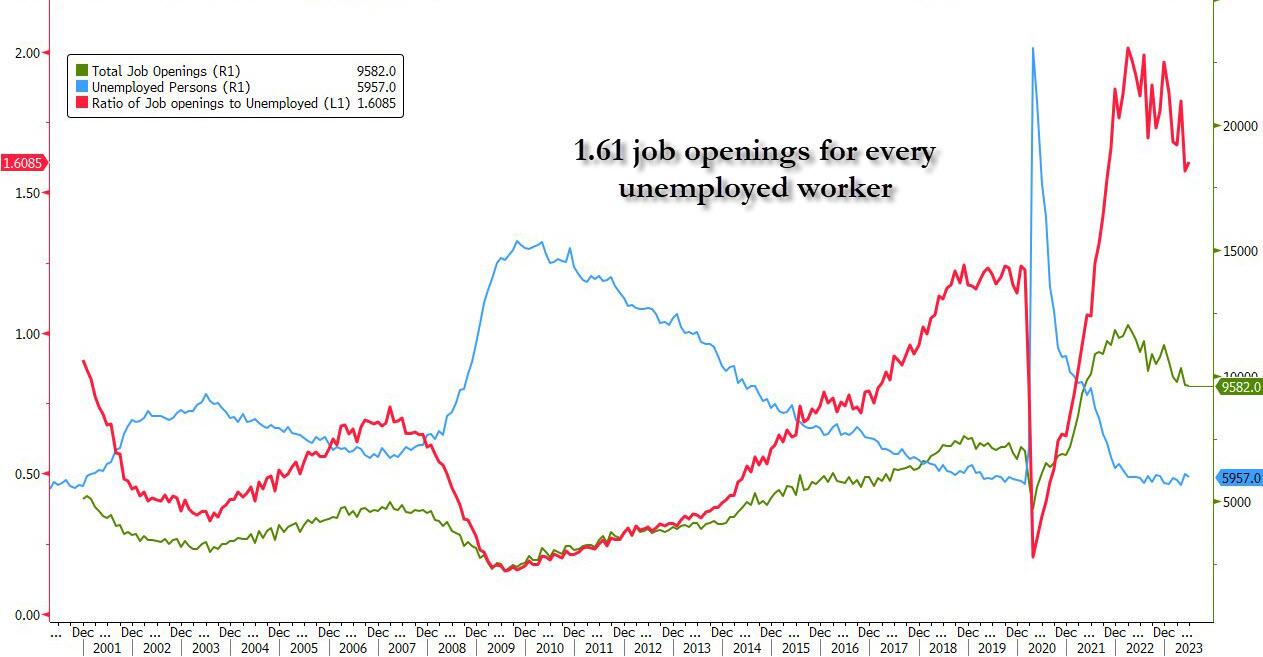
Said otherwise, after rising to 1.82 openings for every worker in April, in June the number dropped to just 1.61, which would have been the lowest level since Oct 2021 if it weren’t for last month’s sharp downward revision.

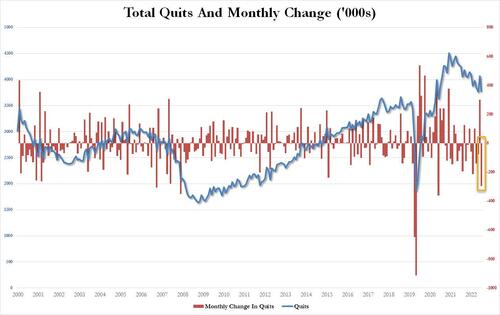
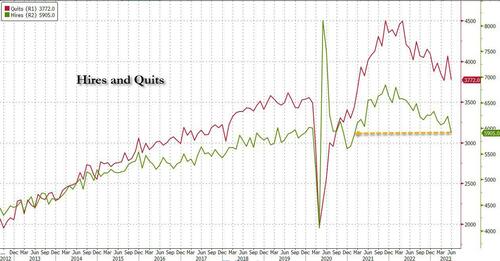
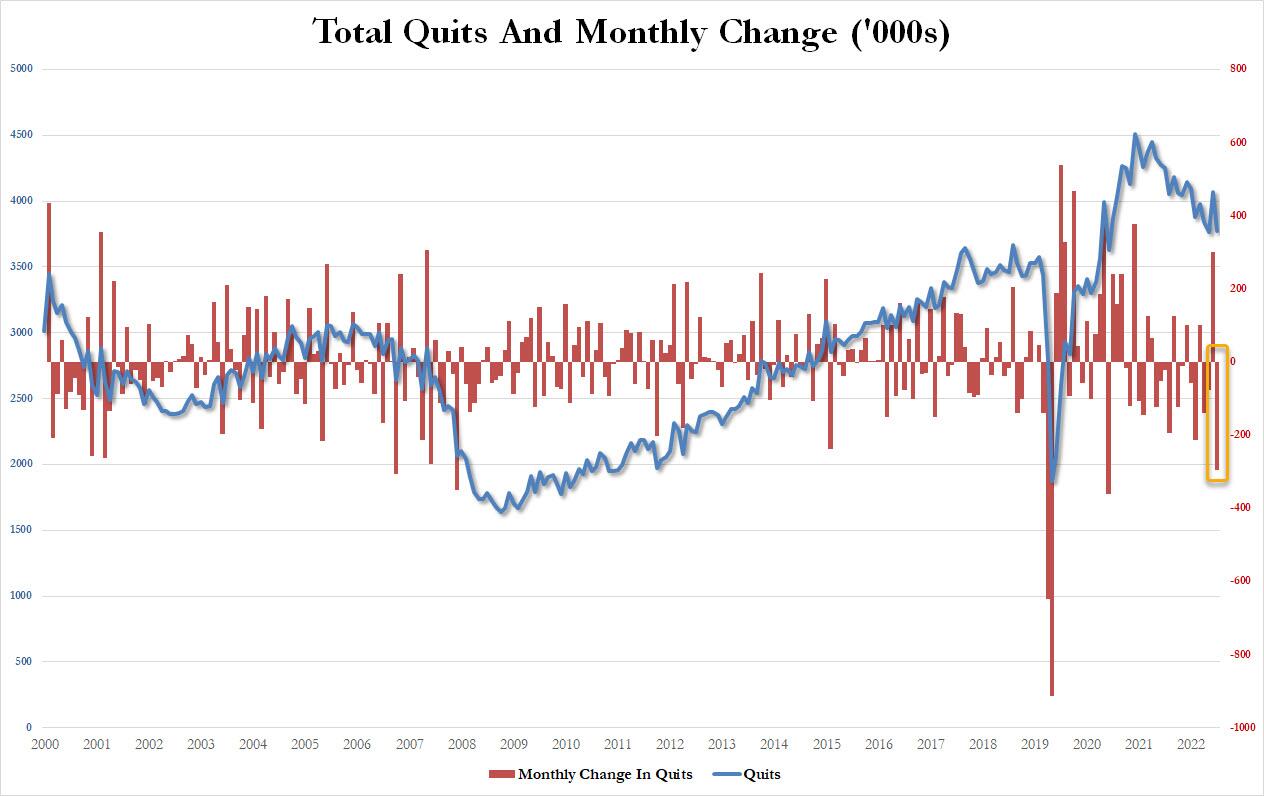
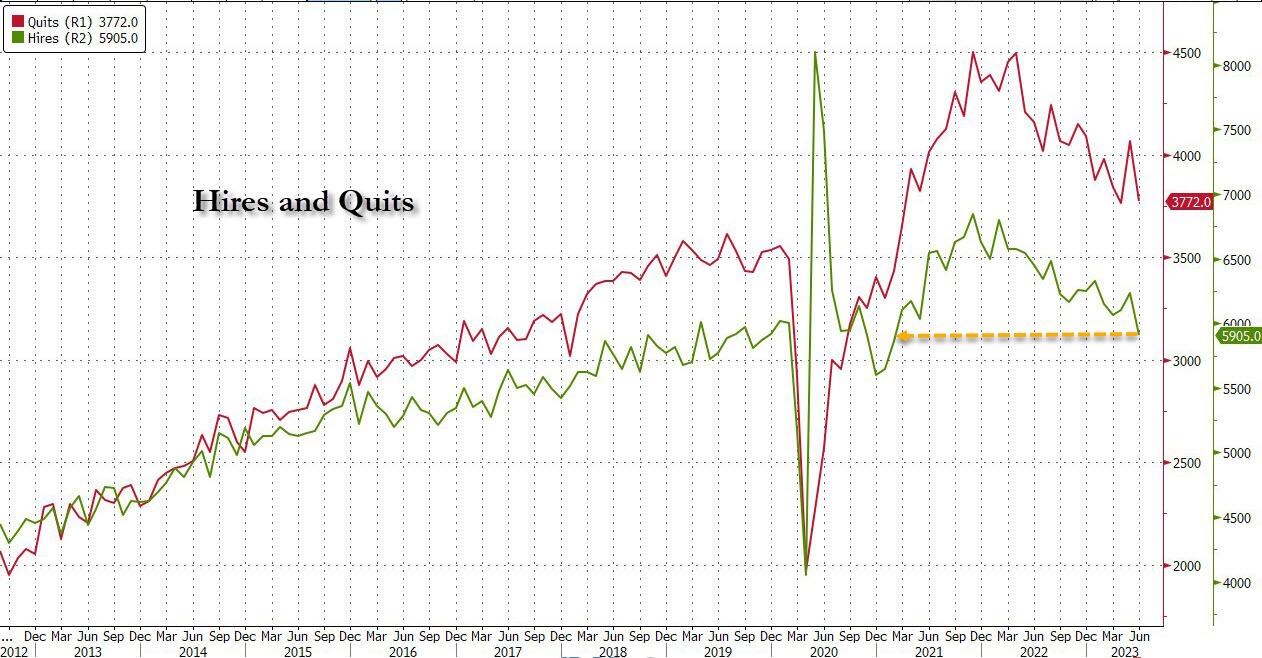
Yet even as the number of job openings dropped only modestly from the (sharply) downward revised print for May (because under Biden, no number is ever revised stronger), conflicting data remained and in June, the number of people quitting their jobs – an indicator traditionally associated with labor market strength as it shows workers are confident they can find a better wage elsewhere – unexpectedly tumbled by 295K to just 3.772MM, the biggest monthly drop since May 2021.

According to the BLS, the number of quits decreased in several industries, with the largest decreases in retail trade (-95,000), health care and social assistance (-75,000), and construction (-51,000). The number of quits increased in arts, entertainment, and recreation (+20,000).

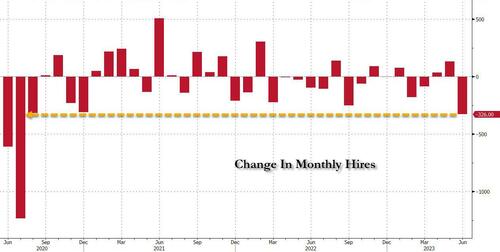
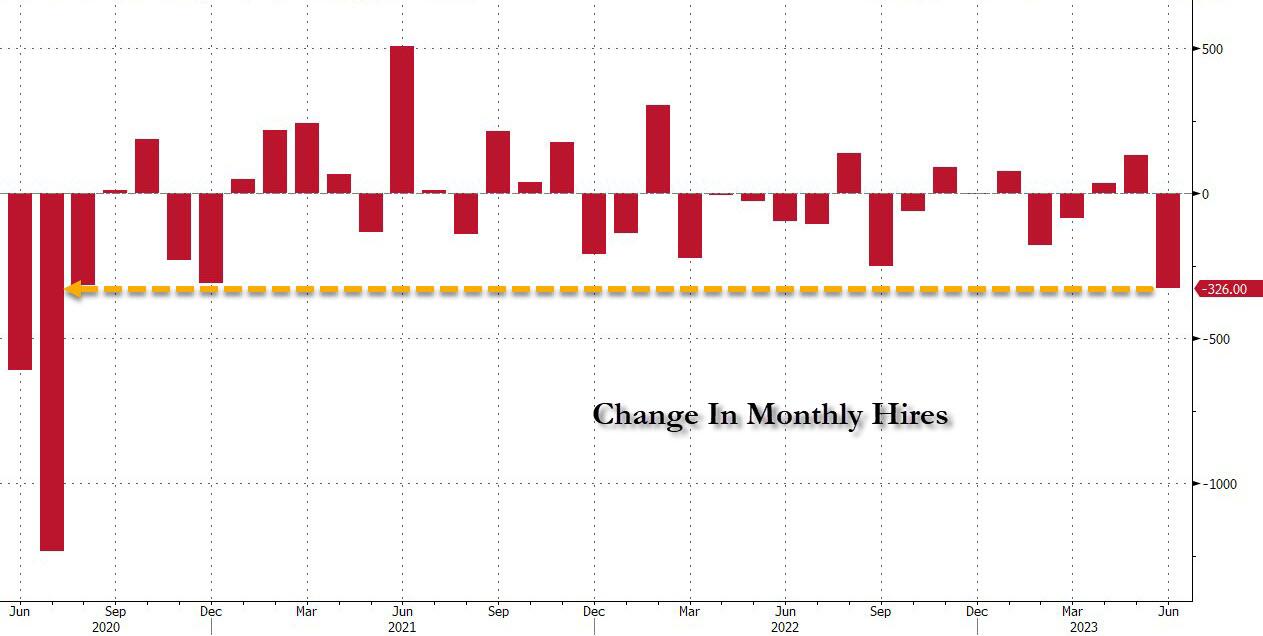
And just in case some still believe Biden’s strong jobs lie, the number of hires also tumbled in June, crashing by 326K – the biggest monthly drop since July 2020…

… to 5.905MM, the lowest since February 2021.

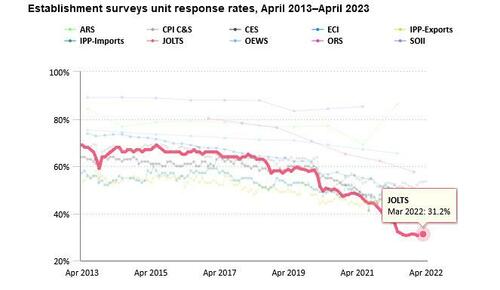
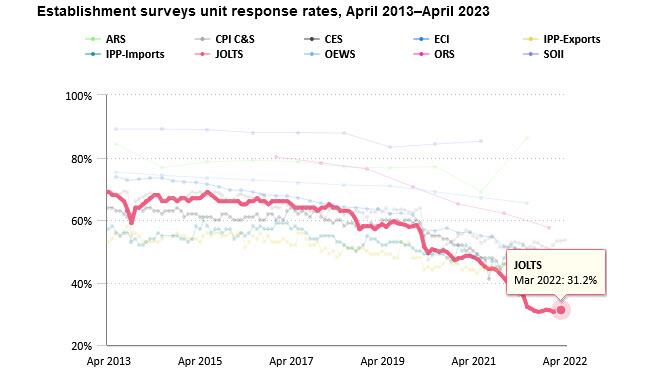
Of course, as we have explained on multiple occasions previously, none of the above data actually matters or is credible for the simple reason that the response rate of the JOLTS survey is stuck at a record low 31.2%. Which means that only those who actually have job openings to report do so, while two-thirds of employers are either non-responsive or their mail is quietly lost in the mail.

Wheels. Of massive corruption and debauchery.

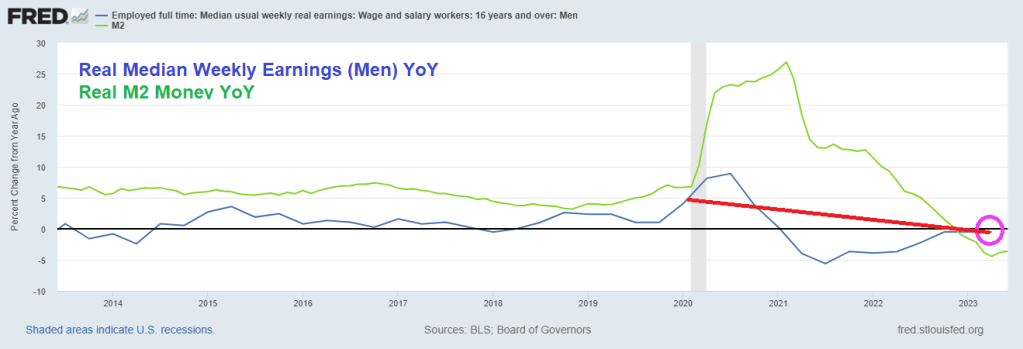
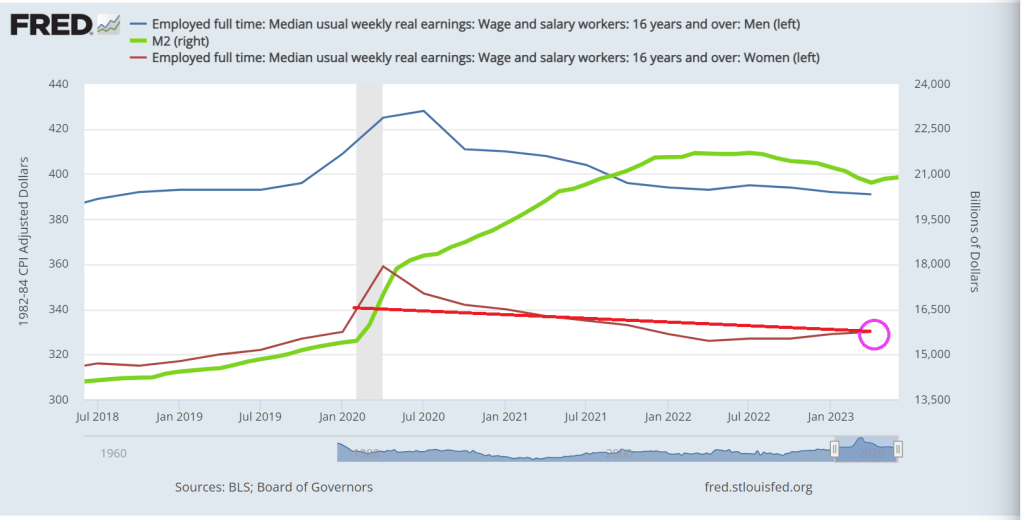
Bidenomics (Or Yellenomics)! Real Weekly Earnings For Men LOWER Under Biden Than Jimmy Carter! (Men’s Real Weekly Earnings DOWN -9% Since Q2 2021 While M2 Money UP 31%)

President Jimmy Carter is usually the bar for terrible Presidents. Under Carter, the US experienced economic stagnation and soaring inflation. At least it led to the election of Ronald Regan!

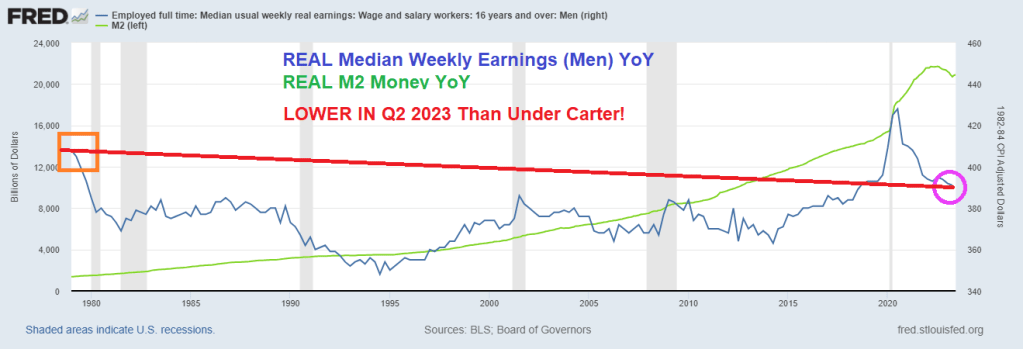
So, Biden’s much mentioned Bidenomics have produced REAL MEDIAN WEEKLY EARNINGS FOR MEN that is currently below 1979 levels under Jimmy Carter.

Even worse for Bidenomics, REAL MEDIAN WEEKLY EARNINGS GROWTH FOR MEN was -4.45% In April 2023, while the last reading prior to Covid under Trump was 6.674% YoY in February 2020. So, Bidenomics isn’t even back to Trump levels for men.

I like this chart which I call “Yellenomics” because it illustrates The Fed’s Folly of money printing and its impact on real earnings. After the Trump wage growth boom, real median weekly earnings for men has been steadily declining.

Women, on the other hand, did show a gain since Carter, but still lower than the last month before Covid struck. Women’s real median weekly earnings growth YoY since Q2 2021 are down -5%. So, Bidenomics has been less sucky for women than men.

Reminds me of The Yardbird’s classic “I’m A Man.” Worse off under Biden than under Jimmy Carter. Although The Yardbird’s “Over Under Sideways DOWN” is more emblematic of Bidenomics.

Bidenomics should be renamed Corruptionomics given Biden’s habit of selling government influence to anyone willing to waive a few million.

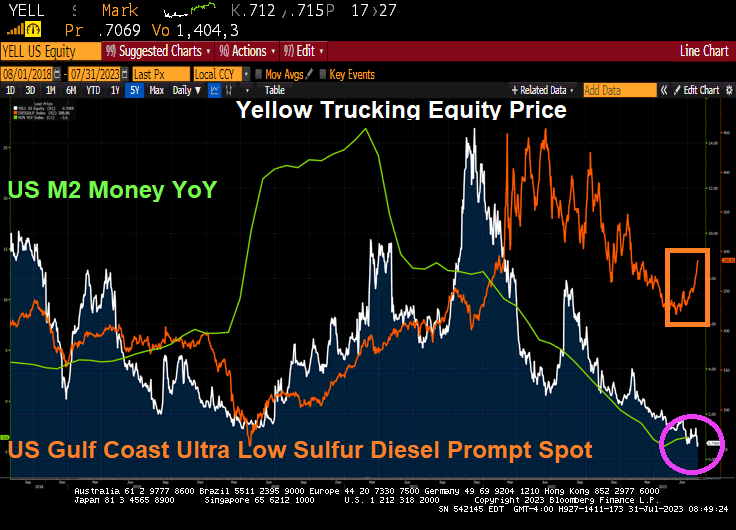
Another Bidenomics Casualty! Trucking Giant Yellow Ceases Operations (Unions + Diesel Fuel Costs = FAILURE)

Biden: “Its my Presidency and I’ll lie if I want to.” As well as demolish the economy to serve his Progressive green energy agenda.

One of the casualties? Yellow trucking. Carrier Yellow Corp. ceased all operations at 12 p.m. Sunday, according to a notice on the gates at its terminals. Its stock price is now sub $1.

Separate internal documents showed the procedures for closing the facilities as well as “talking points” to be used when informing union employees not to show up for their shifts. The documents indicated the company plans to issue a public statement Monday updating “the state of the company and the operation.”

On Friday, Yellow laid off most of its nonunion employees in areas like customer service, information technology and sales. The company stopped making pickups earlier in the week and has been delivering the remaining freight in its network ahead of what appears to be a permanent closure.  

After months of negotiations with its Teamsters workforce, the carrier has been unable to reach terms over proposed operational changes it has said were required for its survival. In a breach of contract lawsuit filed last month regarding the matter, the company said it could be out of cash as soon as mid-July.

Most are expecting Yellow to announce it will file for bankruptcy Monday.

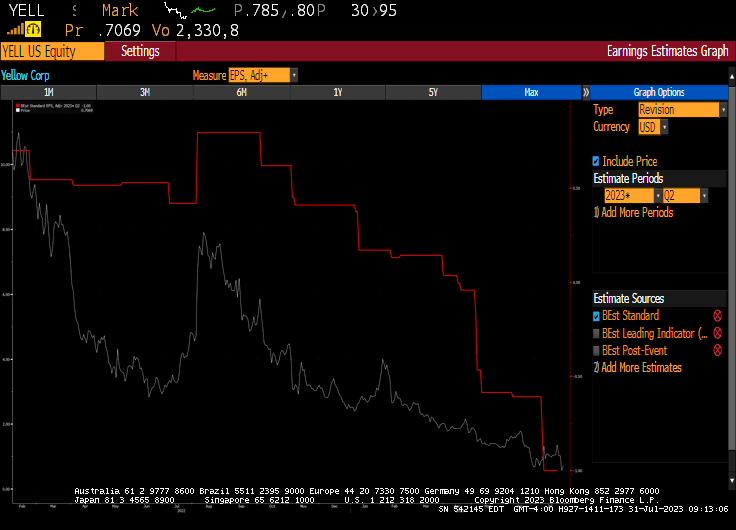
Not surprising given the disastrous earning per share. The culprits? High energy costs and a hostile Teamsters Union (labor costs and practices).

A closer look at Yellow’s earning per share deterioration as Biden’s energy folicies has taken hold and crushed the life out at Yellow Trucking.

Biden! They call him The Sleeze!

Bidenomics? C&I Lending Growth Crashes Along With Bank Credit Growth (WTI Crude Oil UP 1% This Morning) 30-year Mortgage Rates At 7.27%

Bidenomics, aka the Federal government takeover of the US economy with Soviet-style economic central planning, is highly dependent on loose Federal Reserve monetary policy (Janet Yellen and Powell’s wild overreaction to the massively inappropriate Covid shutdowns),

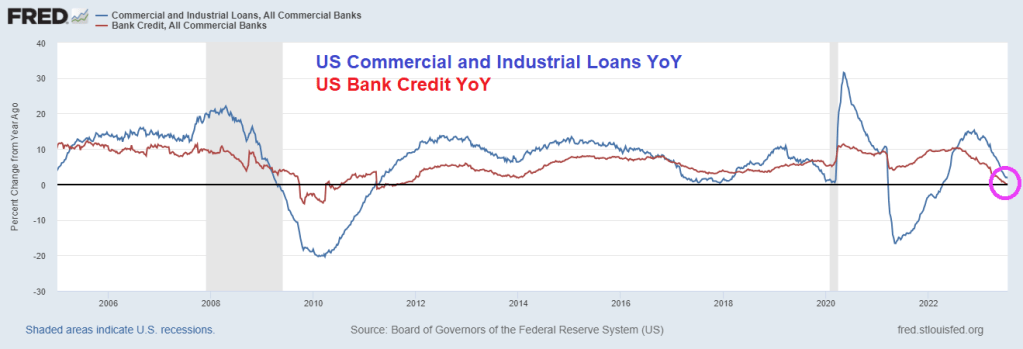
So, how is Bidenomics working out? On the bank lending front, commercial and industrial (C&I) lending growth is crashing along with bank credit growth YoY.

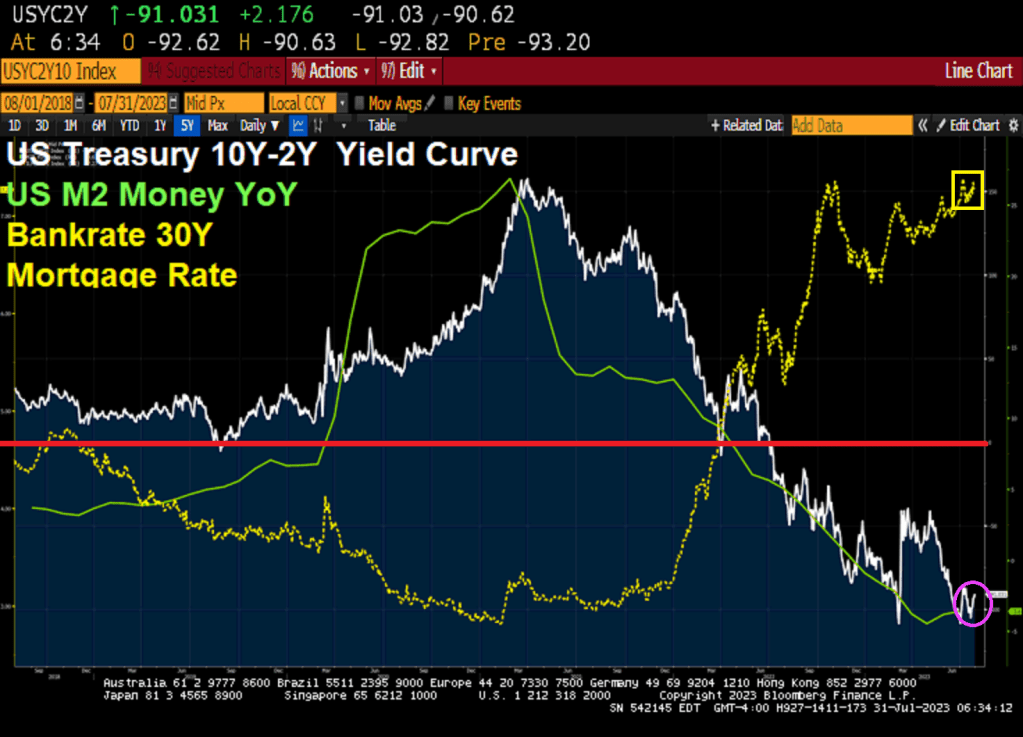
The US Treasury 10Y-2Y yield curve remains deeply inverted at -91.031 basis points and M2 Money growth has crashed. The 30 year mortgage rate is hovering around 7.27%.

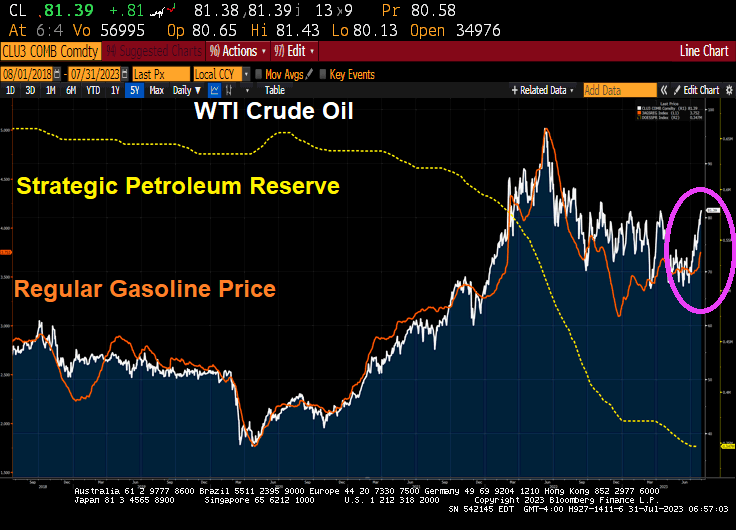
And WTI Crude oil futures are up 1% this morning.

The body of Bidenomics.

Here is a pic of Biden sniffing Idaho.

Republicans Little Red Book! New York, California Tax Revenue Tumbles Amid Exodus To Blue States (Red States FLA, TX Show Incredible Gains In Tax Revenue)

The Republicans’ little red book is showing people escaping big crime and tax states like New York and California for lower tax, lower crime states like Florida and Texas. But to Democrats who are really bad at math, 7+7 = 0?

Most people are already familiar with the mass migration from the Democratic strongholds of California and New York, known for high crime and tax rates. We have delved into this in our article, “Americans Continue To Flee High-Tax New York And California,” highlighting Texas and Florida as preferred destinations.

California and New York have sustained population declines during Covid and after, that have long-term implications for local economies. The exodus means workers with six-figure salaries in technology, finance, real estate, and entertainment are going elsewhere, which will reduce tax revenue for the state. 

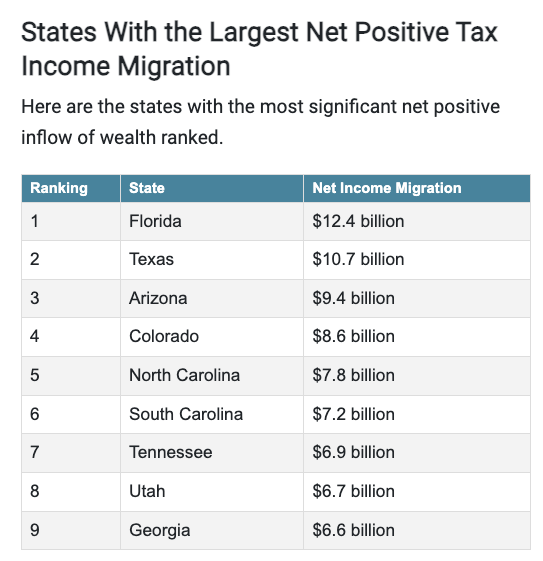
MyEListing.com, an online real estate portal, used IRS migration data to reveal California and New York lost $343 million and $299 million in 2021, respectively, due to the surge in migration outflows. 

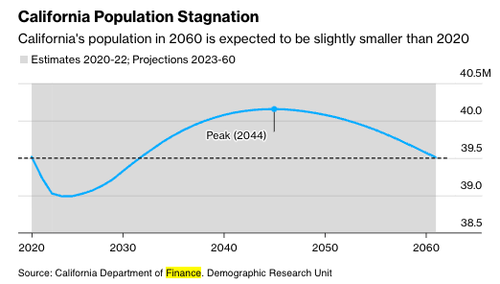
The beneficiaries of the outflow are Florida and Texas, which took in $12.4 billion and $10.7 billion, respectively. 

“Despite its numerous attractions, from the booming tech industry and world-class universities to beautiful landscapes and cultural richness, California’s high personal income tax rates seem discouraging for many high-wealth individuals. This, coupled with the state’s high cost of living, will likely fuel a wealth migration out of California,” MyEListing wrote in the report. 

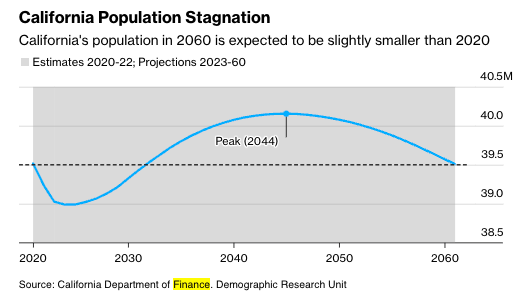
The exodus from California is so severe that state demographers forecasted the total population will be the same today as in 2060. 

If left unchecked, the largest outflows of residents from specific metro areas could experience a fiscal crisis. Such a development would be tragic for Democrat-controlled cities already plunging into crisis as progressive politicians fail to enforce law and order. 

Hey Joe (Biden)! Open up the US to energy independence!!!

Why US Inflation Will Start Rising Again (WTI Crude Futures UP Above $80 Again As Gasoline Futures UP 91.5% Under Bidenomics)

Joe Biden said that Republicans will impeach him in the House of Representatives since inflation is coming down. Huh? No Joe, it is because your are the most corrupt President in history, a compulsive liar and your economic policies are pure World Economic Forum mandates (open borders, Central Bank Digital currency, green energy, etc). Biden started off his Presidency by declaring war on fossil fuels that helped drive prices through the roof. And the middle class are paying the price.

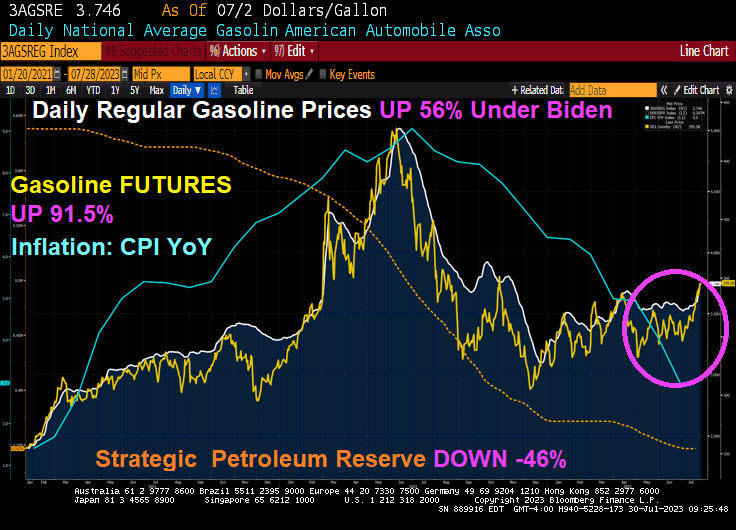
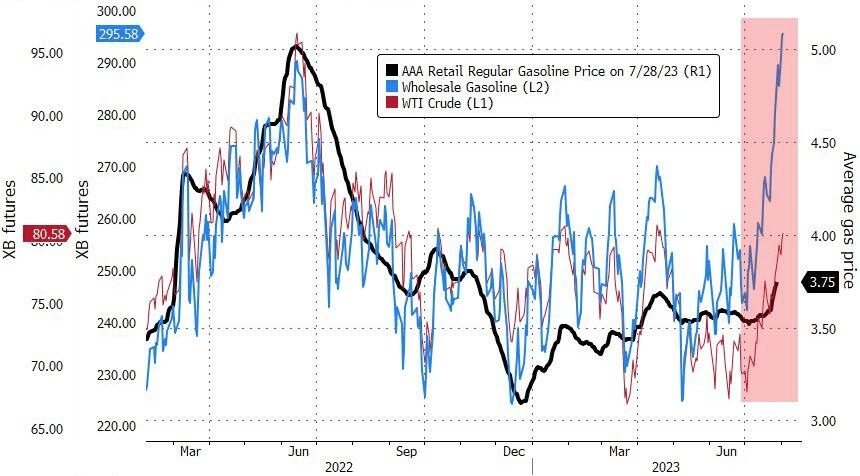
But as inflation cools (blue line) thanks in part to Biden draining the Strategic Petroleum Reserve (orange line), Biden can gloat. But remember, gasoline prices remain 56% higher under Biden’s Reign of Error. Even worse, gasoline FUTURES are up 91.5% under Biden. Yikes!

But look at how gasoline prices and gasoline futures have risen in July (pink circle). The last inflation report showed that inflation has declined to 3% (still higher than The Fed’s 2% target), gasoline prices are up almost 5% since July 19, 2023.

Gasoline, meanwhile, started the year at less than $2.50 per gallon. This week, gasoline topped $2.90 per gallon and may yet reach $3.

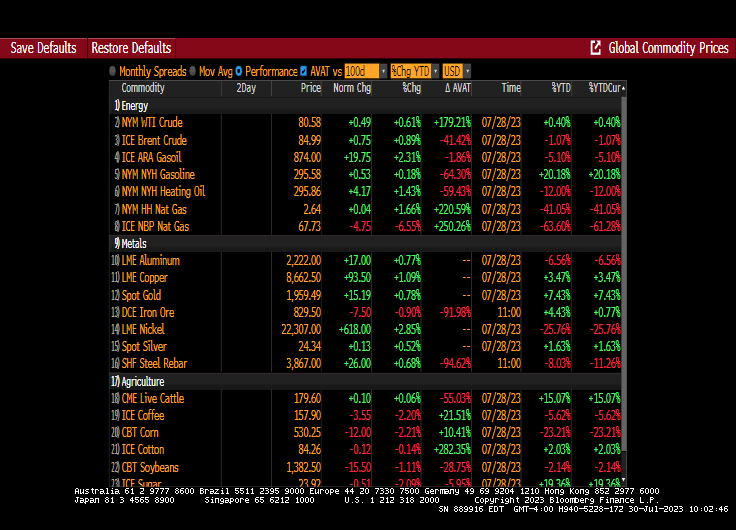
WTI Crude Oil futures have broken through the $80 barrier … again. Heating oil futures are up 1.43% today with WTI Crude futures up 0.61%.

So as energy prices keep rising (and Biden’s EPA keeps issuing green energy edicts and fails to recognize that our power grid can’t support all the electric cars and trucks envisioned by the Obama/Biden green dreamers). As such, energy prices will keep rising and with it … inflation.

CRE Fire! Office Valuations Plummet As Fed Raises Rates To Fight Inflation (US Gross Domestic Income YoY Fell To -0.8% In Q1, NOT A Good Sign!)

Commercial real estate (CRE), particularly office space, reminds me of the Arthur Brown tune “Fire!” except that Jerome Powell of The Federal Reserve is the God of Hellfire! While fighting inflation caused by … The Federal Reserve and insane Federal spending (aka, Bidenomics). Call this the Over, Under, Sideways Down economy. The top 1% are doing quite well, while the lower 50% of net worth households are struggling.

The Q1 2023 NCREIF Office property (value) index shows declining office value since Q2 2022 as The Fed began raising its target rate to combat inflation.

From Trepp, we have this shocking table showing the decline the average total value loss over the span of around a decade. The oldest buildings experienced the largest reduction in value of 60%, and the newest experienced the least (but quite substantial) reduction of 52%. Although the newest buildings performed the best relatively, their 52% value reduction is easily the most concerning, and displays truly how much distress is present in the office sector. This group has the highest percentage of Class A buildings, but its reduction value over the past decade is still approximately on par with buildings constructed over half a century prior. With north of $150 billion in securitized maturities beyond 2023, these trends set a gloomy tone for their future and the performance of office properties as a whole.

Then we have this alarming headline from Trepp: “Commercial Mortgage Sector Faces Another Wall of Maturities as $2.75 Trillion Rolls by 2027.” An estimated $528.7 billion of commercial mortgages mature this year, according to Trepp data, which projects that next year, maturities will increase to $532.8 billion. The projections are based on data for the first quarter compiled using the Federal Reserve’s flow of funds and made various assumptions regarding loan terms for each of the major lender categories. The data would indicate that the market is facing a wall, if not a mountain of maturities that would make the 2015-2017 wall of maturities look almost inconsequential. During that period, roughly $1.1 trillion of loans were scheduled to come due. But attention was focused on the CMBS market, as more than $335 billion of loans were set to mature during the period.

Well, REAL gross domestic income fell -0.8% YoY in Q1 2023 as M2 Money growth crashes. Not a good sign for the US economy or commercial real estate.

Here is the Trepp Report on declining office values.

Of course, office properties are suffering from almost out-of-control crime in major American cities and the desire of workers to work from home rather than commute to work in cubicles.

But never fear! We have massively corrupt and compulsive liar Joe Biden as President!! He is the President of The 1%! Not the other 99%.

Call him Deep State Joe! The bully from Delaware.