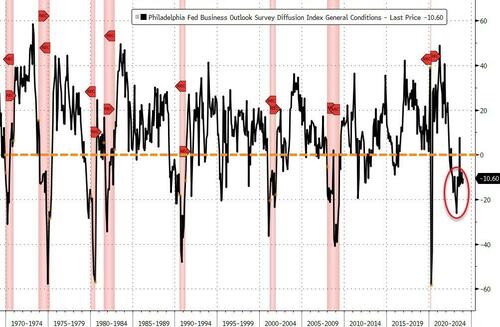
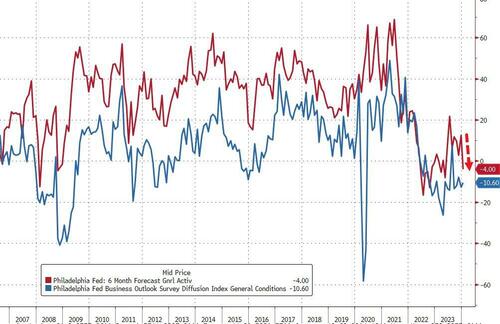
More worrying is the fact that hope appears to be dwindling fast as the six-month-forecast for the survey plunged back into contraction (from +12.6 to -4.00)…
Source: Bloomberg
Philly Fed’s demise is consistent with the collapse of hope as ‘soft’ survey data has slumped in the last month, back to its weakest since July (as ‘hard’ data improves relative to expectations)…
Source: Bloomberg
On the bright side for the doves, the dis-inflationary trend remains in tact as priced paid and prices received both plunged in January. However, we highlight the fact that Philly businesses expect price pressure to return in the next six months…
Source: Bloomberg
Overall, the ‘bad news’ in this report should buoy stocks and bonds (lower inflation and lower growth enables sooner and faster cuts)… But will it.
President Biden still shuffles around mumbling about Maga Republicans and defending democracy (while gettig his DOJ and affiliates to prosecute his leading Presidential opponent) even though …. consumers continue to struggle. While Biden is in wonderland, American consumers are in hell.
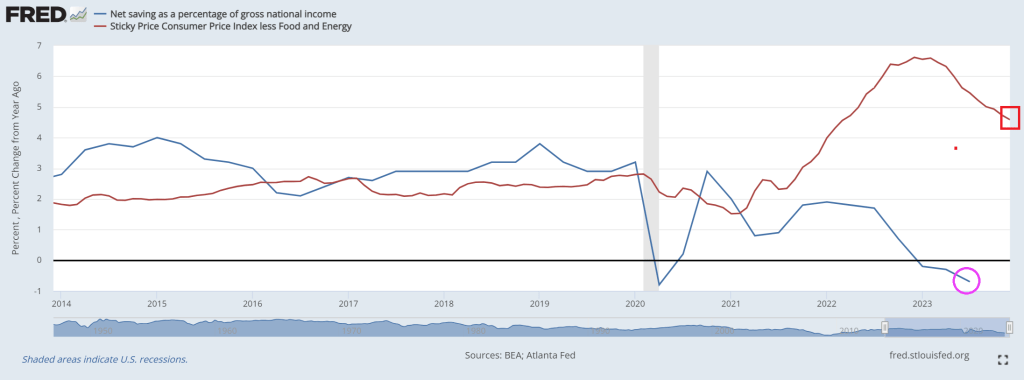
Savings as a percentage of GDP is actually NEGATIVE as sticky price inflation remains above 4%.
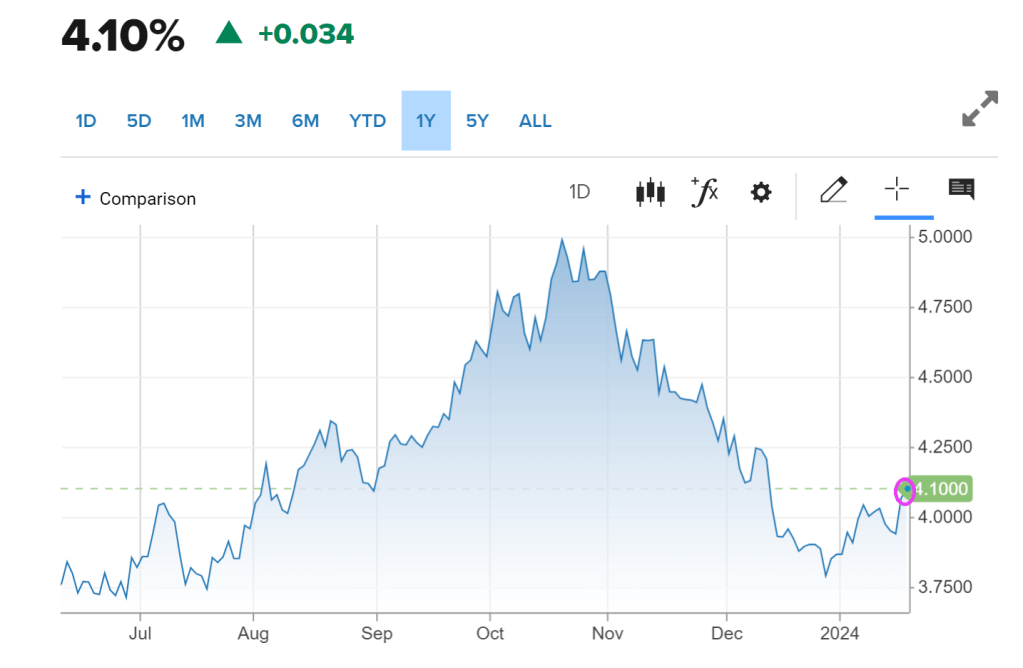
Any good news? At least the US Treasury yield curve (10Y-5Y) is normalizing.
How true!
Speaking of Biden, is this photo real? With AI, I wonder.
The yield on the 10-year Treasury note was recently up 4 basis points at 4.108% after briefly getting to 4.117%, the highest since Dec. 13. The 2-year Treasury yield rose by around 11 basis points to trade at 4.335%.
December’s retail sales data indicated strong consumer demand at the holidays. Retail sales increased 0.6% for the month, above economists’ estimates of 0.4%, as compiled by Dow Jones. Excluding autos, sales rose 0.4%, which also topped a 0.2% estimate.
On Tuesday, yields jumped after comments from Federal Reserve Governor Christopher Waller, who suggested that while the central bank will likely cut rates this year, it may take its time.
At the World Economic Forum in Davos, more European Central Bank members indicated that markets were getting ahead of themselves on rate cut projections.
The president of the Dutch central bank, Klaas Knot, told CNBC Wednesday that the euro zone’s central bank looked at overall financial conditions, and that “the more easing the market has already done for us, the less likely we will cut rates.” Knot was referring to the fact that higher stock and bond prices in the fourth quarter of last year acted as the equivalent of easier interest rate policy, while lower prices act as the equivalent of tighter policy.
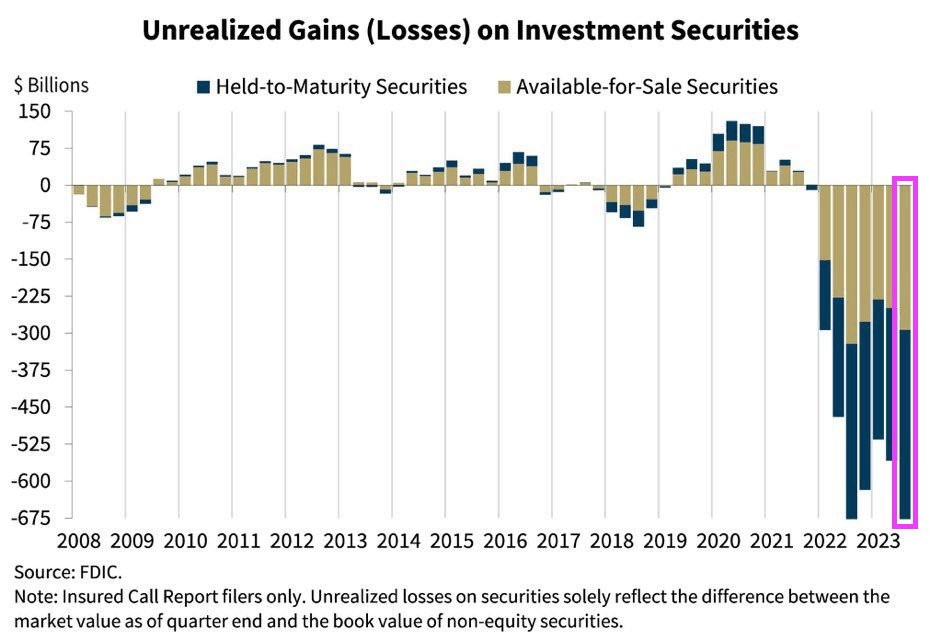
Rising interest rates are going to bite a big chunk out of The Fed’s massive ass (I mean balance sheet). Of course, The Fed sends the bill to Treasury. Gee, no wonder Biden/Yellen want so much money!
There is something wrong with letting aging politicians like Biden (81), Grassley (90), Pelosi (83), etc. borrow vast sums of money to spend when they will likely not be around for another 10 years.
You may remember that the Biden administration expected a significant deficit reduction from its tax increases and the expected benefits of its Inflation Reduction Act.
What Americans got was a massive deficit and persistent inflation.
According to Moody’s chief economist, Mark Zandi, the entire disinflation process seen in the past years comes from exogenous factors such as “fading fallout from the global pandemic on global supply chains and labor markets, and the Russian War in Ukraine and the impact on oil, food, and other commodity prices.” The complete disinflation trend follows the slump in money supply (M2), but the Consumer Price Index (CPI) should have fallen faster if deficit spending, which means more consumption of newly created currency, would have been under control. December was disappointing and higher than it should have been.
The United States annual CPI (+3.4%) came above estimates, proving that the recent bounce in money supply and rising deficit spending continue to erode the purchasing power of the currency and that the base effect generated too much optimism in the past two prints. Most prices rose in December, and only four items fell. In fact, despite a large decline in energy prices, annual services (+5.3%), shelter (+6.2%), and transportation services (+9.7%) continue to show the extent of the inflation problem.
The massive deficit means more taxes, more inflation, and lower growth in the future.
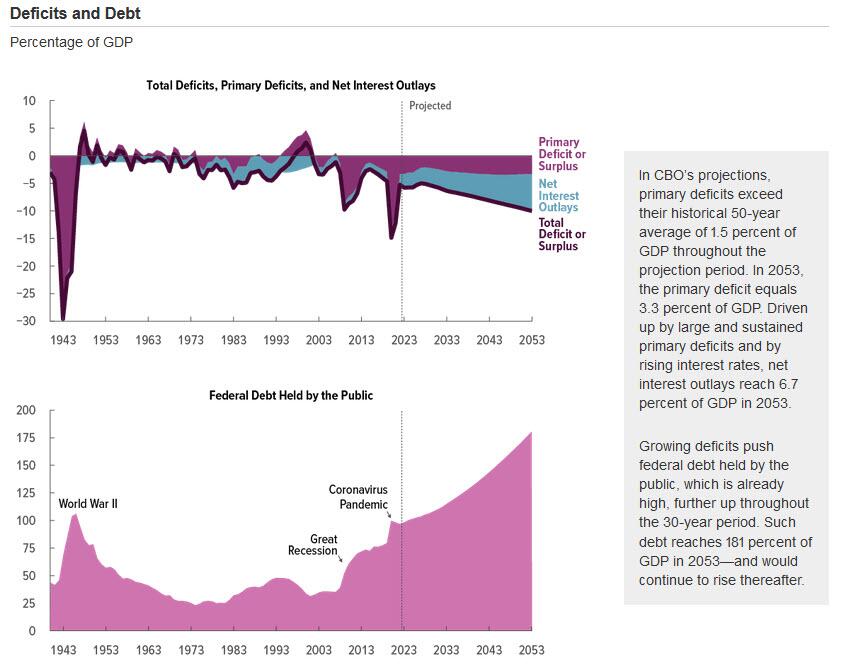
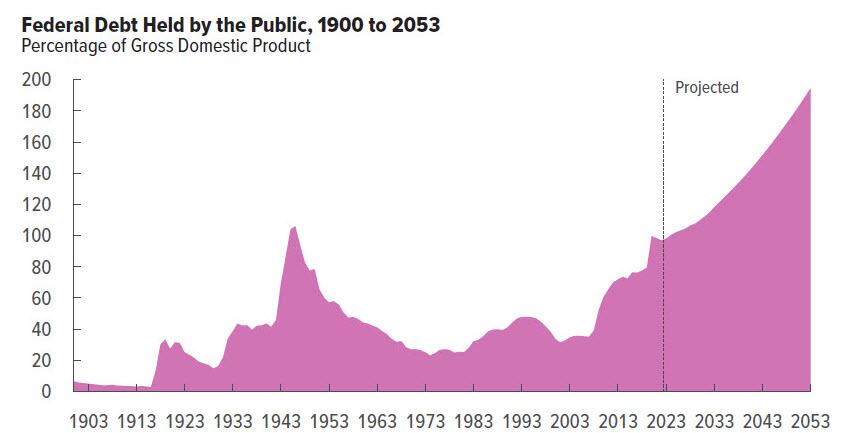
The Congressional Budget Office (CBO) expects an unsustainable path that still leaves a 5.0% deficit by 2027, growing every year to reach a massive 10.0% of GDP in 2053 due to a much faster growth in spending than in revenues. The enormous increase in debt will also lead to extremely poor growth, with real GDP rising much slower throughout the 2023–2053 period than it has, on average, “over the past 30 years.”
Deficits are not a tool for growth; they are tools for stagnation.
Deficits mean that the currency’s purchasing power will continue to vanish with money printing and that the real disposable income of Americans will be demolished with a combination of higher taxes and a weaker real value of their wages and deposit savings.
We must remember that, in Biden’s administration’s own estimates, the accumulated deficit will reach $14 trillion in the period to 2032.
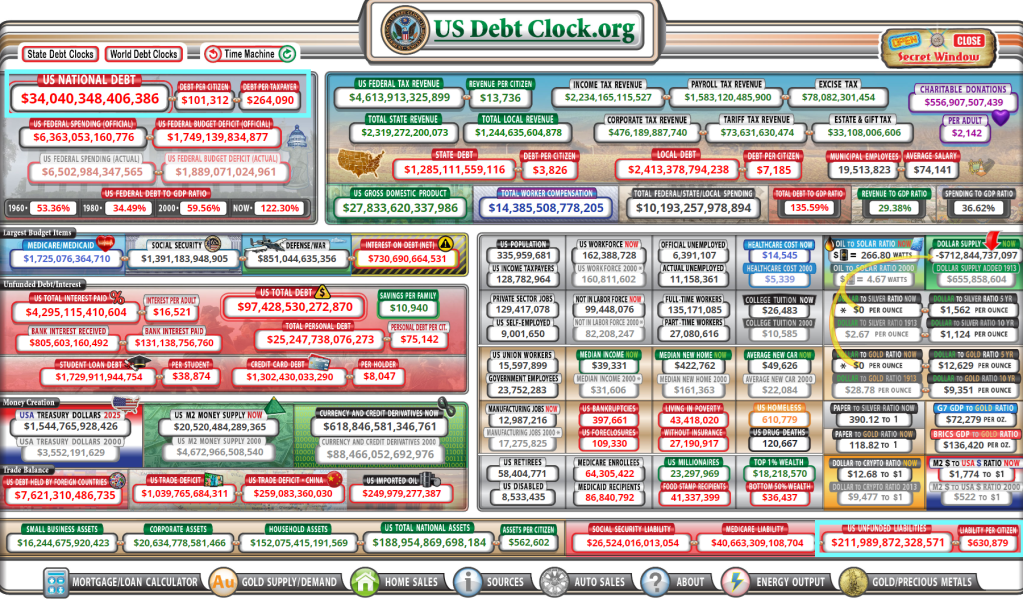
Yes, the US has $34 trillion in national debt and $212 trillion in promises made to keep the 99% quiet while the 1% gut the economy for their own wealth. Think Biden, Clintons, and various Congress Critters who suddenly become millionaires.
The Debt Star was born under Obama and weaponized under Biden/Pelosi/Schumer.
Yes, national debt rose under Trump too. Bear in mind that spending originates in The House and Trump was saddled with warhawks like RINO Paul Ryan and insider trading expert and warhawk Nancy Pelosi.
Housing is simply unaffordable under Bidenomics, a strange brew of big corporate green subsidies, political handouts (any wonder why Biden is forgiving student loans in an election year?) and bad Fed policy errors.
But young Americans don’t always have a sugar daddy like Hunter Biden has who are willing to pay for rent for political parasites like those in Washington DC.
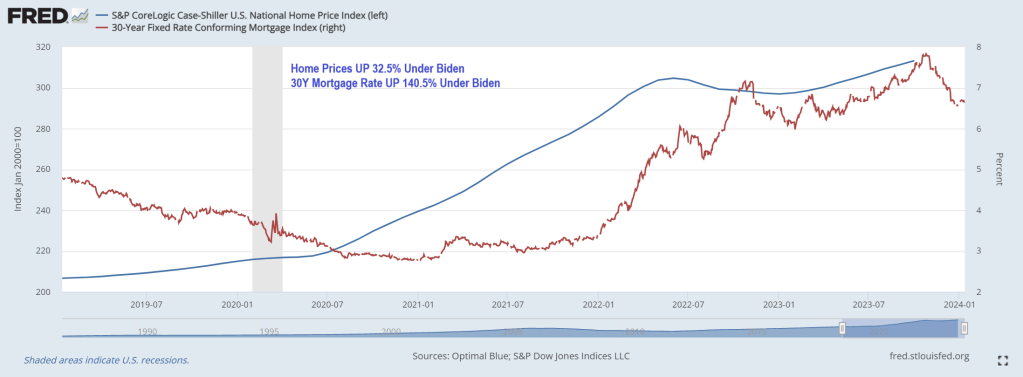
Young adults used to dream of moving out of their parents’ homes and into their own apartments, but living alone has become a luxury not everyone can afford. Not surprising, since home prices under Biden have risen 32.5% while 30-year mortgage rates are up a staggering 140.5% under Clueless Joe.
But in growth terms (year-over-year), White House Propagandists Karine Jean Pierre and John Kirby will no doubt focus on the cooling of housing prices and mortgage rates … although both are reaccelerating.
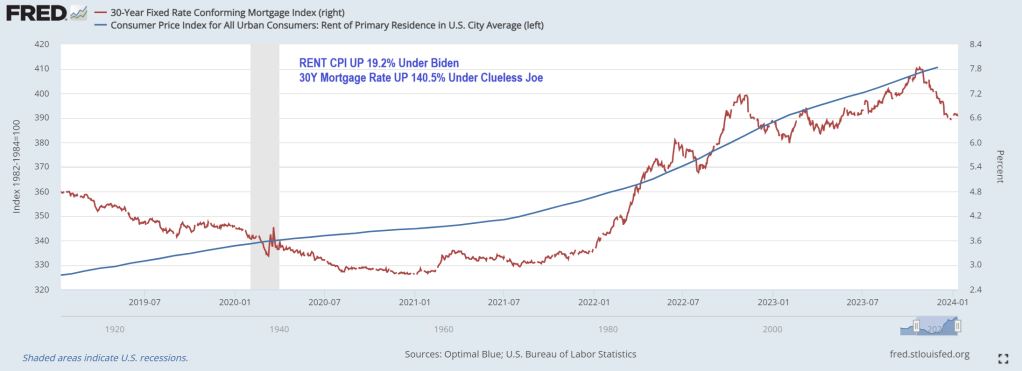
Rent CPI is up 19.2% under Clueless Joe.
How does this impact younger Americans? According to a recent study by Intuit Credit Karma, 31% of Gen Zers are living with their parents because they can’t afford to rent or buy their own place. Overall, 11% of American adults still live at home with their parents.
“The current housing market has many Americans making adjustments to their living situations, including relocating to less-expensive cities and even moving back in with their families,” said Courtney Alev, a consumer financial advocate at Intuit Credit Karma.
Even young adults who live alone are reconsidering their living arrangements because costs are too high.
About a quarter (27%) of Gen Zers reported that they could no longer afford rent and 25% said they’ll have to move back in with family to make ends meet.
Millennials are in the same boat: 30% say rent is unaffordable, and 25% are thinking about moving back in with their parents.
The research is consistent with a 2021 study conducted by the U.S. Census Bureau, which showed that one in three adults ages 18 to 34 live with their parents.
In a 2022 study, Pew Research also found that the percentage of Americans living with their parents has increased steadily since 2000. Pew calls these living arrangements “multigenerational households,” and said young adults ages 25 to 29 are most likely to cohabit with their parents.
Different studies, but all tell the same story: Finances are the top reason young adults are still living with family.
Housing and rental costs rise
It’s hardly surprising that young adults are struggling to make ends meet. Housing costs and living expenses have skyrocketed since the pandemic, and younger generations have faced the most financial hardship.
As Creditnews Research reports, Millennials and Gen Zers have been locked out of homeownership due to rising home prices, elevated interest rates, and stagnant real wages (adjusted for inflation).
For example, in 2023, Millennials accounted for only 28% of homebuyers despite being in their prime home-buying age. Gen Zers barely made a dent in the housing market, accounting for a paltry 4% of all buyers.
According to Fed data, average home prices were $431,000 as of the third quarter of 2023.
The rental market isn’t much better. Although rent costs have declined for three straight months, landlords are still asking for $1,964 per month on average, per Redfin data. Average rents were below $1,650 at the start of Covid.
But the problem of surging rents goes back much longer than that. According to a report from Moody’s Analytics, rent prices grew 135% between 1999 and 2022, while average incomes for all age groups were up 77% over the same period.
In terms of earning potential, younger generations are at the lower end of the totem pole, so they’re more likely to be affected by rising rent prices.
Where’s the “strong economy” everyone always talks about?
While the U.S. economy has steered clear of recession and unemployment remains near historic lows, Americans are still struggling to afford basic expenses. This is especially true for younger generations.
A 2023 study conducted by Deloitte found that more than half of Millennials and Gen Zers were living paycheck to paycheck. Perhaps shockingly, 37% of Millennials and 46% of Gen Z reported taking another part-time or full-time job just to afford their bills.
Working longer hours and barely scraping by is one of the main reasons why younger adults feel they’re worse off financially than their parents were at their age.
An August 2023 study conducted by The Harris Poll found that 74% of Millennials and 65% of Gen Zers believe they are starting further behind financially than previous generations.
“They’re telling us they can’t buy into that American dream the way that their parents and grandparents thought about it—because it’s not attainable,” said The Harris Poll CEO John Gerzema.
Remember, Clueless Joe Biden is in charge!(or Obama, take your pick).
Did you see the recent government propaganda from the U.S. Bureau of Labor Statistics?
Not the latest faulty claim that consumer prices increased at an annual rate of just 3.4 percent in December. But rather the claim that 216,000 jobs were added in December.
Upon release, and right on cue, Treasury Secretary Janet Yellen declared that the U.S. economy had achieved a soft landing. She also said that her “hope is that it will continue.”
What Yellen neglected to mention was that October employment was revised down by 45,000 jobs and November was revised down by 26,000 jobs. That’s 71,000 jobs the government recently reported which didn’t exist.
How many of the 216,000 jobs reported for December will wind up being pure fantasy?
Yellen also didn’t mention that 52,000 of the reported jobs are in government, 59,000 are in health care and social assistance, and 22,000 are in food services.
These aren’t the kind of jobs that create and spread new wealth and abundance to the economy.
In addition, there are 4.2 million workers that are employed part time for economic reasons.
This represents individuals who prefer full-time employment but are working part-time because their hours have been cut or they cannot find full-time work.
There are also 8.5 million multiple job holders. These are people who work more than one job because a single job doesn’t pay the bills.
Yellen, obviously, isn’t interested in these pesky details. What she is interested in is that when the data is massaged and contrived, and then summed up, the government can report an unemployment rate of 3.7 percent.
Hence, she can point to this number and crow about how through her expert navigation skills she has piloted a soft landing.
What’s really going on?
Here we’ll offer an anecdote followed by some thoughts…
Burning Ambition
Your editor’s son, a junior in high school, works at a pizza joint in the mall. There he makes and sells pizzas to hungry customers for $12.50 per hour – pre-tax. The minimum wage in Tennessee is $7.25 per hour.
Of note, he’s the only highschooler working there. His coworkers are all well into their dirty-30s. Some have kids. Some have multiple jobs. We haven’t asked any of them. But we suppose none would claim to be living the dream.
Reviews on Google are unflattering. They warn of pizzas and customer service that are of dubious quality. They tell a story of a shortage of good help. Here are several recent examples:
“Walked up to ask when they open. Some jerk behind the counter with a ponytail and big ear piercings goes, ‘Lights out not open!’ With a ton of attitude. We said, ‘You don’t have to be rude, we just wanted to know what time you opened.’ And his response was, ‘Welcome to the mall.’ What an absolute jerk. Don’t go here!”
“Ever had stale crackers with cheap ketchup and paper-thin burnt pepperoni on top of a thin layer of what was once cheap cheese before? If you’re on a quest to find the worst pizza in Knoxville, then come to the west town mall.”
“Got a slice of cheese pizza, sat down and the bottom of it was burnt. I tried to go get a different slice and he told me that all the other pizzas would be like that too and that it was normal for them to serve burnt pizza. He was a bit sarcastic about the situation.”
There are over one hundred reviews posted which share various tales of customer dissatisfaction. You’ve likely had similar experiences at your own local establishments. Burning pizzas and serving them with heapings of attitude is normal these days. Though having a burning ambition is rare.
What’s the point…
Cherry Picking Data Durations
These low-level service jobs, filled by people with low-level skill sets, are the jobs that Yellen is so excited about.
Absolutely, these jobs are important.
If they didn’t exist there would be no option to get cheap mall pizza while simultaneously getting insulted.
Life would be less abundant.
Nonetheless, these are not the type of jobs that drive the economy forward.
They certainly don’t offer opportunities for American workers to get ahead.
They don’t provide the cutting-edge skills, or the higher wages needed to propel the American economy above its foreign competitors.
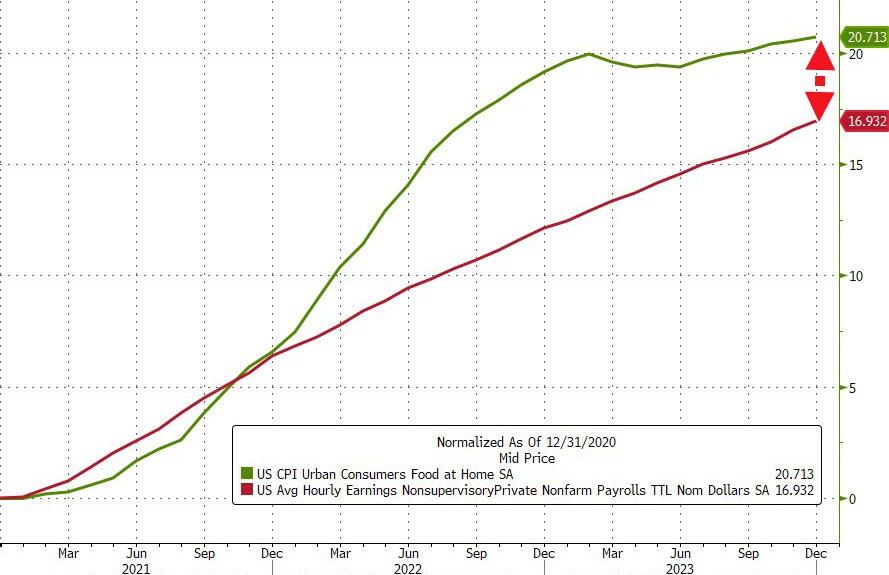
One of Yellen’s key talking points is that wage growth is outpacing inflation. She can even point to the December jobs report for justification.
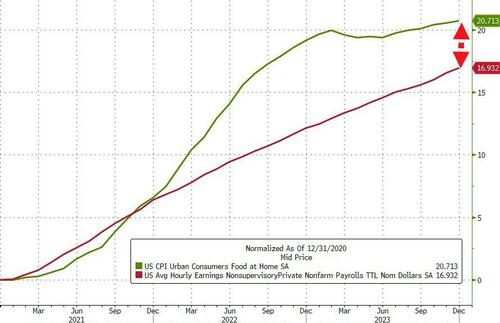
Based on the government propaganda, hourly earnings rose 4.1 percent in the year through December while consumer price inflation, as measured by the consumer price index (CPI), came in at 3.4 percent for the year. Here’s Yellen:
“Wage increases are running over price increases now. American workers are getting ahead and the progress for the middle-income families is very noticeable.”
Cherry picking data durations to support a false narrative is a longstanding tactic of big government statists. The reality is that on Yellen’s watch American workers have steadily fallen behind.
When you zoom out to show from December 2020 to the present, average hourly wages and CPI tell a much different story.
As David Stockman, the former Director of the Office of Management and Budget recently detailed, “the cost of living has risen 25 percent more than the average hourly wage.”
In other words, American workers have taken a significant pay cut over the last three years.
Yellen’s Bald-Faced Lies
If you didn’t know, Yellen has held various positions with the Federal Reserve and later the Treasury over the last 30 years. She’s participated in and advanced an era of unprecedented economic activism.
Moreover, Yellen and her colleagues at the Fed have their fingerprints all over the wage debasement that has taken place over the last several years.
As Stockman elaborated:
“A few years ago when the shortest inflation ruler available—the core PCE deflator—was running significantly below the Fed’s sacred 2.00% target, the Eccles Building was all for a catch-up of the level. The Fed even announced a policy of targeting inflation to average 2.0% over time, which ukase did not include, conveniently, the exact span of time to be measured.
“‘The Federal Reserve now intends to implement a strategy called flexible average inflation targeting (FAIT). Under this new strategy, the Federal Reserve will seek inflation that averages 2% over a time frame that is not formally defined. This means that after long periods of low inflation, the Federal Reserve will not enact tighter monetary policy to prevent rates higher than 2%. One benefit of this flexible strategy to managing the mandate of price stability is that it will impose fewer restrictions on the mandate of full employment.’
“Wouldn’t you know it? The Fed switched to ‘averaging’ in August 2020—just months before inflation went soaring to levels not seen since the 1970s.”
The gap between reality – consumer price increases vs wage increases – and what government bureaucrats want you to believe to be true takes frequent bald-faced lies to fill.
Yellen, for her part, excels at selectively using contrived data to make assertions that are visibly false.
We don’t know if she believes the propaganda she spews or if her intent is to deceive people. Regardless, the whole act is exceedingly wearisome.
Well, we have news for you: if 2023 was bad, 2024 – an election year of course – is shaping up to be far worse.
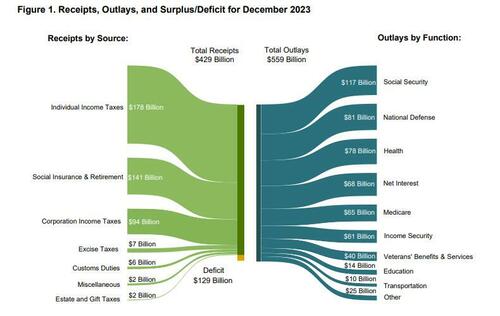
Moments ago the US Treasury reported the budget deficit picture for December and it will come as no surprise to anyone that the US has continued to spend like a drunken sailor, or rather, even more. As shown in the chart below, in the month of December, the US collected $429 billion through various taxes, while total outlays hit $559 billion…
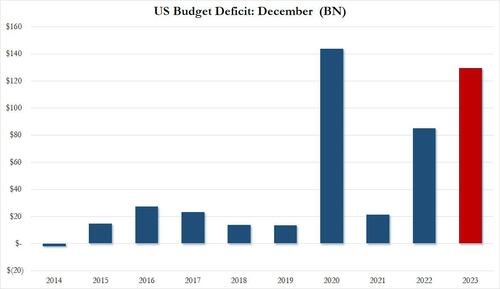
… resulting in a December deficit of $129.4 billion.This may not sound like a lot, but December is actually one of those months when the US deficit is relatively tame, or used to be.
As shown in the next chart, traditionally the December deficit was barely in the $10-20BN range… until 2020 when it exploded to an all time high of $140BN. And while it dropped sharply in 2021, it rebounded dramatically in 2022, and rose to just shy of the December crisis high last month!
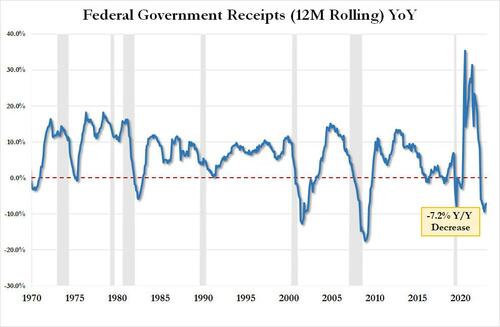
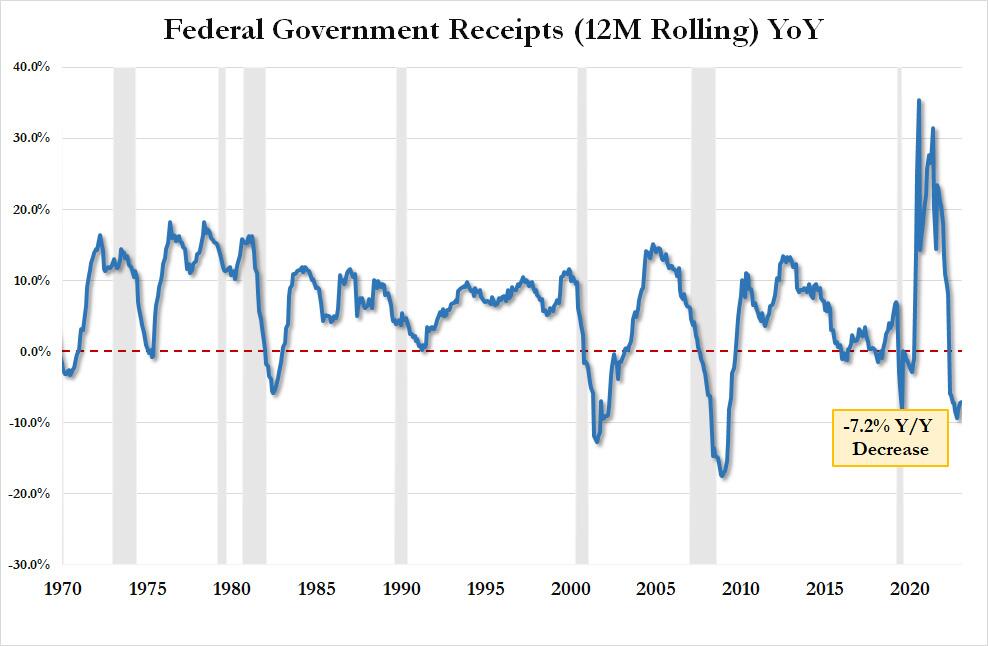
Here is some more context: tax receipts of $429.3BN in December were down 5.6% from the $454.9BN in December 2022 and down a whopping 11.8% from December 2021. On an LTM basis, US total tax receipts were $4.521TN, or down 7.2% YoY. This is now the 9th consecutive YoY decline in LTM tax receipts, something that historically has only taken place when the US was in a recession. As an aside, the “smart economists” were certain that the collapse in tax receipts would reverse after November when the postponed California taxes would be collected. Well, November has come and gone and the big picture is just as ugly.
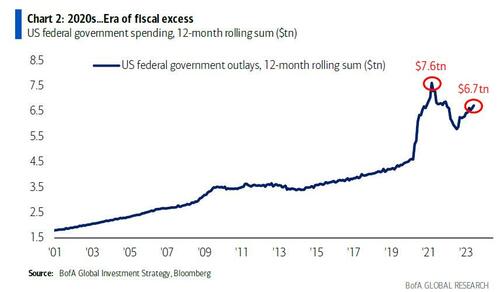
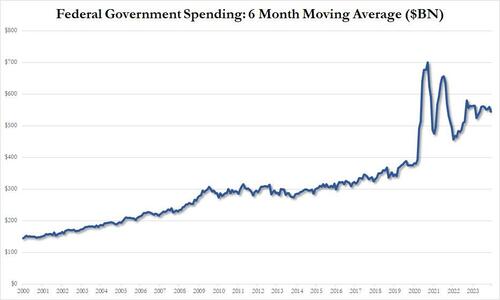
Looking at outlays, unlike tax receipts, there is danger of a decline… ever; and indeed in December the US spent a total of $559 billion, up 3.5% from the $540BN spent a year ago, and up even more from the $508BN in 2021. On a 6 month moving average basis, we are rapidly approaching the exponential phase even when accounting for the spending burst in 2020 and 2021.
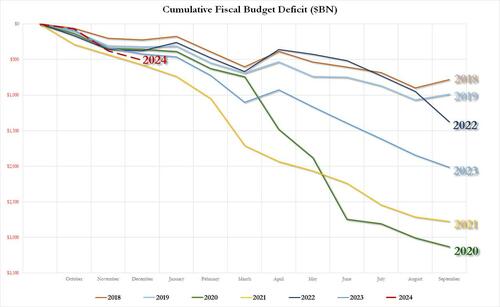
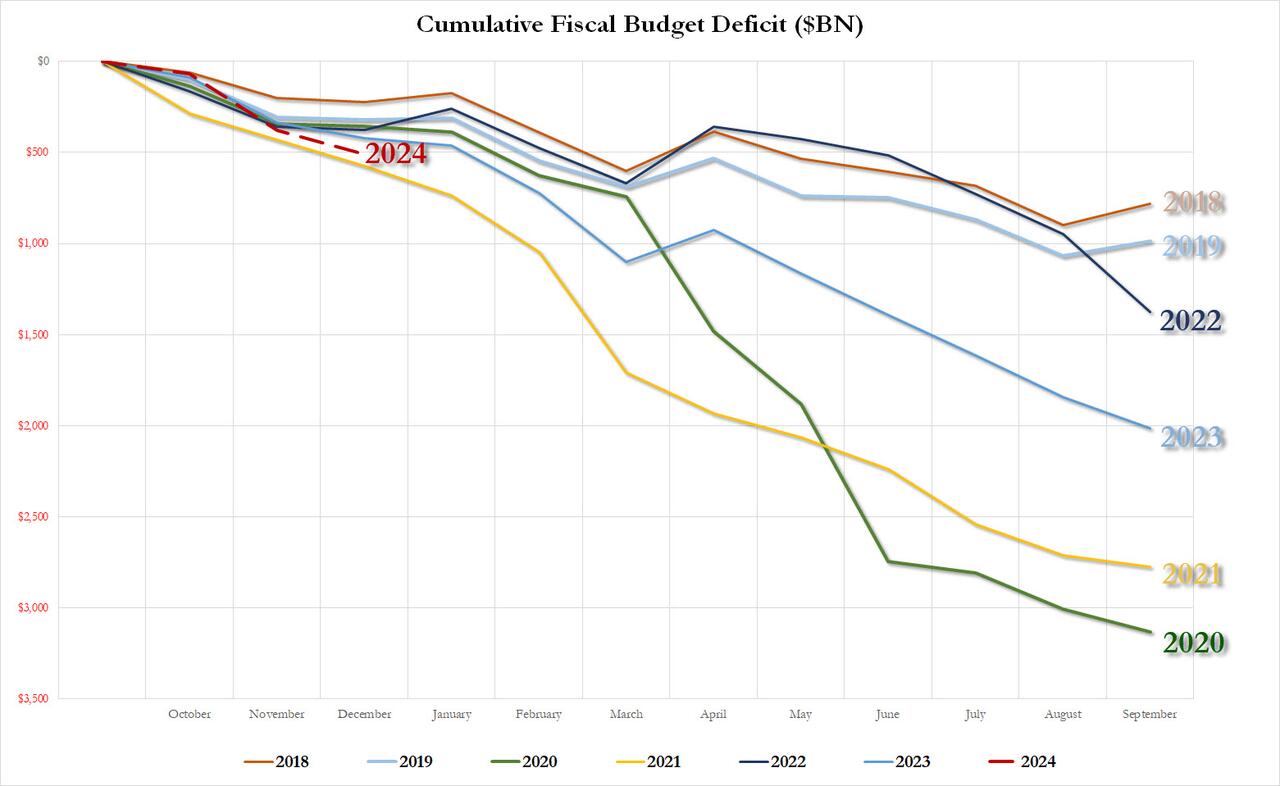
Putting it all together, we get the scariest chart of all: the YTD budget deficit three months into fiscal 2024 is already $509 billion, which would be the biggest deficit in US history after one quarter with the exception of the covid outlier year of 2021 when the US injected multiple trillions in stimmies.
As for the final, and most shocking, data point, the December budget deficit of $129.4 billion was more than $40BN higher than the $87.5BN median estimate, and was more than 50% higher compared to the $85BN December deficit in fiscal 2022.
Needless to say, this is completely unsustainable and assures fiscal collapse for the US, not if, but when. Then again, we already knew this thanks to the CBO which was kind enough to chart the endgame:
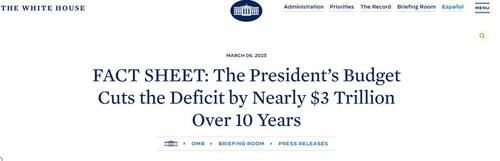
What is funniest about all this is that the US is on an accelerating path to ruin less than one year after the imposter in the White House published this laughable propaganda.
We can’t wait to see what really happens to the budget deficit over the next 10 years. Spoiler alert: there won’t be a happy ending.
Some content on this page was disabled on May 23, 2024 as a result of a DMCA takedown notice from Adtech lt, UAB. You can learn more about the DMCA here:
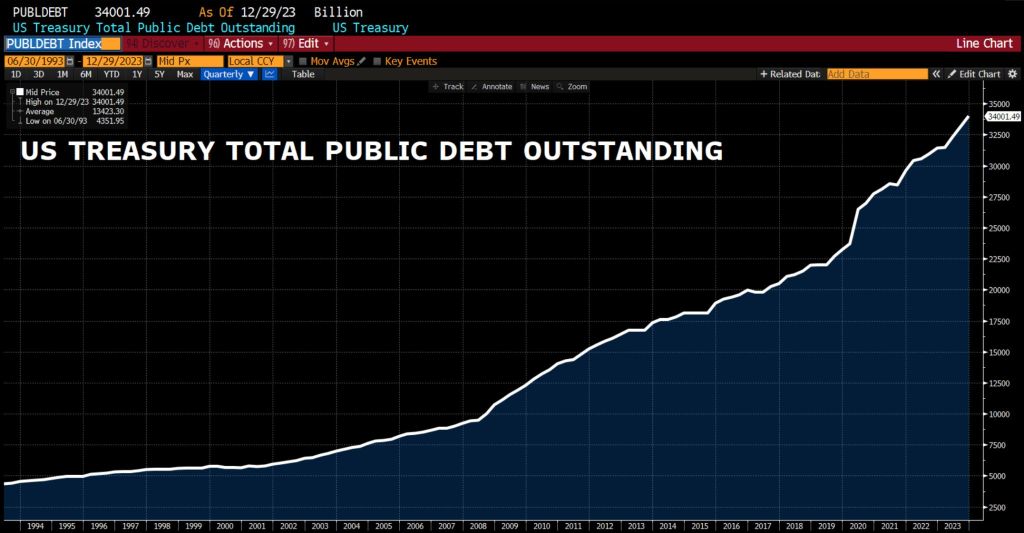
In another episode of “Government Gone Wild” we see that total Federal debt just broke through the $34 trillion mark.
Some context: US debt increased by…
$1 trillion in the past 3 months
$2 trillion in the past 6 months
$4 trillion in the past 2 years
$11 trillion in the past 4 years
The Congressional Budget Office (CBO) is flashing the alarm.
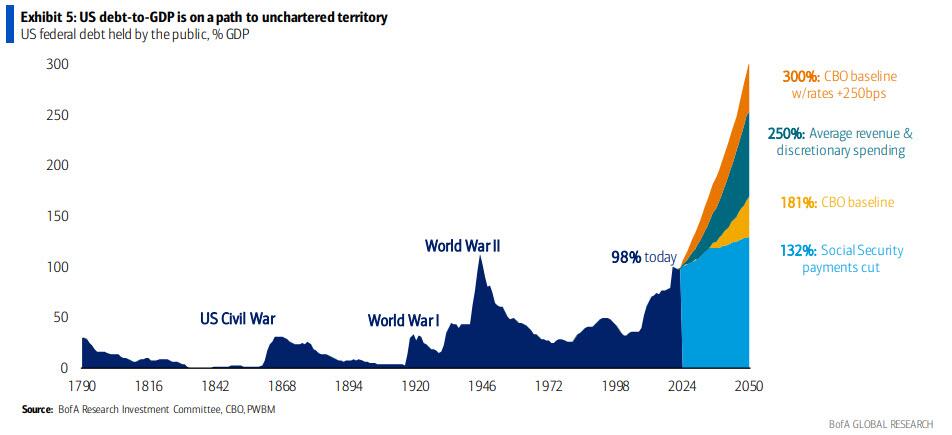
Reckless spending in Washington DC by the administration and Congress is projected to drive US Debt to GDP to rise like the nuclear reactor in the film K-19: The Widowmaker.
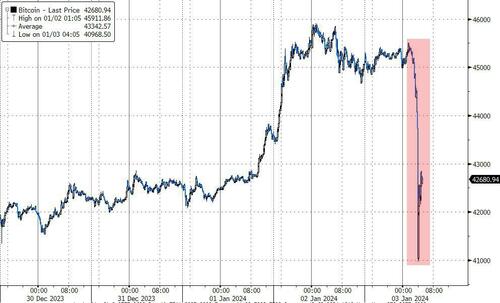
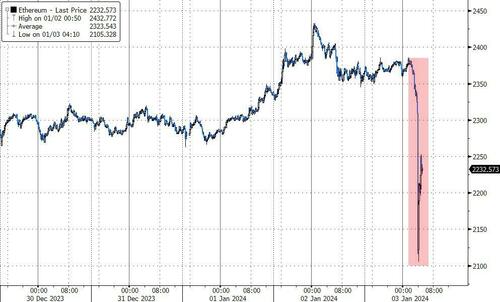
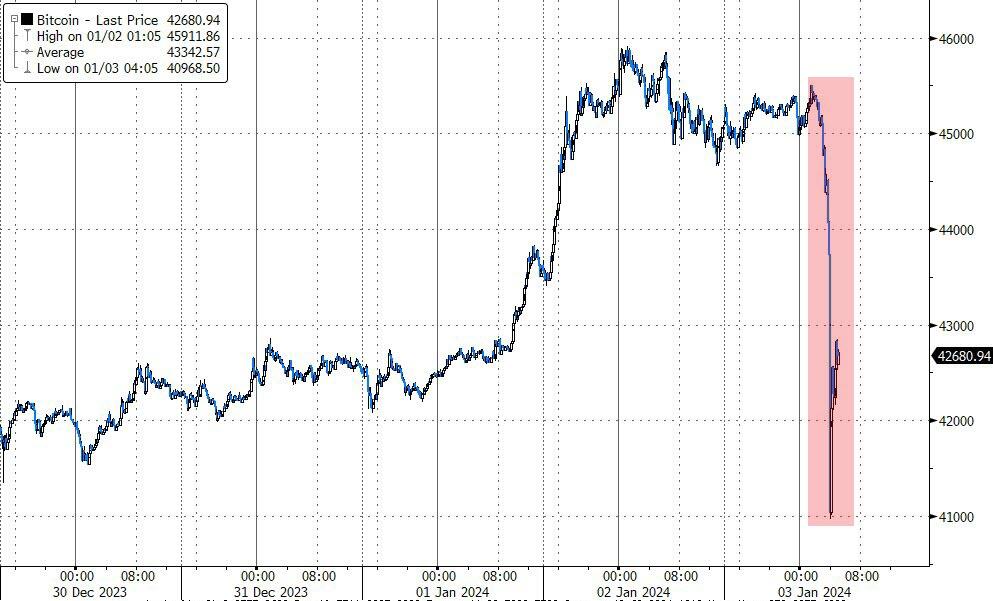
Today the crypto market flash-crashed this morning with Bitcoin instantaneously puking from $45,500 to $41,000…
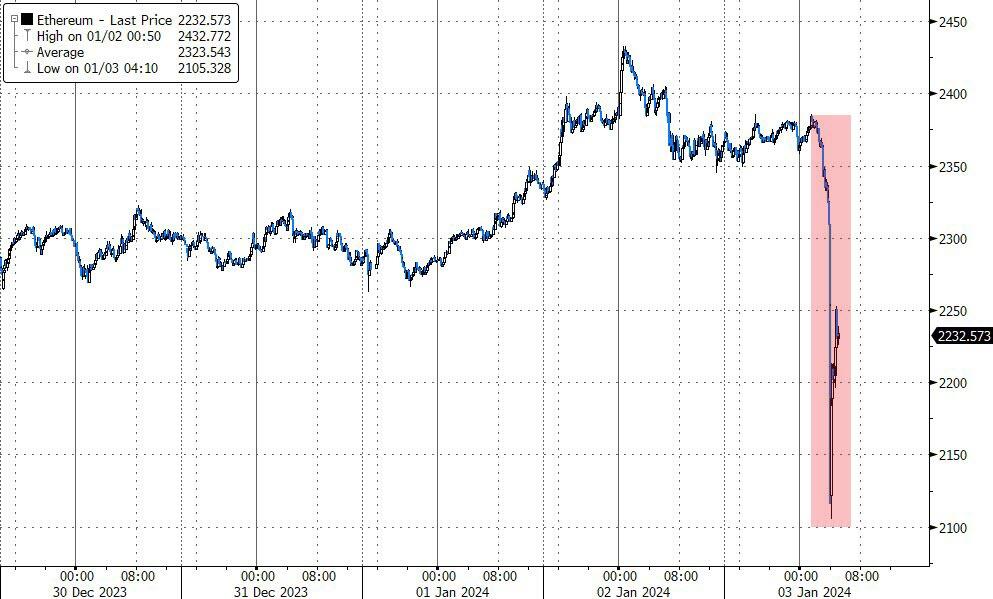
And Ethereum followed suite…
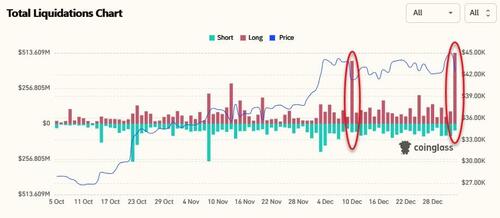
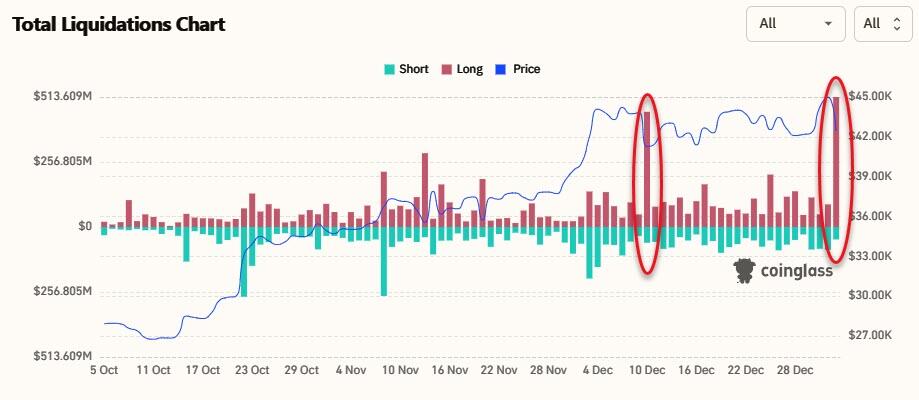
Over $550 million in crypto long positions were liquidated in the past 24 hours, per data from CoinGlass, including $104 million in Bitcoin longs in the past hour alone.
The extremely volatile cryptos are rallying. But still down on the day.
What a way to close out 2023! I need to find Happy Gilmore’s “Happy Place.”
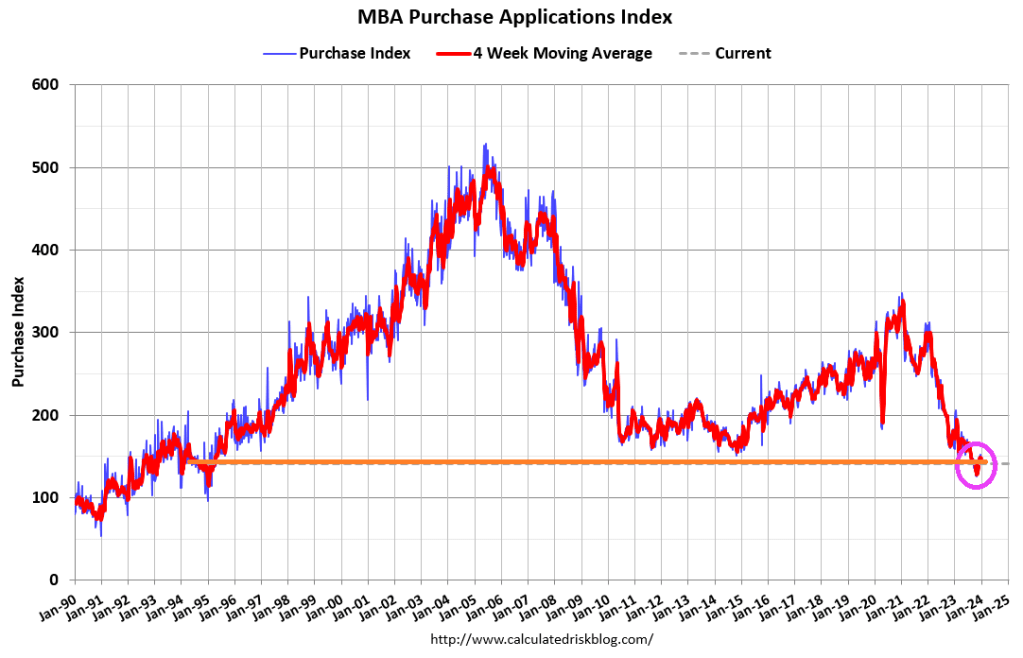
Mortgage applications decreased 9.4 percent from two weeks earlier, according to data from the Mortgage Bankers Association’s (MBA) Weekly Mortgage Applications Survey for the week ending December 29, 2023. The results include adjustments to account for the holidays.
The Market Composite Index, a measure of mortgage loan application volume, decreased 9.4 percent on a seasonally adjusted basis from two weeks earlier. On an unadjusted basis, the Index decreased 38 percent compared with two weeks ago. The seasonally adjusted Purchase Index decreased 5 percent compared with two weeks ago. The unadjusted Purchase Index decreased 34 percent compared with two weeks ago and was 12 percent lower than the same week one year ago.
The unadjusted Refinance Index decreased 43 percent from two weeks ago and was 15 percent higher than the same week one year ago.
The Fed continues to fight inflation. but rates cuts are forecast for 2024. But remember, mortgage rates are down slightly, but still up 130% under Biden.


You must be logged in to post a comment.