Here is where we set today. The cost of insuring for a US debt default remains elevated as the US has hit its statutory debt limit. This is happening at the effective rate of interest on US mortgage debt is rising.
Help us McCarthy! Because Biden and Schumer don’t want to cut ANY spending.
There was a hilarious film with Hillary Swank and Aaron Ekhart called “The Core” where earth’s core stops spinning and the earth gets cooked by the Sun’s rediation. Now we learn that the Earth’s inne core has actually stop spinning. This time, however, all that has happened is that Joe Biden is President which is almost as bad,
But also related to “The Core” is that the important Personal Consumption Expenditures (PCE) are out for December along with PCE price deflator numbers. In short, personal income was up 0.2% month-over-month (MoM) in December while personal spending was down -0.2%. REAL personal spending was down -0.3% MoM.
But the all important PCE deflators numbers were down all well. The REAL PCE price index (or deflator) was down to 5.0% YoY in Decmember while REAL CORE price index was down to 4.40%. All this is happening as M2 Money growth has stop spinning (down to -1.3% YoY in December).
Based on a CORE PCE YoY of 4.40%, the Taylor Rules suggest that The Fed Fund Target rate should be … 10%. However, the current Fed Funds Target rate is only 4.50%, so The Fed is not even half way there.
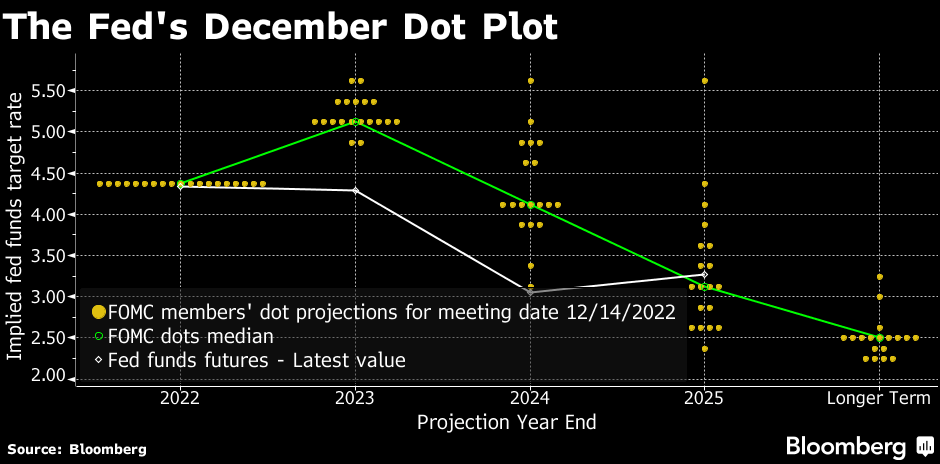
Fed Funds Futures are pointing to a peak rate of 4.90% by the June ’23 FOMC meeting, then a pivot (despite denials from Fed talking heads).
Of course, The Fed doesn’t follow the Taylor Rule or any other transparent rule for rate management. Rather, Fed Chair Powell like former Chair (and current Treasury Secretary Janet Yellen) follow a more seat-of-the-pants approach.
Ah, the start of a new week with Treasury Secretary Janet Yellen arguing (with a straight face) that there is no room in the Federal budget for cuts. Apparenly, Yellen never read any of the massive, pork-laden spending bills signed by Biden (no one else did in Congress either, nor did Biden).
Let’s start with the US credit default swap (1 year). It remains high at 68.72 (the price of insuring against a US default). And the US Treasury yield curve (10Y-3M)? It remains deeply inverted at -114 basis points this morning signaling an impending US recession.
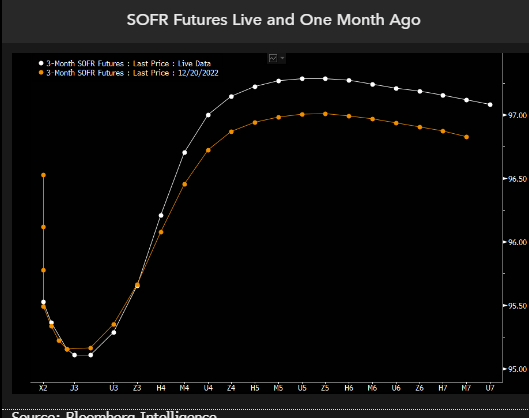
Then we have SOFR (Secured Overnight Financing Rate). SOFR futures are pricing for the Federal Reserve to hike rates a few more times and to start cutting before the end of this year. The pricing for the 2023 rate path is little changed from a month ago, but this year the market has priced in deeper cuts in 2024, with SOFR now seen below 3% by early 2025 before stabilizing. The implication is that hedging recession and significant rate cuts in 2024 now seems to be fully priced in, yet there’s a risk that the Fed cuts even deeper than the market is factoring in.
We think the market is partially preparing for the risk of even deeper rate cuts than linear instruments are pricing. To see how dramatic those are, we can look at options on SOFR futures and model what’s being priced by the volatility surface.
We are seeing the same story if we look at Fed Funds Futures data. Fed rate hikes until June, then rate cuts to follow.
How did Biden’s lawyers and now the DOJ figure out that Biden has classified documents all over the place? Probably from reading “The Hardy Boys.” Except that Biden didn’t cleverly hide classifed documents. Rather, he carelessly left them lying around at The Penn Biden Center and his home in Wilmington Delaware that he shared with his son, Hunter. And probably on the Amtrak train he would take from Wilmington to Union Station in DC. And probably at Chinatown Garden, a short walk from The White House.
First, US default risk as measured by credit default swaps remains elevated (primarily because Biden and Democrats refused to cut wasteful spending or reign in non-retirees on Social Security). And NY Fed’s Reverse Repos remain elevated.
And then we have Citi’s economic surprise index for the US at -17 as The Fed slows money growth to 0%.
I wish I knew a place where inflation and insane Federal government spending and policies doesn’t exist.
We got trouble in Potomac City! No, I’m not talking about the numerous Top Secret documents that Biden carelessly left in his garage in Delaware and the UPenn Biden Center. And they found more over the weekend. I’m talking about the US Treasury 10Y-2Y yield curve being inverted for 135 straight days. And thanks to inflation, REAL wage growth has been negative for 21 straight months.
All this is happening while M2 Money growth (green line) stalls to 0% YoY.
Swaps 5Y are rising as The Fed withdraws monetary stimulus.
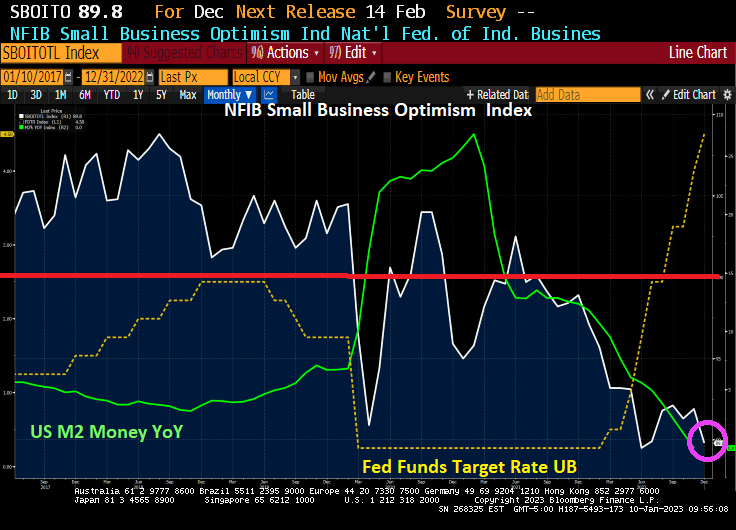
The NFIB Small Business Optimism Index is plunging and just fell below 90. The index was above 100 before the Wuhan virus outbreak in 2020, but has only been at 100 or above for only two months under Biden. And the trend is definitely looking bleak as The Federal Reserve fights inflation with M2 Money growth having collapsed to 0% YoY growth.
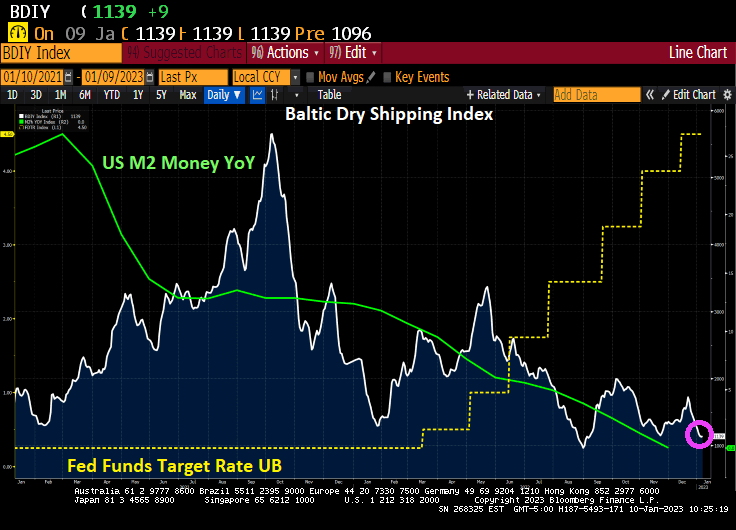
And the Baltic Dry shipping index is falling with M2 Money growth YoY.
I wonder what Fed Chair Jerome Powell is thinking?
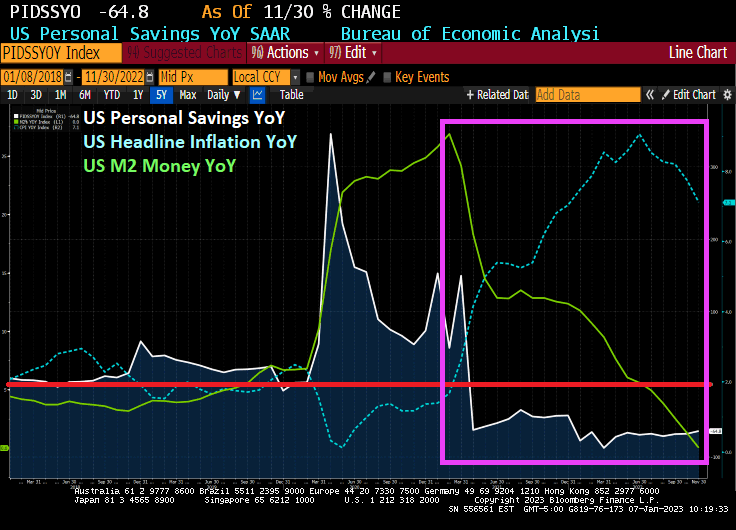
US headline inflation began to soar as soon as Joe Biden became President. A combination of massive stimulus spending related to the Covid economic shutdown and his war on fossil fuels, driving up gasoline and diesel fuel prices. In other words, headline inflation rose from 1.4% Year-over-year (YoY) at the end of December 2020 to 9.1% YoY in June 2021. It has now simmered down to 7.1% YoY as The Fed continues to remove monetary stimulus.
How have consumers coped with inflation caused by massive Federal spending and Biden’s anti-fossil fuel policies? In November, personal savings dropped -64.8% YoY. This marks 20 straight months of declining personal savings.
US M2 Money growth YoY is now … 0%. That is the lowest in US history.
As we begin 2023 (and I am still bummed-out over Ohio State University losing a nail-bitter to Georgia in the Peach Bowl), we need to look at the condition of one of the most important sectors of the US economy.\, housing.
If we look at the US Housing Leading Growth index (courtesy of RecessionAlert.com) has slumped to its worst reading since the recessions of 1982 and 2008.
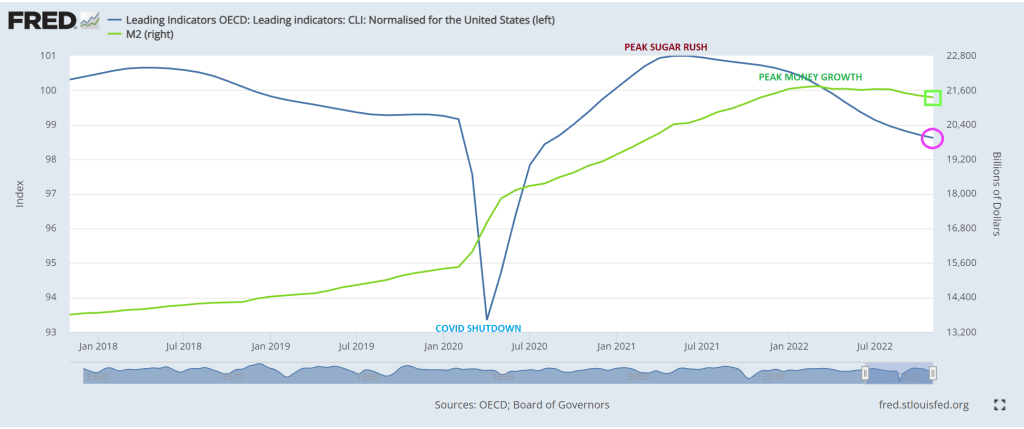
And then we have the OCED leading indicators for the US falling as M2 Money growth slows.
My favorite chart shows US home price growth falling faster than University of Michigan football team’s national championship home hopes.
Will this prompt The Federal Reserve to pivot? Only time will tell.
One of the big problems with Federal goverment and Federal Reserve monetary stimulus is … it wears out. Just look at M2 Money growth.
US existing homes sales fell -7.70% in November to 4.09 million units SAAR. And since the same month last year, existing home sales are down -35.4% YoY.
Existing home sales were the lowest in November since 2010.
The good news? The median price of existing homes fell to 3.21% YoY. The bad news? The ark is really bad pointing to a bad December. Inventory for sale (orange line) remains below pre-Covid shutdown levels.


You must be logged in to post a comment.