The stock market has never started a year falling as quickly as it is now.
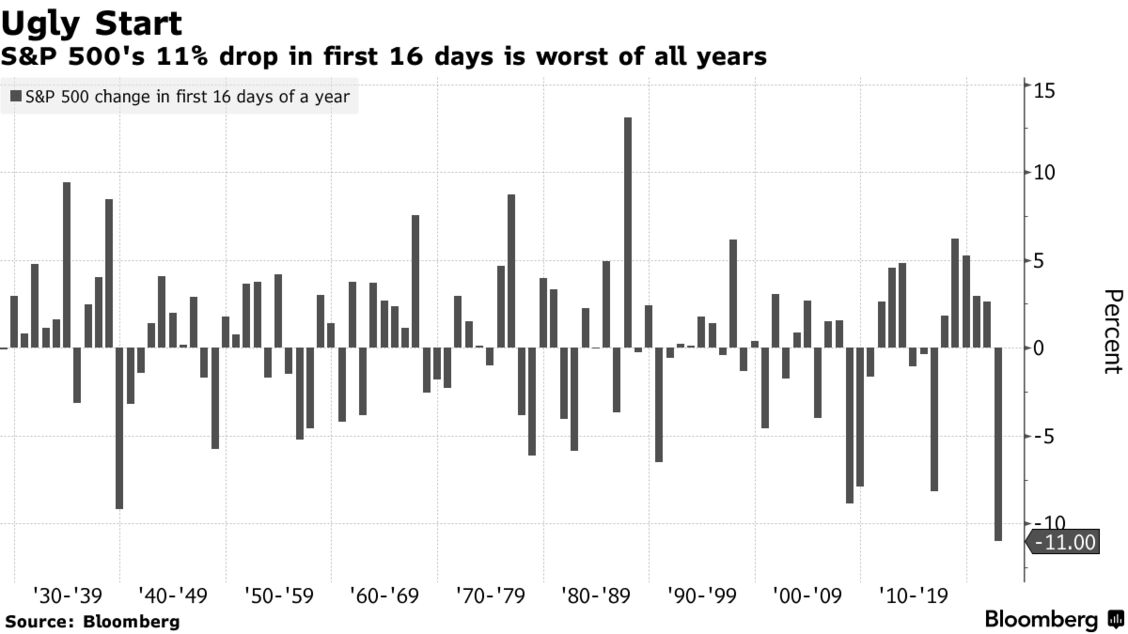
The S&P 500 has dropped 11% — heading into correction territory — in the first 16 trading days of 2022 in its worst-ever start to a year, according to Bloomberg data that goes back over nine decades.
The downturn comes as traders brace for the Federal Reserve to tighten monetary policy and a surge in U.S. Treasury yields weighs on the outlook for stocks. A host of technical signals also suggest that more volatility may be coming up ahead.
“The Fed pulled the punchbowl, liquidity has evaporated, and the S&P and NDX broke below their 200dma for the first time since the Covid outbreak,” said Rich Ross, technical strategist at Evercore ISI.
A bear market down to the 3,800 level is likely for the S&P 500, Ross said, given “the dramatic erosion of the technical backdrop, in conjunction with the highest inflation, tightest policy, and most uncertain political and geopolitical condition in years” — not to mention its historic rally since 2020.
The Shiller CAPE ratio is extremely high …. not surprising how much air The Fed pumped into the market tires.
Is this the bubble burst many were expecting once The Federal Reserve starting raising rates?
Well, if today’s market opening is an indication, the answer is yes. The NASDAQ Composite Index is down 1.36% and West Texas Intermediate Crude Oil futures prices are down 2%.
The S&P 500 index is down over 10% since January 3rd.
Drawdown is taking place.
But if you think the US equities are deflating, look at European equities. The Euro Stoxx 50 index is down 4.04%.
COVID and its omicron variant (as well as government reactions such as mask and vaccination mandates) are wreaking havoc on the global economy, but particularly in the USA where the Federal government dumped trillions of dollars in fiscal stimulus along with The Federal Reserve’s monetary stimulus into an economy not prepared for it. The result? INFLATION.
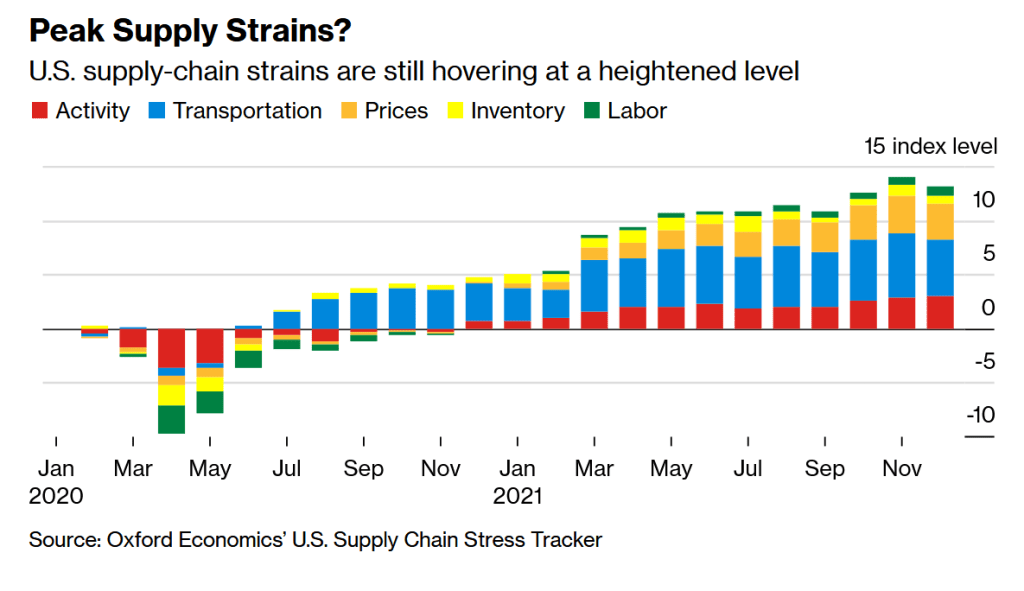
But global supply chains are nearing a turning point that’s set to help determine whether logistics headwinds abate soon or keep restraining the global economy and prop up inflation well into 2022, according to several new barometers of the strains.
Just a week before the start of Lunar New Year, the holiday celebrated in China and across Asia that coincides with a peak shipping season, economists from Wall Street to the U.S. central bank are unveiling a string of models in the hope of detecting the first signs of relief in global commerce.
From Europe to the U.S. and China, production and transportation have stayed bogged down in the early days of 2022 by labor and parts shortages, in part because of the fast-spreading omicron variant.
Among the big unknowns: whether solid demand from consumers and businesses will start to loosen up, allowing economies to finally see some easing in supply bottlenecks. Fresh indicators from the private and official sectors are in high demand because there’s still much uncertainty in industries overlooked by mainstream economics before the pandemic.
Once the realm of trade and industrial organization experts, supply chains “have shifted to center stage as a critical driver of sky-high inflation and a stumbling block to the recovery,” Bloomberg Chief Economist Tom Orlik said. “The profusion of new indices and trackers won’t unblock the arteries of the global economy any quicker. They should give policy makers and investors a better idea of how fast — or slowly — we are getting back to normal.”
The Bloomberg Economics Index
Bloomberg Economics’ latest supply constraint index for the U.S. shows that shortages have trended modestly lower for six months. Even so, strains remain elevated, and the wave of worker absenteeism is adding to the problems at the start of 2022.
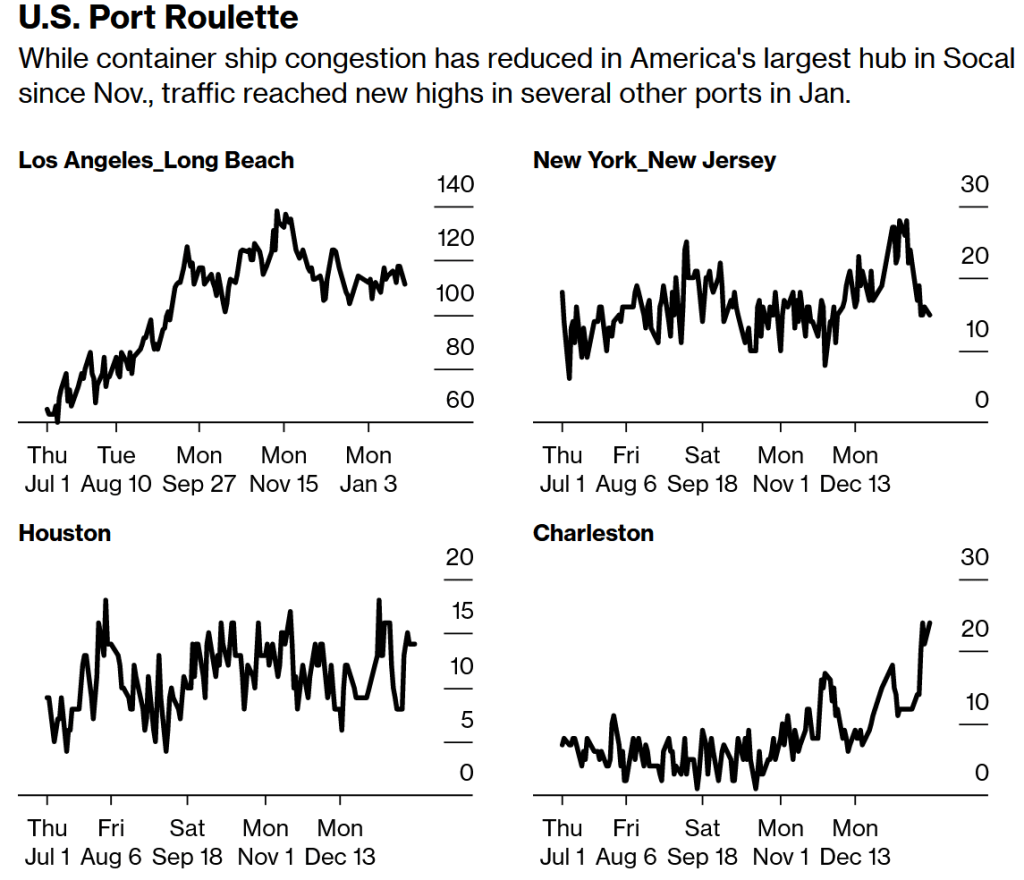
Port traffic tracked by Bloomberg shows container congestion continues to rankle the U.S. supply chain from Charleston, South Carolina, to the West Coast. The tally of ships queuing for the neighboring gateways of Los Angeles and Long Beach, California, continued to extend into Mexican waters, totaling 111 vessels late Sunday, nearly double the amount in July.
Source: Bloomberg, IHS Markit, Genscape
Note: Data counts the total number of container ships combined in port and in offshore anchorage area.
Kuehne+Nagel’s Disruption Indicator
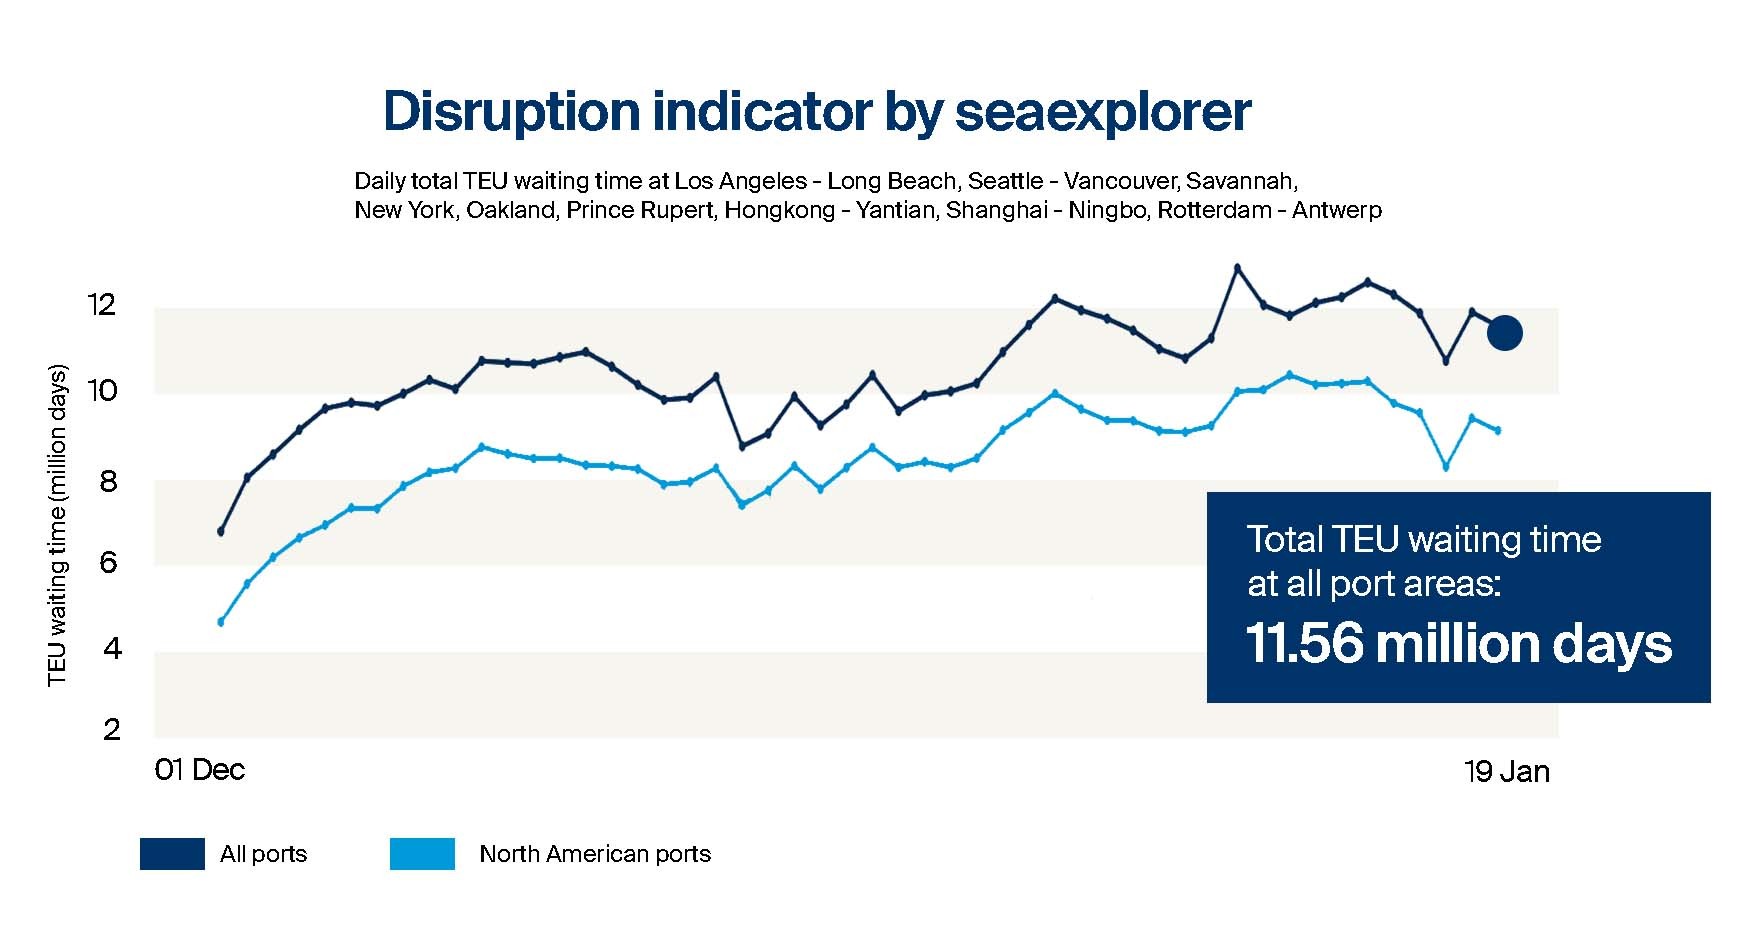
Kuehne+Nagel International AG last week launched its Seaexplorer disruptionindicator, which the Swiss logistics company says aims to measure the efficiency of container shipping globally. It shows current disruptions at nine hot spots is hovering near “one of highest levels ever recorded,” with 80% of the problems happening at North American ports.
Flexport’s Guages
Another freight forwarder, San Francisco-based Flexport Inc., last year developed its Post-Covid Indicator to try to pinpoint the shift by American consumers back to purchasing more services and away from pandemic-fueled goods. The latest reading released Jan. 14 “indicates the preference for goods will likely remain elevated during the first quarter of 2022.”
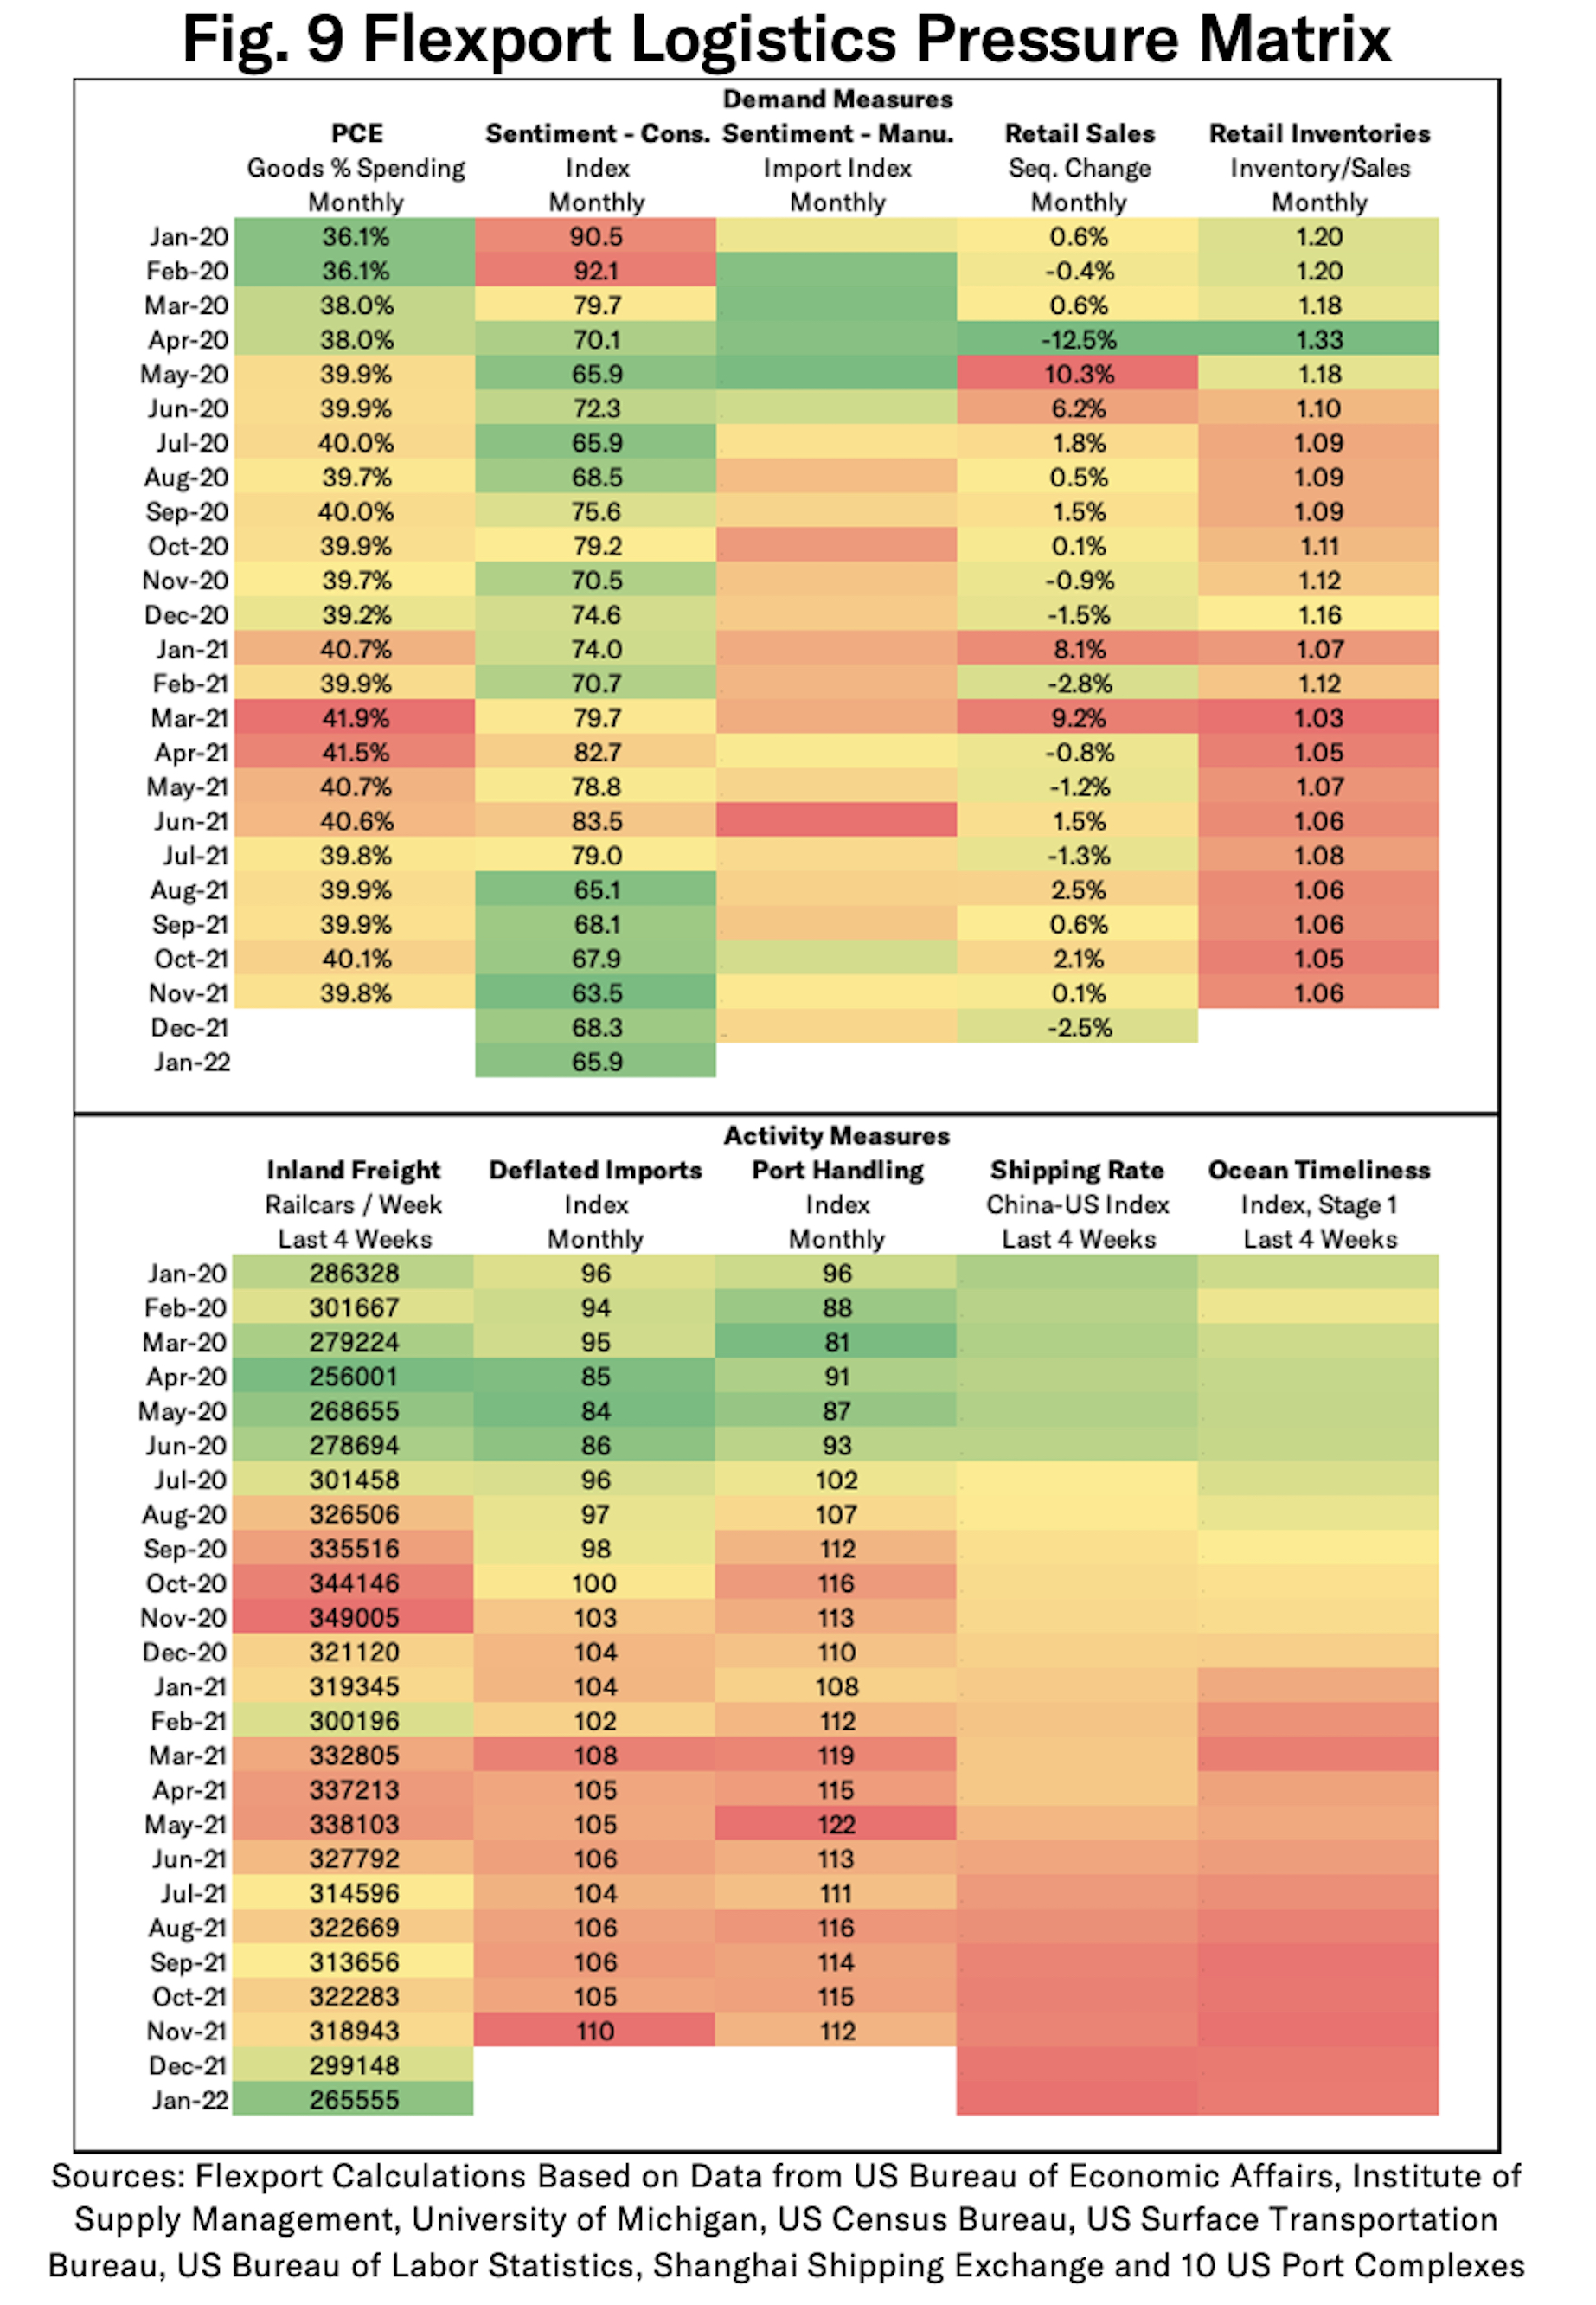
Flexport has a new Logistics Pressure Matrix with a heat map showing demand and logistics trends, and much of those numbers are still flashing yellow or red. Flexport supply chain economist Chris Rogers said in a recent online post that similar grids for Asia and European markets will be part of the research.
The Federal Reserve’s Stress Monitor
Adding their stamp to the burgeoning genre of supply stress indicators were three Ph.D. economists from the Federal Reserve Bank of New York, with the launch its Global Supply Chain Pressure Index. Rolled out earlier this month, it shows that the difficulties, “while still historically high, have peaked and might start to moderate somewhat going forward.” The New York Fed said it plans a follow-up report to quantify the impact of shocks on producer and consumer price inflation.
Morgan Stanley’s Index
Less than a week later came the Morgan Stanley Supply Chain Index. It lined up with the Fed’s view that frictions have probably peaked, though some of improvement ahead will come from a slowdown in the demand for goods.
“Supply disruptions remain a constraint to global trade recovery, but as firms continue to make capacity adjustments to address them, capacity expansion could mitigate these,” Morgan Stanley economists wrote in a report Jan. 12.
Citigroup’s Tool
Citigroup Inc. last week released research that was less optimistic yet complementary to the New York Fed’s work, which Citi said doesn’t factor the role of surging demand as a contributor to the supply disruptions. Sponsored Content The Collaboration Disconnect Atlassian
Co-written by Citi’s global chief economist Nathan Sheets, a former U.S. Treasury undersecretary for international affairs, the bank’s analysis “gives a more complete, and intuitive, picture of the current situation.” While strains may ease in coming months, Citi said, “these supply-chain pressures are likely to be present through the end of 2022 and, probably, into 2023 as well.”
The Keil Institute’s Flows Tracker
In Germany, the Kiel Institute for the World Economy updates twice a month its Trade Indicator, which looks at flows across the U.S., China and Europe. Its latest reading Jan. 20 shows that along the key trading route between Europe and Asia, there are 15% fewer goods moving than there would be under normal times. The last time the gap was that large was in mid-2020, when many economies were reeling from initial lockdowns, Kiel said.
More recently, “the omicron outbreak in China and the Chinese government’s containment attempts through hard lockdowns and plant closures are likely to have a negative impact on Europe in the spring,” says Vincent Stamer, head of the Kiel Trade Indicator, said in a post last week. “This is also supported by the fact that the amount of global goods stuck on container ships recently increased again.”
Baltic Dry Index
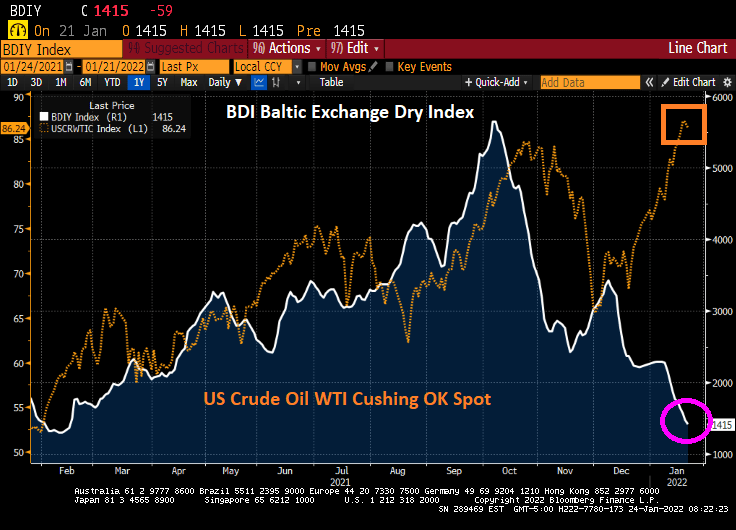
The Baltic Dry shipping cost index indicates that costs for shipping materials such as iron ore have decline to where it started under Biden, despite West Texas Crude Oil spot prices begin considerably higher thanks to Biden’s anti-fossil fuel policies.
So as the world comes out of Omicron (and whatever COVID variant rises to take its place), we should see a normalization in the supply chain. And with Intel building a new chip factory in New Albany Ohio (aka, outskirts of Columbus). the supply chain woes will eventually subside.
Then again, there is always the Russia-Ukraine tension that may erupt into a disaster. I suggest that President Biden sent Hunter Biden to Moscow to negotiate on behalf of The Ukraine.
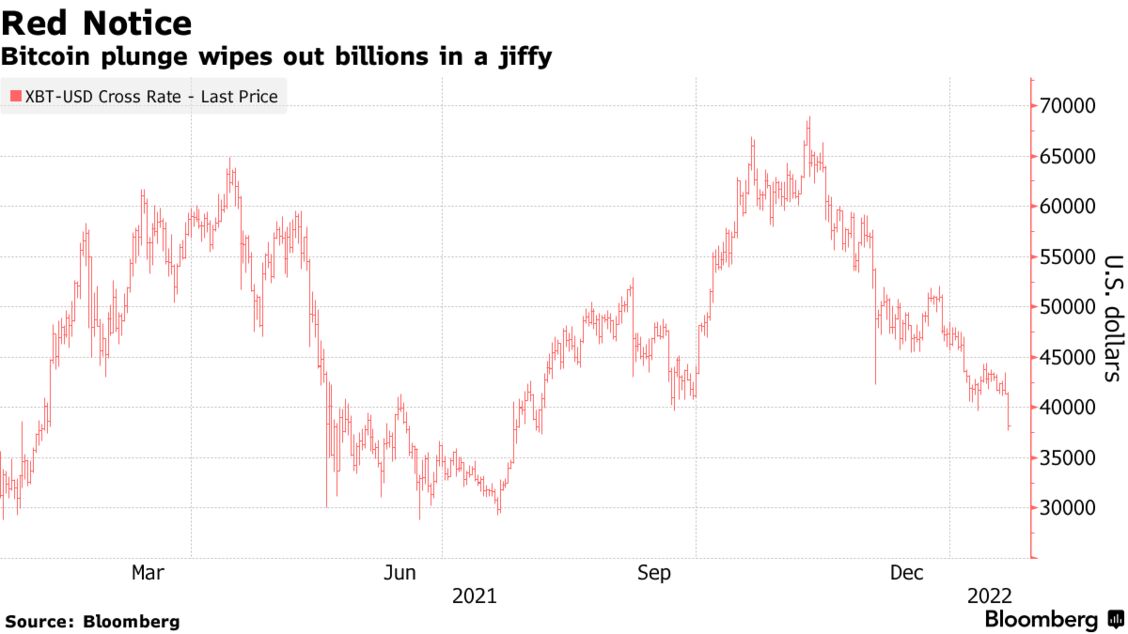
For Bitcoin, there’s only been one constant recently: decline after decline after decline. And the superlatives have piled up really quickly.
With the Federal Reserve intending to withdraw stimulus from the market, riskier assets the world over have suffered. Bitcoin, the largest digital asset, lost as much as 8.7% Friday and dropped below $38,000 to its lowest level in six months. Since its peak in November, it has lost 40% of its value. Other digital currencies have suffered just as much, if not more, with Ether and meme coins mired in similar drawdowns.
Bitcoin’s decline since that November high has wiped out more than $570 billion in market value, and roughly $1.17 trillion has been lost from the aggregate crypto market. While there have been much larger percentage drawdowns for both Bitcoin and the aggregate market, this marks the second-largest ever decline in dollar terms for both, according to Bespoke Investment Group.
“It gives an idea of the scale of value destruction that percentage declines can mask,” wrote Bespoke analysts in a note. “Crypto is, of course, vulnerable to these sorts of selloffs given its naturally higher volatility historically, but given how large market caps have gotten, the volatility is worth thinking about both in raw dollar terms as well as in percentage terms.”
Bloomberg
With the Fed’s intentions rocking both cryptocurrencies and stocks, a dominant theme has emerged in the digital-asset space: cryptos have twisted and turned in nearly exactly the same way as equities have.
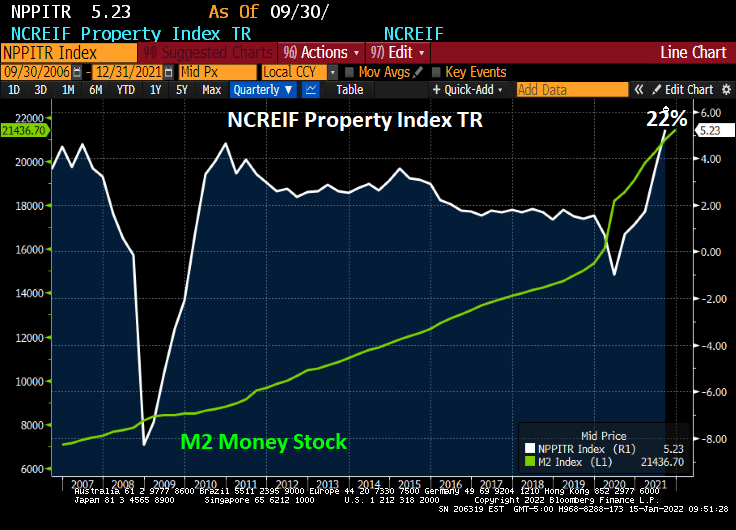
Inflation is burning out of control. While home price growth has been off the cherts (as Jean-Ralphio would say), commercial real estate has jumped incredibly at 22% YoY. The Bloomberg charting function hasn’t updated for the Q4 NCREIF report yet so I had to manually write-in 22% on the following chart.
So, what will happen IF The Fed follows through with its monetary stimulus reduction? JPMC’s Jaime Dimon warns that The Fed could hike 7 times in 2022 and not be ‘sweet and gentle’.
Start with the UMich Buying Conditions for Houses. It “rose” to 83. Unfortunately, 100 is the baseline and any number below 100 is bad. The reason? The massive increase in US home prices since 2020.
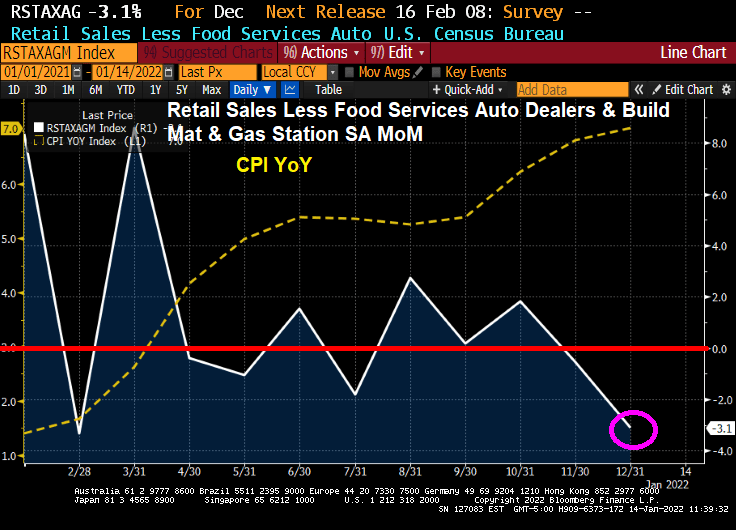
But retail sales are hurting thanks to higher prices. Retail sales less food services and auto are DOWN 3.1% MoM.
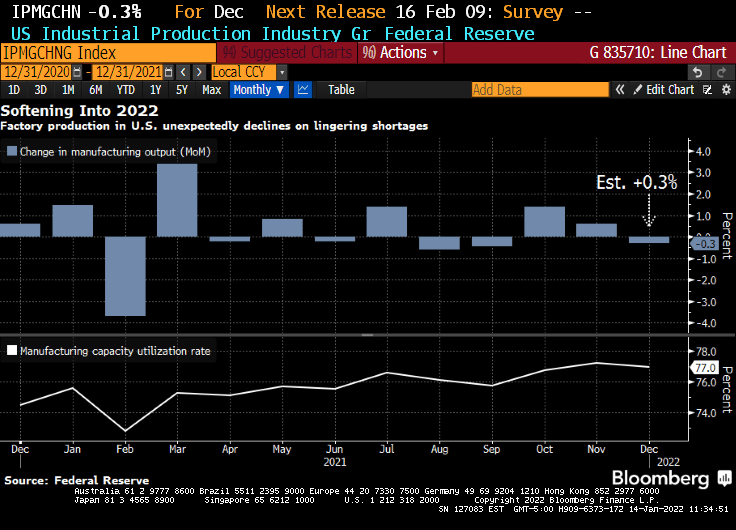
Meanwhile, US industrial production fell to -0.3%.
2022 should be an interesting year as the wheels come off The Fed’s constant stimulation of markets.
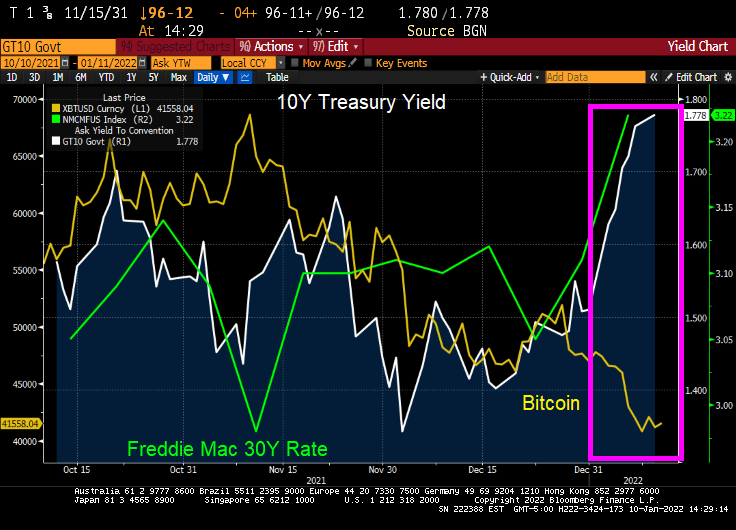
Today, we saw the 10-year Treasury Note yield almost hit 1.8% as mortgage rates rose to 3.22%.
Unfortunately for crypto investors, bitcoin is having a bad 2022. And ethereum is feeling some pain as well.
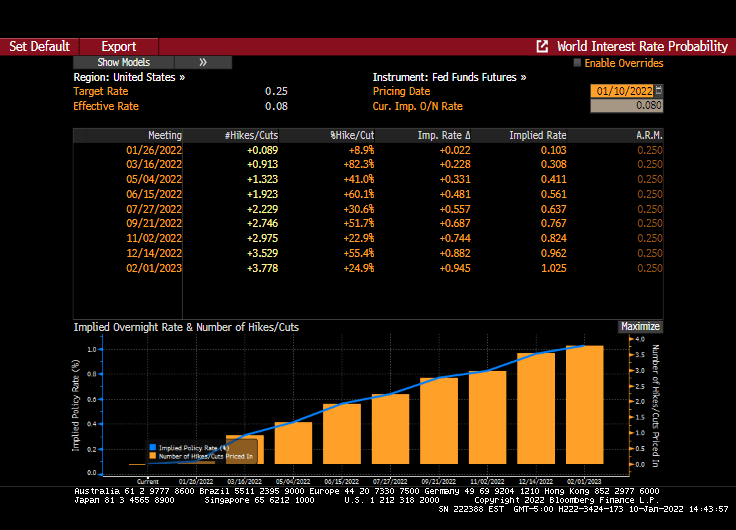
While Goldman Snakes predicted 4 rates increases in 2022, Fed Funds Futures are predicting almost 4 rates increases (3 in 2022 and 1 in Jan 2023 … almost).
So whatever is giving markets the jitters, I would follow the advice of Samuel L. Jackson from Jurassic Park: “Hold on to your butts.”
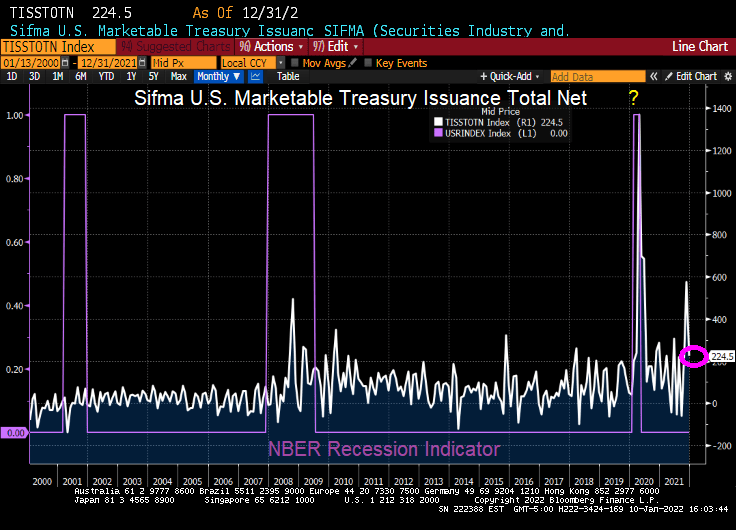
UPDATE: Did The Fed/Treasury seriously overreact due to COVID? Lool at Treasury issuance related to COVID recession versus the financial crisis (Great Recession) and the 2001 recession.
When we look at the Buffett Indicator, we can see how The Federal Reserve’s loose monetary policies (or follycies) are driving up stocks to unsustainable levels that may not survive without The Fed’s “Do Ho Big Bubble Policies.”
How about the Shiller CAPE (Cyclically-adjusted Price/Earnings) ratio? While not up to dot.com levels yet, the Shiller CAPE ratio is climbing with the assistance of The Fed and their insane money printing.
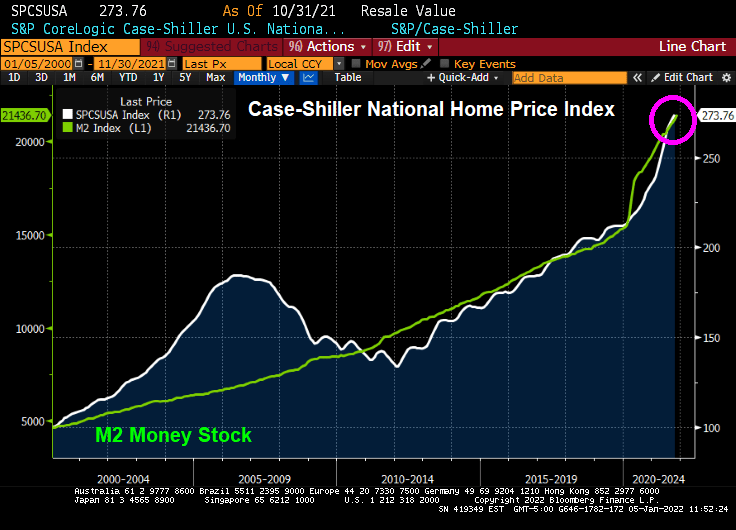
How about house prices? The Case-Shiller National home price index is far above the level last scene during the housing bubble of 2005-2007. Again, with a little help from The Federal Reserve.
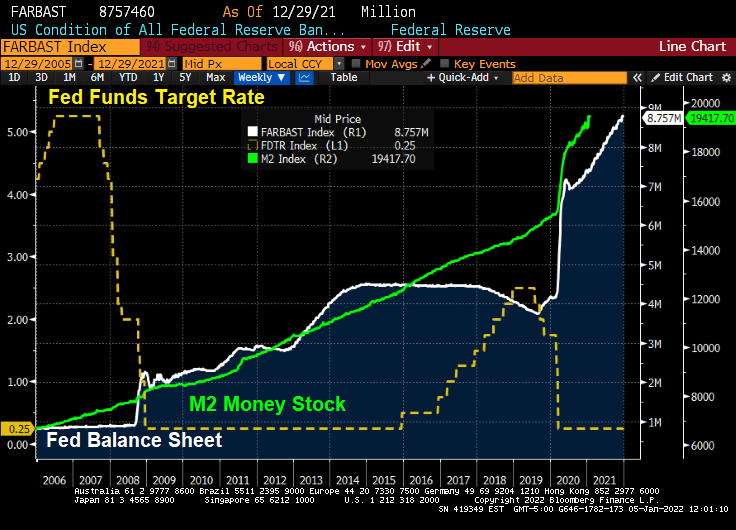
I can’t wait to see how the equity market and housing market reacts IF The Fed actually follows through with reducing monetary stimulus. Probably not just adding more stimulus, just reinvesting the Treasury and MBS proceeds (aka, not shrinking the balance sheet).
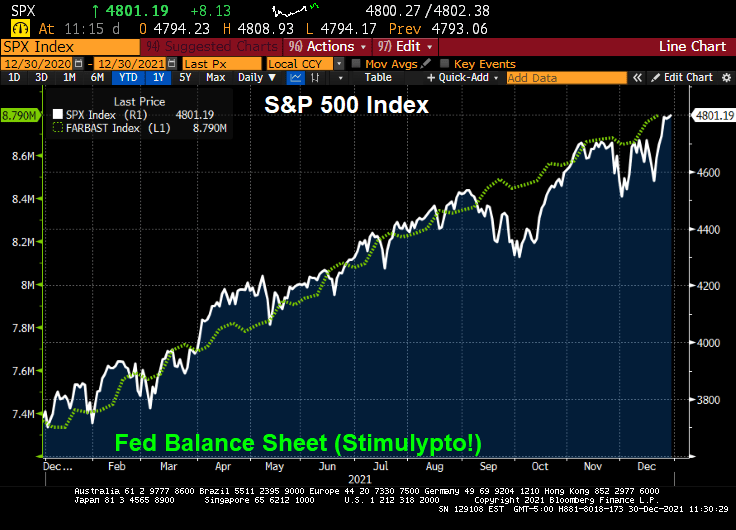
2021 saw the S&P 500 index generate a return of 28.7%. Much of it thanks to The Federal Reserve “stimulypto” or excessive monetary easing.
But only three hedge funds beat the S&P 500 index: Senvest, Impala and SR. Thanks to fees (trading and management), the other hedge funds underperformed the S&P 500 index. And underperformed The Fed!
Melvin Capital was the worst performing hedge fund of the ones examined.
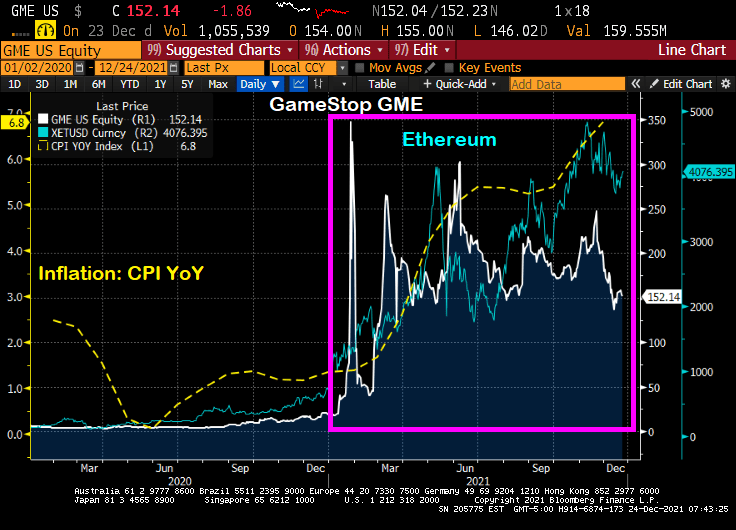
2021 has been a very weird year. Inflation has boomed (highest in 40 years) after the election of Joe Biden as President of the USA (call it Bidenflation). Then we have The Federal Reserve barely acting on the booming inflation (keeping rates at 25 basis points while withdrawing the COVID-related monetary stimulus).
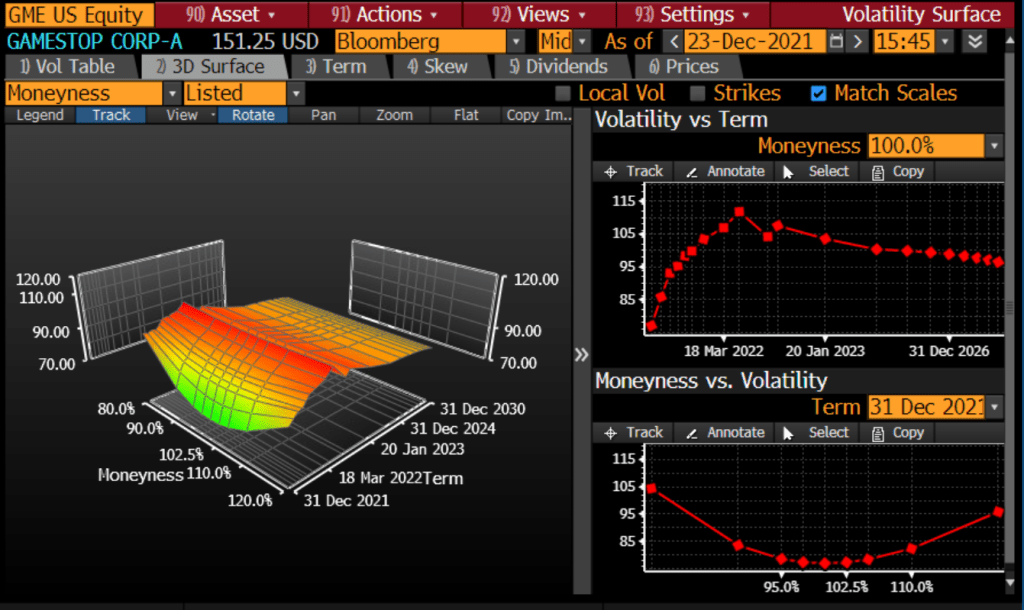
Given the volatility of GameStop (Reddit-inspired), you can see the strange shape of GameStop’s volatility surface.
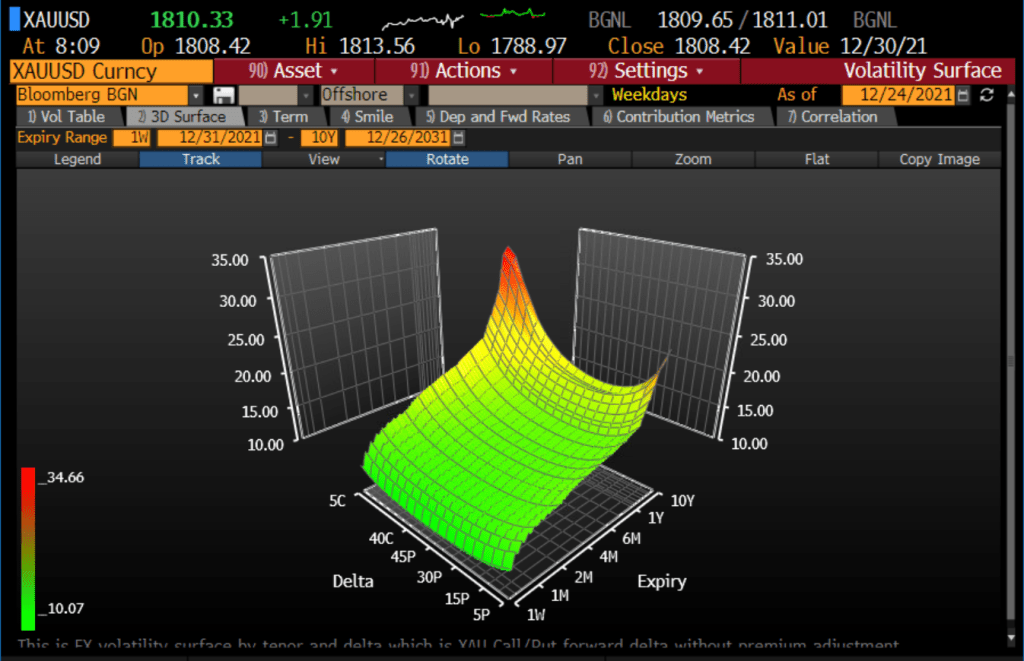
By contrast, gold is now where it was was at the beginning of 2021 and the surge of Bidenflation.
Here is volatility surface for gold.
So, there are a number of meme stocks (GameStop is just one example), gold, silver, cryptos such as Bitcoin and Ethereum. But gold seems to be placid with respect to inflation, but the meme stocks and cryptos seem to be motoring. Or is it rage against the financial machine? Or rage against Bidenflation??
The US stock and bond markets are closed today and tomorrow, Christmas day.
Have a Merry Christmas! And celebrate the “Santa Pause” as Powell refuses to raise rates to combat inflation until 2022.



















You must be logged in to post a comment.