Turkey (the nation, not the bird) is now the Venezuela of Europe/Middle East, where insane government policies are destroying both nations.
(Dow Jones) — Turkey’s central bank intervened to arrest the plunge in the country’s currency, which lost as much as 8% of its value against the dollar on Friday in an ongoing crisis that is straining the country’s financial system.
The crash followed another decision by the central bank on Thursday to cut interest rates under pressure from President Recep Tayyip Erdogan, who favors lower rates as a part of a vision to grow the Turkish economy. Mainstream economists have urged the government to raise interest rates to control Turkey’s rising inflation, which reached more than 21% last month, according to official statistics.
The ongoing plunge is putting increasing pressure on ordinary Turks who have seen their savings evaporate, and adding to pressure on the banking system which has high levels of foreign-currency-denominated loans to repay within the next 12 months.
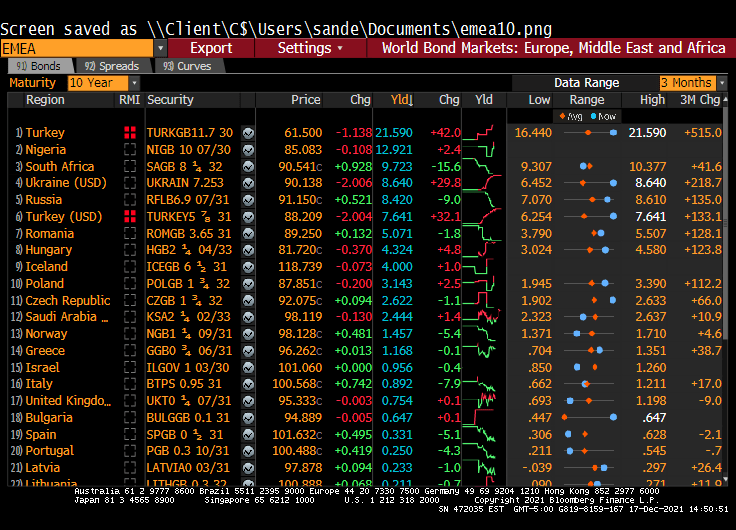
Wow. Turkey’s 10-year sovereign yield rose 42 BPS today to 21.590%. Turkey is looking like the Venezuela of Europe and the Middle East.
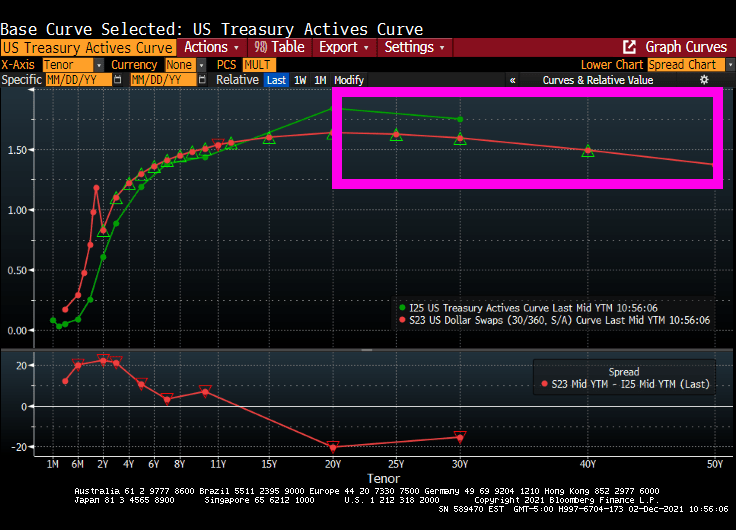
The Turkish sovereign curve in their home currency is humped.
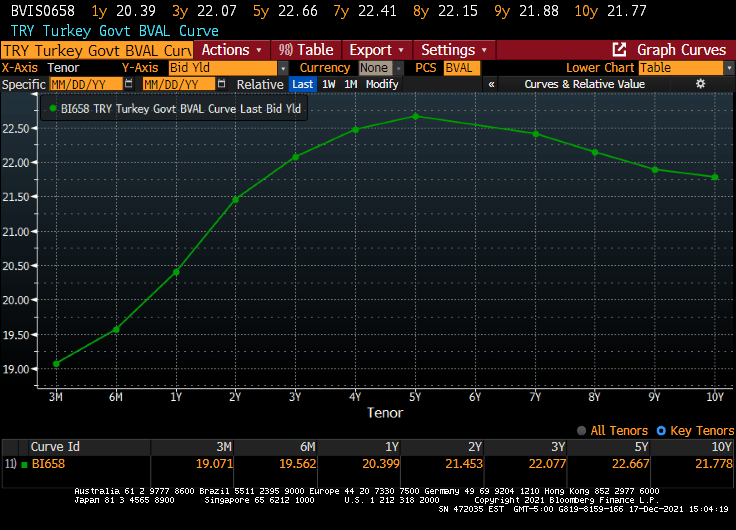
But the Turkish yield curve (in US Dollars) looks more like the US Treasury actives curve.

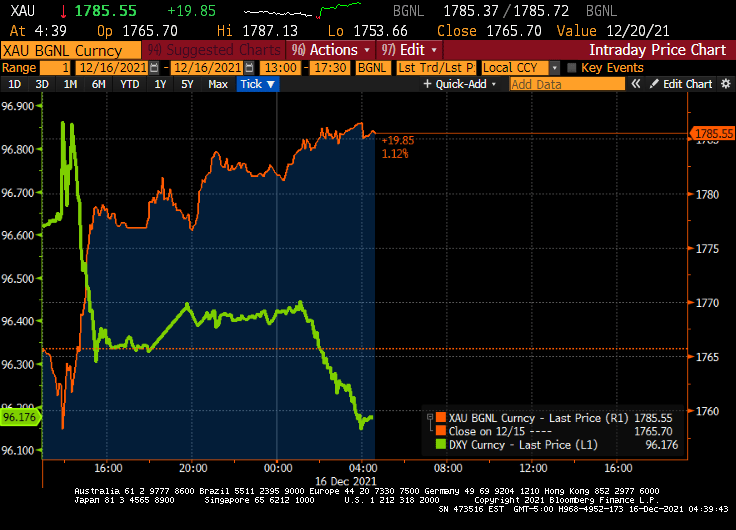
The Turkish Lira is crashing against the US Dollar.

Meanwhile, the Central Bank of Turkey is cutting their repo rate as inflation soars. WTF???

I love this ZeroHedge headline: “Turkey Halts All Stock Trading As Currency Disintegrates, Central Bank Powerless To Halt Collapse.” Yes, it would help if Turkey’s Central Bank was RAISING rates rather than cutting them in order to stem the tide of inflation. It is like Turkey’s Central Bank is steering their ship of state INTO an F5 tornado.
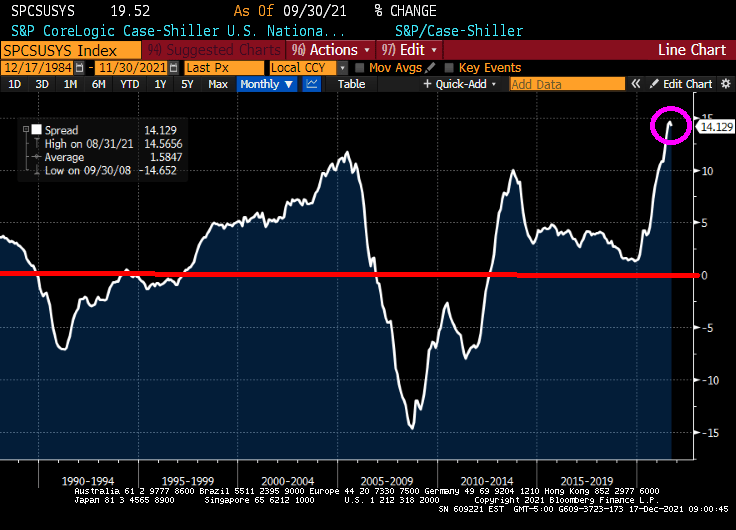
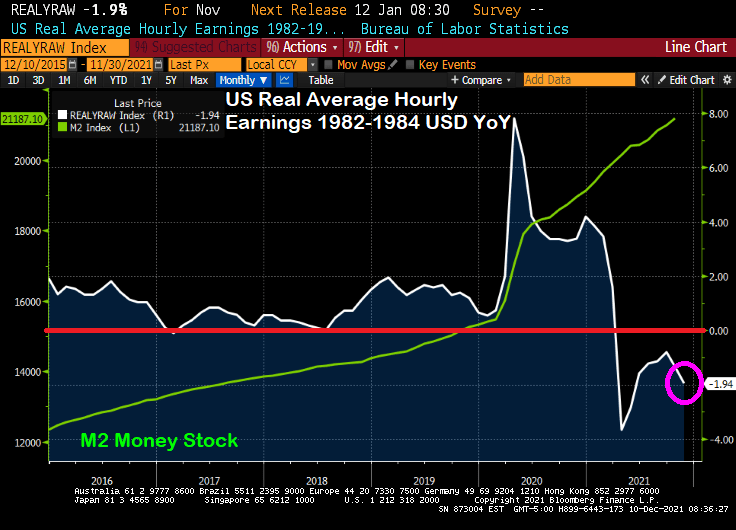
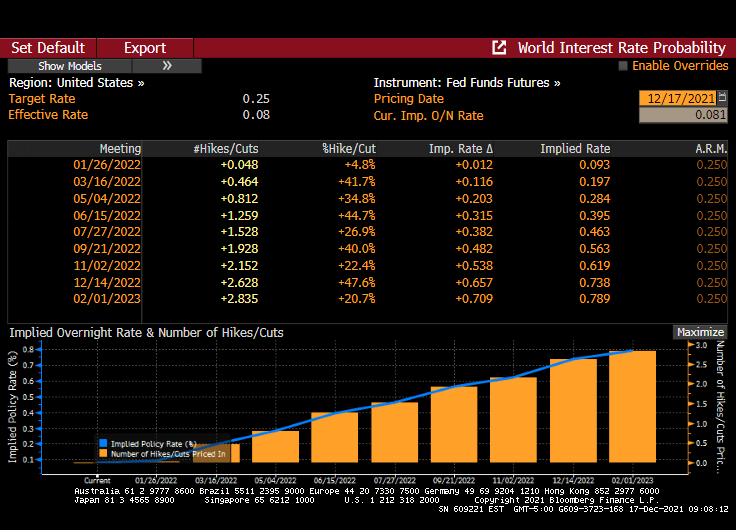
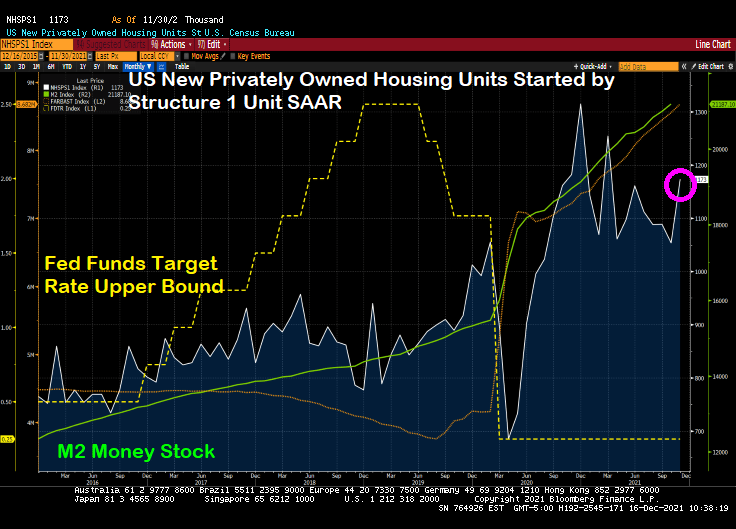
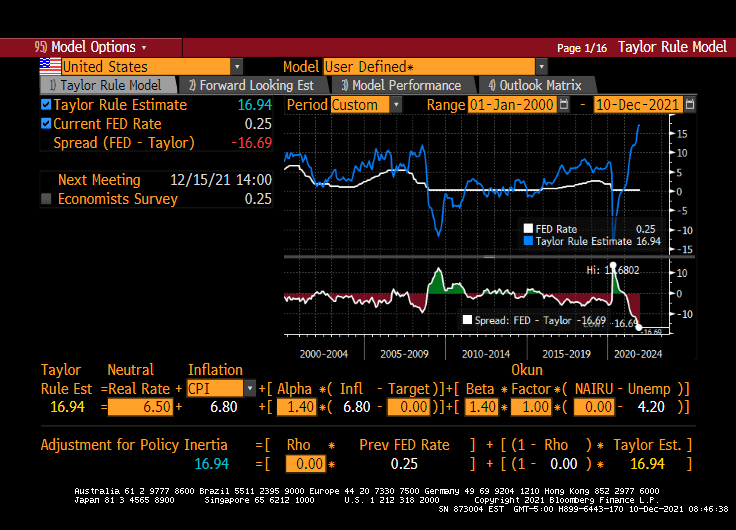
Then again, US Fed chair Powell seems to be taking his time in cooling US inflation by … doing nothing.
Here is Turkish President Erdogan meeting with Venezuelan President Nicholas Maduro. “Together we can destroy both economies!”


You must be logged in to post a comment.