The Great Dislocation! M2 Money Growth Crashes To 0% As M2 Velocity Near Lowest In History (21 Straight Months Of Negative Weekly Earnings Growth)

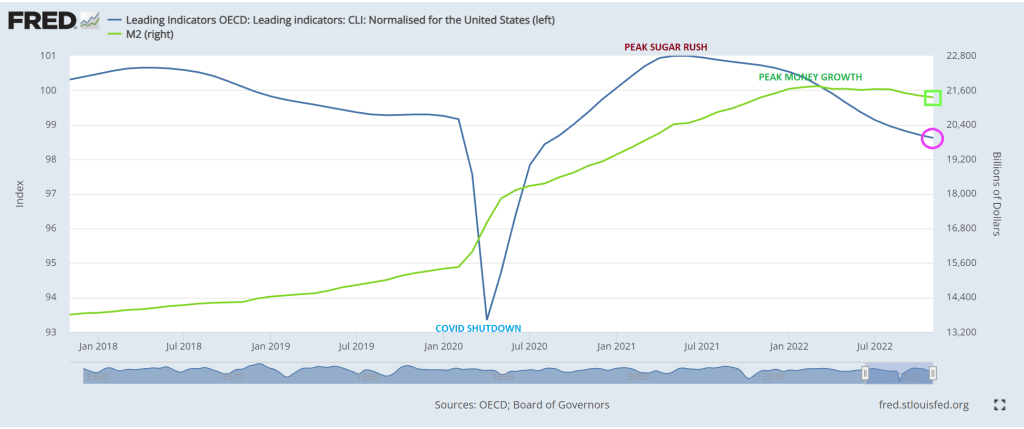
The 2020 Covid outbreak and the resulting government shutdowns and school closures begat a Washington DC spending spree and Federal Reserve monetary stimulus barrage unlike anything other time in history. Congress and Administrations love to spend other people’s money, but as Rahm Emanuel once said “You never let a serious crisis go to waste. And what I mean by that it’s an opportunity to do things you think you could not do before” And wow, did they ever binge spend and expand the M2 Money supply. I call it “The Great Dislocation” of the economy and we never recovered from it.

Or as Ray Wylie Hubbard sang, “Drinking with my low life companions, dancin’ with a woman who is not my wife.” This should be the theme song for Washington DC and their manic spending.

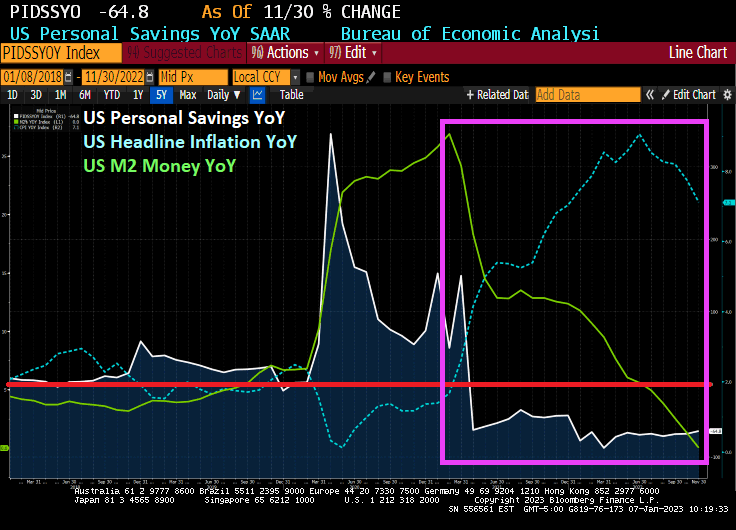
But after the massive spending splurges and Fed monetary stimultypto, The Fed finally started withdrawing “the punch bowl” to combat inflation. M2 Money growth year-over-year (YoY) is now 0%. And with inflation, US average weekly earnings growth YoY turned negativc and has been negative for 21 straight months.

After the spending explosion under Pelosi/Schumer and Powell’s monetary, M2 Money velocity (GDP/M2 Money) crashed to it lowest level in history. So now we have depressed money velocity and no M2 money growth. And the US still has 21 straight months of negative weekly earnings growth.

But former Fed Chair and current Secretary of Treasury Janet Yellen is pleased that inflation is FINALLY slowing which Yellen attributes to relaxing supply chains. Or is it declining M2 Money growth, Janet?

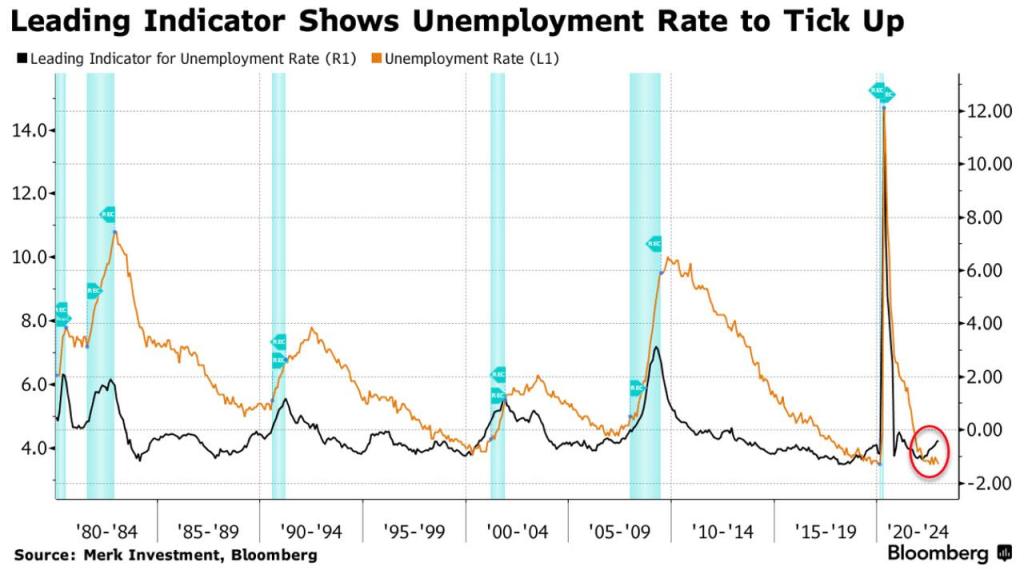
Now that the Federal government’s spending spree and The Fed’s monetary stimulypto dislocated the US economy, we are headed for a recession with no ammunition left in The Fed’s arsenal.

After all. The Federal Reserve has been destroying consumer purchasing power since 1913. And we may be at the end of The Fed’s monetary rope.

Even worse, we have Joe Biden as President, who curiously has been found to have classified documents in his possession from when he was Vice President, at least, at two locations (his Wilmington DL home that his son Hunter had access to and the now infamous Penn Biden Center in Washington DC). Even worse, Biden seems to be talking to dead world leaders like Germany’s Schmidt and France’s Mitterand.

Knowing Biden’s penchant for blatant lying and carelessness, I wouldn’t be surprised if this is a stack of classified documents on the table during his meeting with Treasury Secretary Janet Yellen.

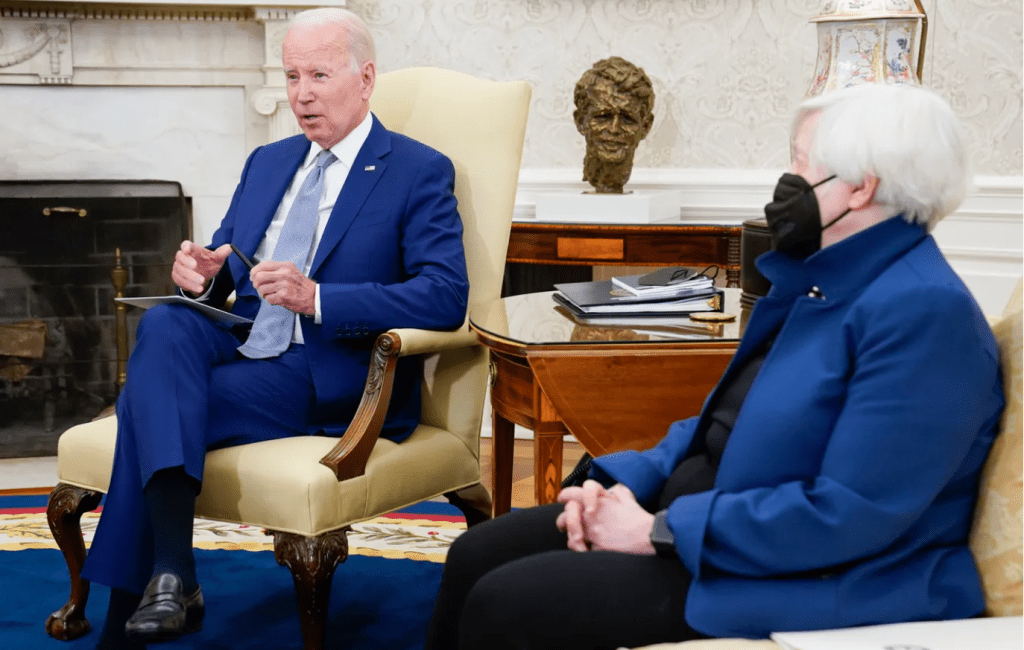
Let’s hope Biden isn’t saying that he is talking to late Robert Kennedy, the former US Attorney General.

Magic? US Inflation Cools To -0.1% In December, 6.5% Year-over-Year YoY (REAL Weekly Earnings NEGATIVE For The 21st Straight Month At -3.1% YoY)

I don’t think this is a record that Biden can run on for re-election: 21 straight months of NEGATIVE REAL WAGE GRWOTH. Fortunately for Fed Chair Jay Powell, he is not an elected official.

The December inflation report still shows elevated inflation in the US, but only -0.1% since November (MoM), but still high compared to last year (6.5% YoY). That is still over 3x The Fed’s target inflation rate of 2%.

While headline inflation fell to 0.1% MoM, CORE inflation (removing food and energy) rose again 0.3% MoM and 5.7% YoY.

What exactly went up in price in December? Food and energy were all over 10% YoY growth.

At 6.50% YoY headline inflation, the Taylor Rule suggests a Fed Funds Target rate of … 13.13%. Well, I guess that Powell will say there is more rate hikes to be done.

As if The Fed follows any sensible rule. Instead, The Fed relies on magic tricks.

Coping With Inflation? US Personal Savings Declines -64.8% YoY In November As M2 Money Growth Falls To Lowest In History (0% YoY)

US headline inflation began to soar as soon as Joe Biden became President. A combination of massive stimulus spending related to the Covid economic shutdown and his war on fossil fuels, driving up gasoline and diesel fuel prices. In other words, headline inflation rose from 1.4% Year-over-year (YoY) at the end of December 2020 to 9.1% YoY in June 2021. It has now simmered down to 7.1% YoY as The Fed continues to remove monetary stimulus.

How have consumers coped with inflation caused by massive Federal spending and Biden’s anti-fossil fuel policies? In November, personal savings dropped -64.8% YoY. This marks 20 straight months of declining personal savings.

US M2 Money growth YoY is now … 0%. That is the lowest in US history.

Wow, when The Fed puts its foot on the brakes, …

Jobs And The Inflation Tax: December Jobs Report Add 223K Jobs, But Wage Growth (4.6% YoY) Is Still Lower Than Headline Inflation Rate (7.1%), Avg Weekly Hours Employed Falls To 34.3 (Full-Time Workers -1K; Part-Time Workers +679K)

The December jobs report is out and the top-line number is … 223k jobs were added. That is strong enough to give The Federal Reserve the green light to raise rates.

But while it was a good jobs report, it shows the inflation tax in full view. Hourly wage growth year-over-year (YoY) was 4.6% in December. Unfortunately, the inflation tax was 7.1% in November. If we assume that the inflation rate in December is the same, the REAL hourly wage growth was -2.5% YoY.

But it is likely that headline inflation cooled a bit in December as The Fed continues tightening. But unless headline inflation cooled to 4.6% YoY, the inflation tax is positive and destructive.

The average weekly hours employed fell to 34.3 while U-3 unemployment rate fell.

Here are the rest of the numbers.

The most glaring data point is Full-Time Workers -1K; Part-Time Workers +679K.

And the leading indicator for unemployment is ticking up.

ADP December Report: 235k Jobs Added (Good), But Annual Salary Growth Slows To 7.3% YoY For Job Stayers (Fuel For Fed To Keep Tightening)

December’s ADP jobs report is out and it is a good news. bad news type of report.

First, the good news. 235k jobs were added in December.

Now for the bad news, job stayers saw their annual salary growth fall to 7.3% Year-over-year (YoY).

But while job growth remains good (which will allow The Fed to keep raising rates), the trajectory in the pink box is slowing.

The breakdown from ADP.

How about US Services PMI Business Activity SA? Do I detect a trend??

The Fed’s Dot Plot from December is still pointing to a pivot in 2024.

Devil’s Tower? ISM New Orders Slump To 45.2 In December As ISM Prices Paid Slumps To 39.4 (Stimulus Is Already Gone, Recession In Sight)

To paraphrase The Eagles, US monetary stimulus is already gone.

And with it, ISM Manufacturing Report for December is showing weakness. New orders (orange line) is down to 45.2 (below 50 is contraction) and the prices paid is down to 39.4 (white line). All this is happening as The Fed raises its target rate (yellow line) and removes monetary stimulus (green line).

This gives us “The Devil’s Tower” looking economic spike after massive Covid-related monetary stimulus and Federal government repeated stimulus.

Biden is probably hoping for MORE stimulus, like in Close Encounters of the Wrong Kind.

Speaking of Already Gone, look at the US Treasury 10Y-2Y yield curve with slowing M2 Money growth. Yield curve inversion is more about vanishing M2 Money growth than it is a forecast of recession.

Is The US Economy Already In A Recession? Put/Call Ratio, US Yield Curve And 20 Straight Months Of Negative Wage Growth Say Yes, Real GDP And Unemployment Rate Say No

Today is all quiet of the financial market front since the US stock

Today is all quiet of the financial market front since the US stock and bond markets are closed. But as the new year starts, we have to ask the following question: is the US already in a recession?

Well, if you follow the NBER business cycle tracker, the answer is no. Unfortunately, the NBER only tells us if we are in a recession after it has already happened.

A simple measure of IMPENDING recession is the US yield curve which is currently inverted. Typically, a recession occurs within months of the yield curve inverting. But if we look at real GDP growth, the Atlanta Fed GDP tracker is at 3.7%, so no recession there (two consecutive quarters of negative GDP growth is often used as a measure of recession).

But another indicator of “all is not well” is the CBOE Put/Call Ratio. Typically, the Put/Call Ratio spikes during a recession. But on December 28, 2022, the Put/Call Ratio spiked to its highest level since 1996. Although it has calmed down to 0.84 on December 30, 2022. Suffice it to say that there is enormous uncertainty in markets.

Covid begat massive Fed monetary stimulus and an excuse for the Federal government to go on a series of spending sprees (Covid “relief”, Instrastructure, Inflation Reduction, and now the $1.7 Trillion pork-laden Omnibus bill). Now that historic big spender Nancy Pelosi (CA-D) is no longer Speaker, will her successor have such a voracious spending appetite? The US economy is still benefitting from Covid-related stimulus which also helped generate 40-year highs in inflation.

Thanks to inflation, US workers have had 20 consecutive months of negative wage growth. But as M2 Money growth slows to a halt, so will real average hourly earnings.

The traditional measures of recession (unemployment and Real GDP growth) are NOT pointing to recession, but 20 straight months of negative wage growth points to bad news for workers. Throw in an inverted yield curve and massive volatility in the CBOE Put-Call Ratio and we have a party … that I don’t want to attend.

In other news, the Washington Commanders football team unveilved a new hog mascot. Of course, the Washington Hogs mascot could also apply to the Federal government with their incessant pork-barrel spending. Nancy Pelosi (D-CA) is the honorary hog.

Hey big spenders, spend TRILLIONS on Ukraine and pork barrel projects.

and bond markets are closed. But as the new year starts, we have to ask the following question: is the US already in a recession?

Well, if you follow thme NBER business cycle tracker, the answer is no. Unfortunately, the NBER only tells us if we are in a recession after iti has already happened.

A simple measure of IMPENDING recession is the US yield curve which is currently inverted. Typically, a recession occurs within months of the yield curve inverting. But if we look at real GDP growth, the Atlanta Fed GDP tracker is at 3.7%, so no recession there (two consecutive quarters of negative GDP growth is often used as a measure of recession).

But another indicator of “all is not well” is the CBOE Put/Call Ratio. Typically, the Put/Call Ratio spikes during a recession. But on December 28, 2022, the Put/Call Ratio spiked to its highest level since 1996. Although it has calmed down to 0.84 on December 30, 2022. Suffice it to say that there is enormous uncertainty in markets.

Covid begat massive Fed monetary stimulus and an excuse for the Federal government to go on a series of spending sprees (Covid “relief”, Instrastructure, Inflation Reduction, and now the $1.7 Trillion pork-laden Omnibus bill). Now that historic big spender Nancy Pelosi (CA-D) is no longer Speaker, will her successor have such a voracious spending appetite? The US economy is still benefitting from Covid-related stimulus which also helped generate 40-year highs in inflation.

Thanks to inflation, US workers have had 20 consecutive months of negative wage growth. But as M2 Money growth slows to a halt, so will real average hourly earnings.

The traditional measures of recession (unemployment and Real GDP growth) are NOT pointing to recession, but 20 straight months of negative wage growth points to bad news for workers. Throw in an inverted yield curve and massive volatility in the CBOE Put-Call Ratio and we have a party … that I don’t want to attend.

In other news, the Washington Commanders football team unveilved a new hog mascot. Of course, the Washington Hogs mascot could also apply to the Federal government with their incessant pork-barrel spending. Nancy Pelosi (D-CA) is the honorary hog.

Hey big spenders, spend TRILLIONS on Ukraine and pork barrel projects.

US Housing Leading Growth Index Slumps To Lowest Since 1982 And 2008 Recessions (Fed Pivot Coming?)

As we begin 2023 (and I am still bummed-out over Ohio State University losing a nail-bitter to Georgia in the Peach Bowl), we need to look at the condition of one of the most important sectors of the US economy.\, housing.

If we look at the US Housing Leading Growth index (courtesy of RecessionAlert.com) has slumped to its worst reading since the recessions of 1982 and 2008.

And then we have the OCED leading indicators for the US falling as M2 Money growth slows.

My favorite chart shows US home price growth falling faster than University of Michigan football team’s national championship home hopes.

Will this prompt The Federal Reserve to pivot? Only time will tell.

A Year Of Pain! Investors Struggle In A New Era Of Higher Rates And Goin’ Green, Worst Combined Stock And Bond Returns Since 1871 (Buffet’s Berkshire Hathaway Was UP 4% In 2022, Cathie Wood’s ARK Innovation Was DOWN -67%)

2022 is one of the record books and not in a Tiger Woods way. Call it a year of pain.

First, the US enacted policies that drove up energy prices (goin’ green) that reverberated through the entire economy in the form of higher prices. Second, The Federal Reserve, in attempt to combat runaway inflation, started removing the excessive monetary stimulus that had been around since Fed Chair Bernanke initiated QE, the seemingly unlimited purchase of Treasury and Agency MBS securities. Janet Yellen continued the massive asset purchases and zero interest rate policies or ZIRP. Now that inflation has struck the American middle class hard, we are seeing Fed Chair Powell doing what Bernanke and Yellen wouldn’t do — remove the monetary punchbowl.

Using Robert Shiller’s on line data, US stocks and bonds have had an awful year, the worst combined year since 1871.

US equity returns have been demolished under the NEW dual mandate (goin’ green = rising prices = Fed tightening).

Let’s see how two of the most famous investment gurus did in 2022, Warren Buffet and Cathie Wood. Buffet’s Bershire Hathaway Class A equity was UP 4% in 2022, while Cathie Wood’s ARK Innovation ETF collapsed by -67% in 2022.

Here is the clinker. The US economy (as well as the global economy) seem dependent on “cheap money” from Central Banks like The Federal Reserve. So the question is … will The Fed pivot? Fed talking heads are saying no, but Fed Funds investors are saying yes to a pivot after June 2023.

Ulysses S Grant was the President the last time the combined stock and bond market was this bad.

Eggs Prices Up 79% Since Feb 28, 2022 (Fed Pneumonia And The Avian Flu)

US consumers have the Fed Pneumonia and The Avian Flu.

As a diabetic, eggs are a perfect food. Unfortunately for me and other diabetics, the price of eggs has soared by a whopping 79% since February 28, 2022.

Of course, this year’s deadly Avian flu has been reducing poultry flocks. Also, fertilizer prices have soared as well. Also, soaring inflation has resulted in an aggressive Federal Reserve hiking their target rates.