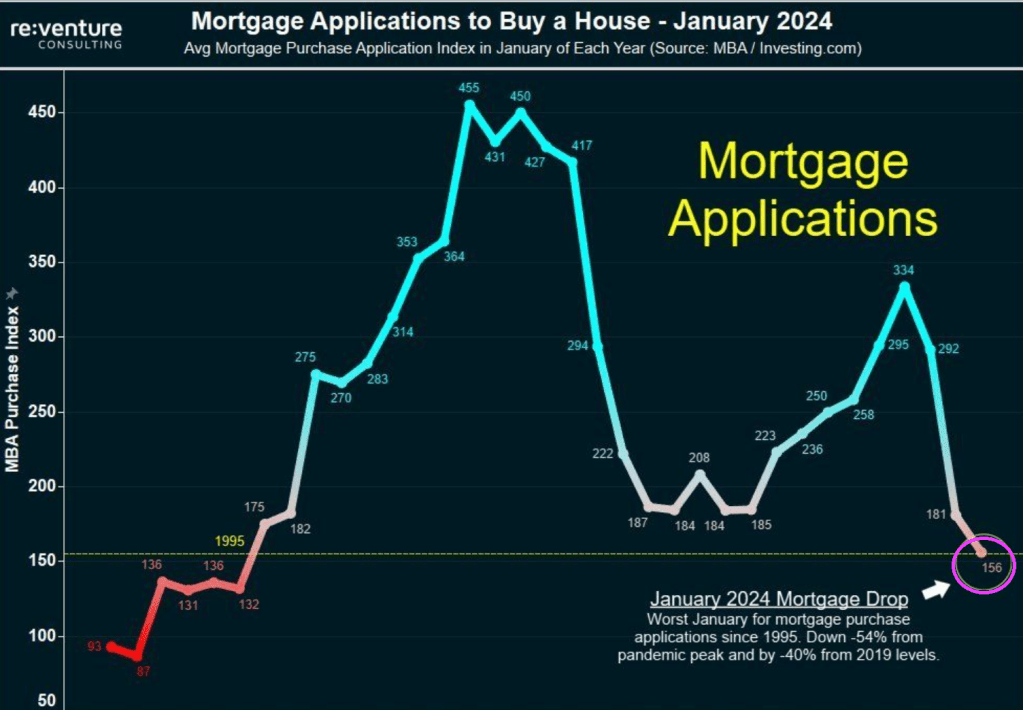
Yikes! Bidenomics is a disaster! MBA mortgage purchase applications are down 54% from Pandemic Peak. I was going to play “The Wreck of the Edmund Fitzgerald” by Gordon Lightfoot and rename it “The Wreck of The US Economy.”
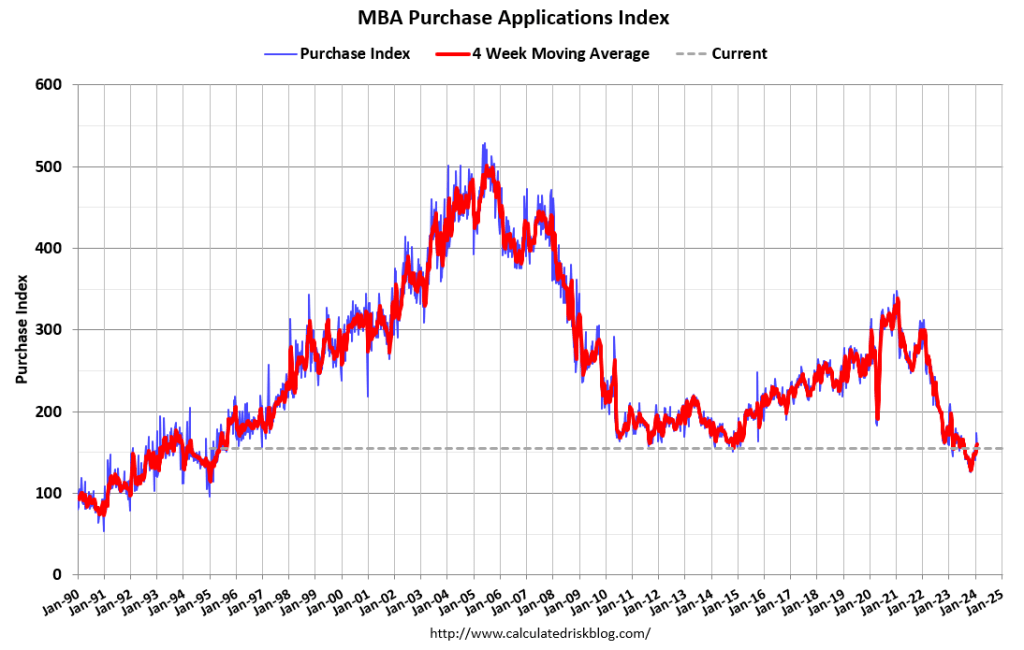
Mortgage demand fell to a new 30-year low in January 2024, down 54% from the pandemic peak. Mortgage demand is down 14% over the last year and 40% from pre-pandemic levels.
Mortgage applications decreased 7.2 percent from one week earlier, according to data from the Mortgage Bankers Association’s (MBA) Weekly Mortgage Applications Survey for the week ending January 26, 2024. Last week’s results included an adjustment to account for the MLK holiday.
The Market Composite Index, a measure of mortgage loan application volume, decreased 7.2 percent on a seasonally adjusted basis from one week earlier. On an unadjusted basis, the Index increased 8 percent compared with the previous week. The Refinance Index increased 2 percent from the previous week and was 3 percent higher than the same week one year ago. The seasonally adjusted Purchase Index decreased 11 percent from one week earlier. The unadjusted Purchase Index increased 6 percent compared with the previous week and was 20 percent lower than the same week one year ago.
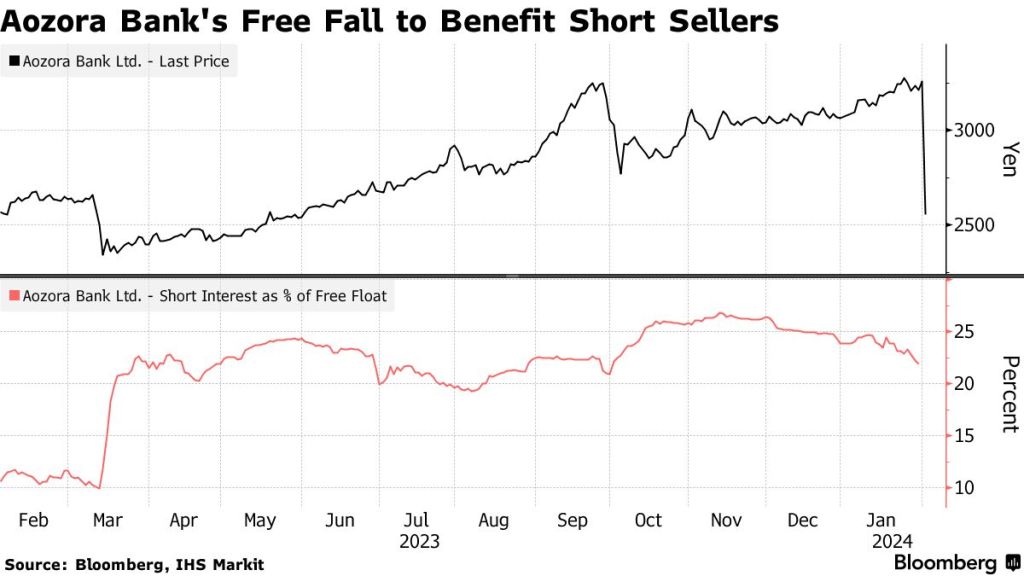
Like rows of falling dominoes, Aozora Bank, the 16th largest in Japan by market value, saw its shares plunge by 20% on Thursday after reporting a net loss of 28 billion yen ($191 million) for the fiscal year. This was in stark contrast to its earlier projection of a 24 billion yen profit.
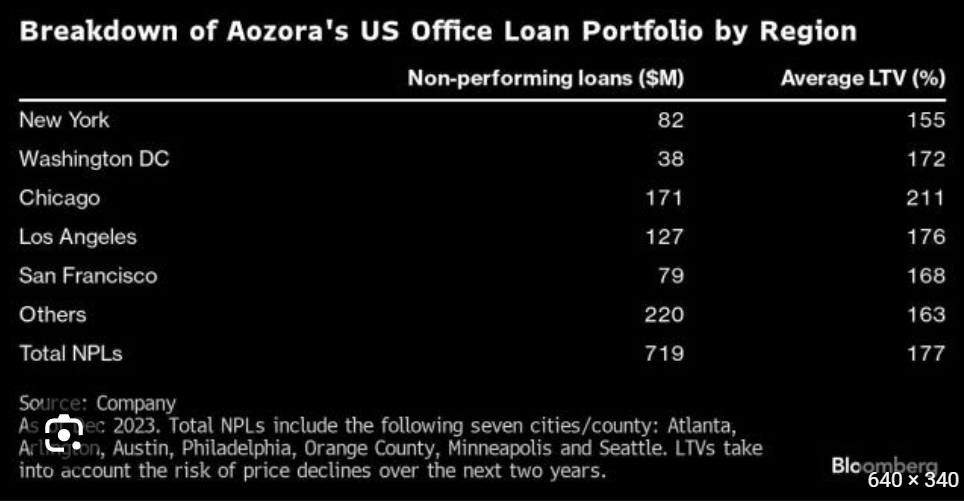
Aozora wrote down the value of its non-performing office loans by 58%, including a 63% reduction in Chicago and between 51% and 59% in New York, Washington D.C., Los Angeles, and San Francisco – all of these cities are plagued with violent crime and controlled by radical Democrats.
In total, the bank’s US office loans were about 6.6% of its portfolio, or approximately $1.89 billion. It said 21 office loans worth $719 million were classified as non-performing, and as a result it increased its loan-loss reserve ratio on US offices to 18.8% from 9.1%.
“It’s a shock,” said Tomoichiro Kubota, a senior market analyst at Matsui Securities Co., adding, “The expectation was the worst was over and that the bank had set aside enough provisions.” Guess not.
Far markets, this was another flashing red warning sign that not only is a tsunami of office loan defaults still on the horizon, but that banks continue to be woefully underprovisioned for the coming bloodbath.
“This is a huge issue that the market has to reckon with,” said Harold Bordwin, a principal at Keen-Summit Capital Partners LLC in New York, specializing in renegotiating distressed properties.
Bordwin said, “Banks’ balance sheets aren’t accounting for the fact that there’s lots of real estate on there that’s not going to pay off at maturity.”
Besides New York Community Bancorp and Aozora Bank, Deutsche Bank noted in fourth-quarter results:
“Interest rate environment remains key driver for refinancing risk and potential [credit-loss provisions] in 2024 especially in office, with further drivers being ongoing sponsor support and expiring rental agreements.”
Fed chair Powell delivered bad news for the CRE world in yesterday’s FOMC meeting, warning that a March rate cut isn’t happening (absent a shock of course). Perhaps most notably, the Fed removed the following sentence from the FOMC statement: “The US banking system is sound and resilient.” Cynics asked why the Fed no longer sees “the US banking system is sound and resilient” – is it a signal of rumblings in the economy near-term, or was it just a lie before, and now that bank dominoes are again falling, will Powell be forced to trot it back out?
Where will this lead? Likely more bank and pension fund bailouts. You didn’t really believe that hype about the Dodd-Frank banking legislation that there will never be another bank bailout did, you??
Constitution Avenue in Washington DC is actually becoming Tobacco Road. No, not the dysfunctional family of Georgia sharecroppers during the Great Depression, but the Treasury Borrowing Advisory Committee (TBAC).
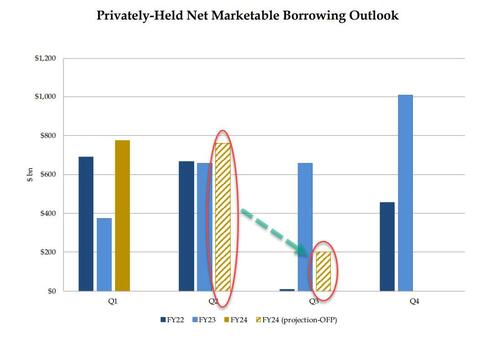
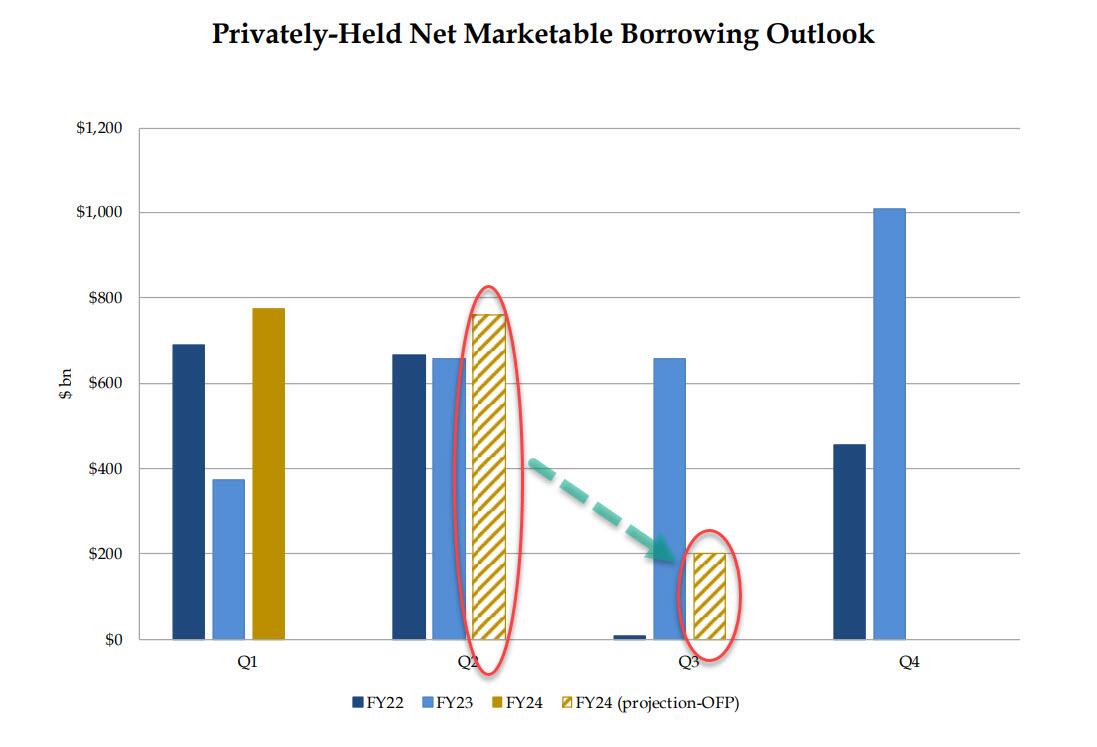
… yields tumbled as this was viewed as an aggressively dovish outlook on the future of i) the US fiscal deficit and ii) the debt needed to fund said deficit. Here is another way of visualizing the US historical and projected marketable debt funding needs:
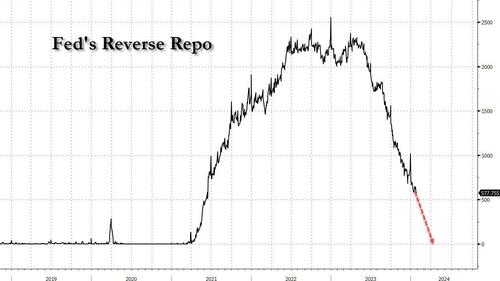
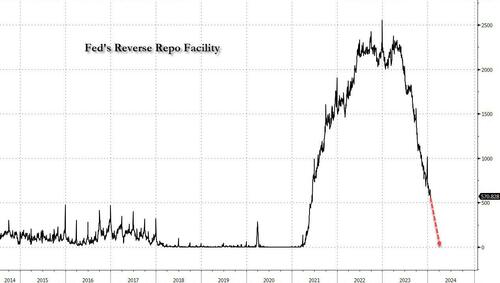
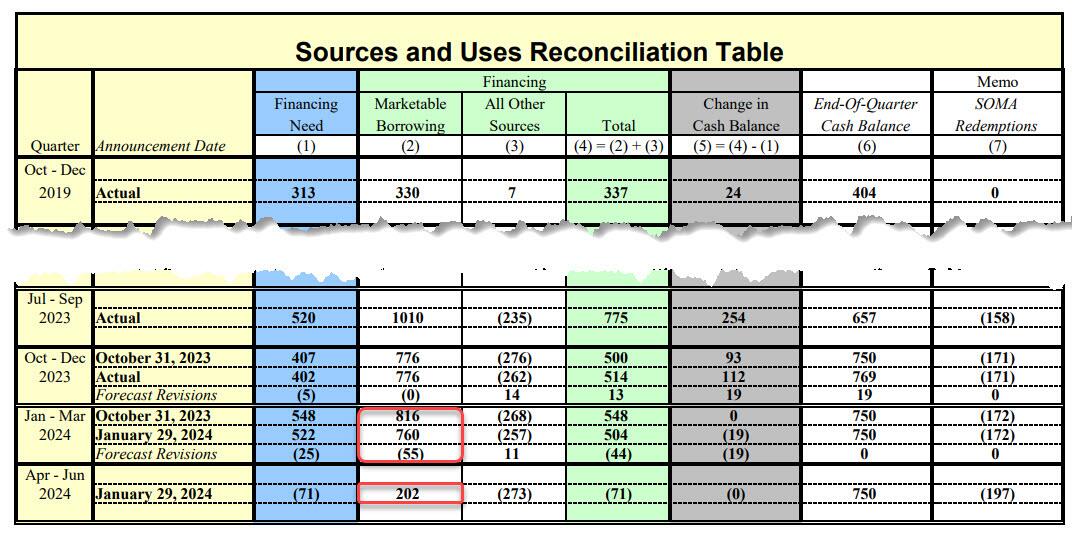
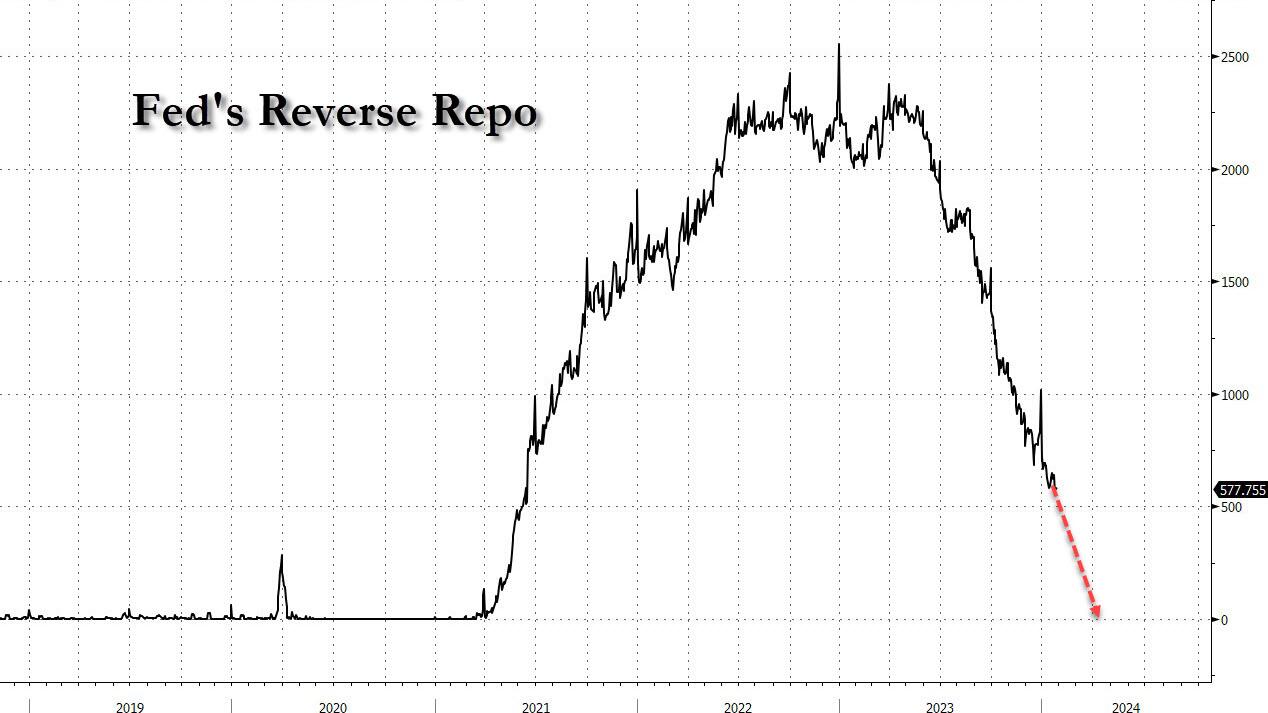
Commenting on this surprise drop in expected borrowing, on Monday we said that “the numbers also mean that the Reverse Repo facility will be fully drained by Q2, and we expect that on Wednesday we will learn that the bulk of the reduction in Q1 and Q2 estimates will be due to sharply lower Bill issuance for one simple reason: there is just no more Reverse Repo cash to buy it all.“
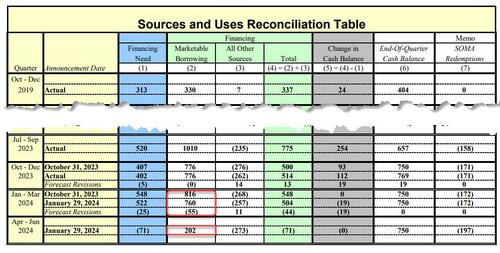
Boy, were we right: earlier today, in the Treasury’s presentation to the Treasury Borrowing Advisory Committee (TBAC) as part of the Quarterly Refunding, Janet Yellen revealed what the composition of this sharp drop in Q2 funding needs would be. As we expected, it was all bills!
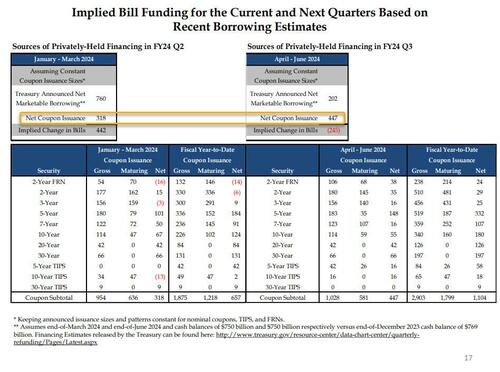
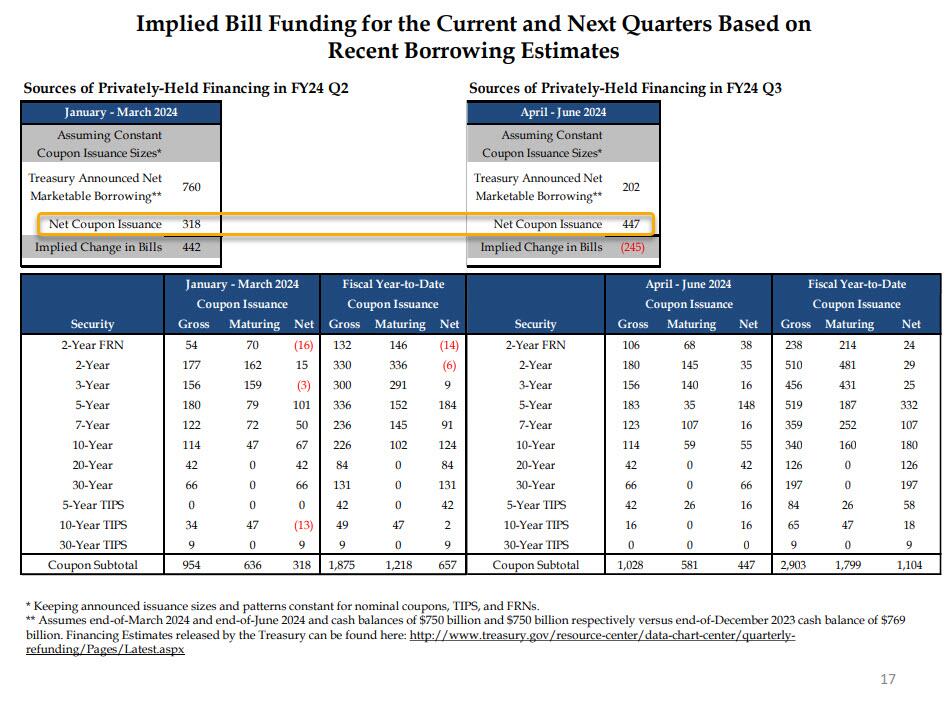
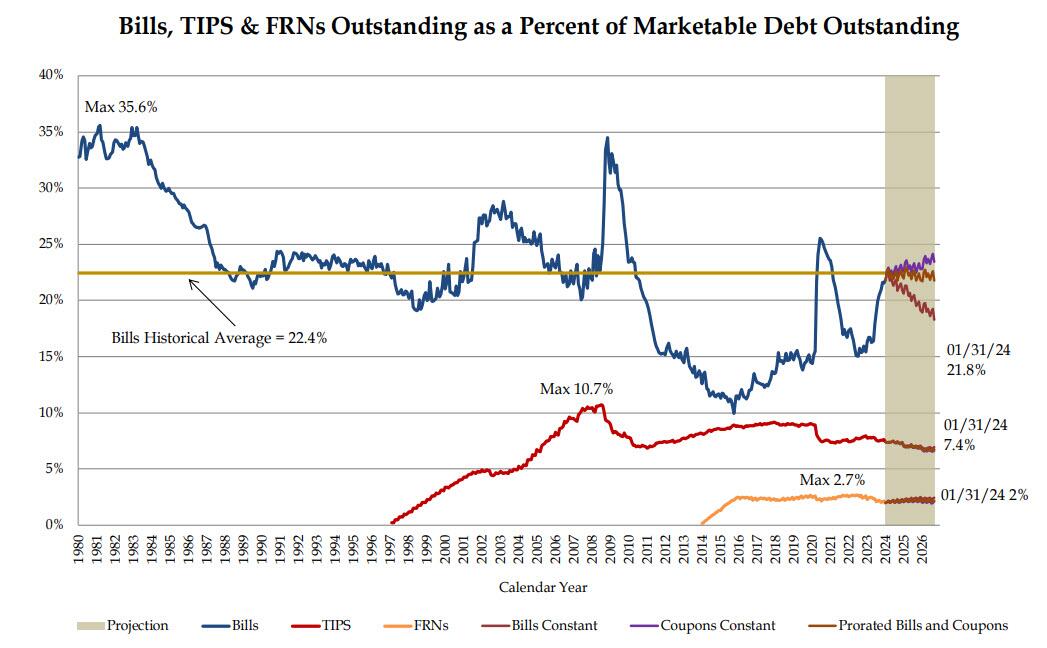
In fact, as the chart below – which we have dubbed the scariest chart in the Treasury’s presentation to TBAC today (link here) – shows, with Bills expected to fund some $442 Billion of the $760BN funding deficit in the Jan-March quarter (the balance of $318BN funded by coupons), in Q2 the Treasury now anticipates a $245BN DECLINE in net Bills outstanding (i.e., not only no incremental Bill funding but a quarter trillion maturity in Bills outstanding). In other words, while we expected a “sharply lower” Bill issuance in Q2, the Treasury is actually expecting a $245BN drawdown in Bills.
But wait, there’s more: because while the market was expecting some pro rata decline in coupon issuance to go with the slide in net Bills (we were not) in Q2 to justify the sharp drop in long-end yields, it was not meant to be. In fact, just the opposite, because as highlighted in the chart above, net Coupon issuance in Q2 is actually expected to increase by $130BN to $447BN from $318BN in Q1. This is a huge shift in higher duration supply, and is hardly what all those who were buying 10Y bonds on Monday were expecting, and yes, that too was to be expected: with Bills now well above the “comfortable” ceiling of 20% as a percentage of total debt outstanding, the Treasury had no choice but to roll it back, especially since the Reverse Repo is already mostly drained. And sure enough, in its presentation, the Treasury no longer anticipates a flood of Bill issuance in the future.
That’s not all: while the Treasury said it does “not anticipate needing to make any further increases in nominal coupon or FRN auction sizes, beyond those being announced today, for at least the next several quarters”, the TBAC politely disagreed, stating that “it may be appropriate over time to consider incremental increases in coupon issuance depending on how the current uncertainty regarding borrowing needs evolves” (translation: as the need to bribe the population with more fiscal stimmies ahead of November rises, so will borrowing needs).
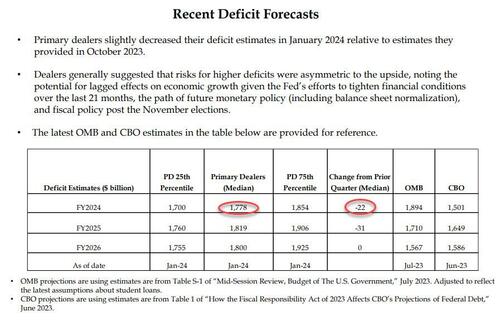
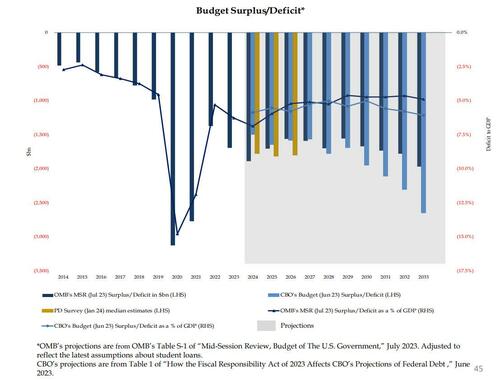
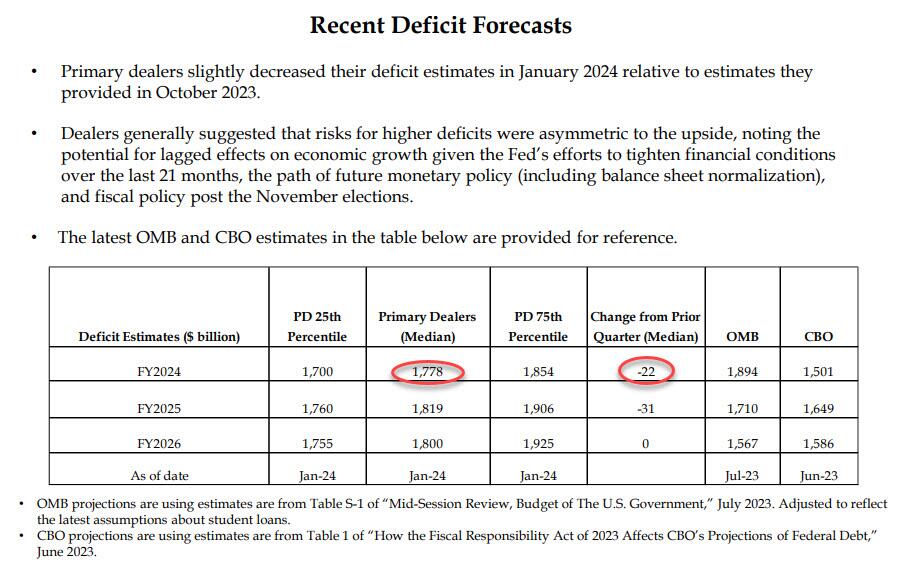
As for any naive expectations that any decline in issuance in structural instead of merely shifting away from Bills to Coupons, we have some more bad news: as the table below confirms, the Primary Dealer estimate of the US 2024 budget deficit dropped just $22BN in the past quarter, from $1.8 trillion to $1.778 trillion, a meaningless change (expect this number to rise sharply as the full brunt of fiscal stimulus in an election year become visible).
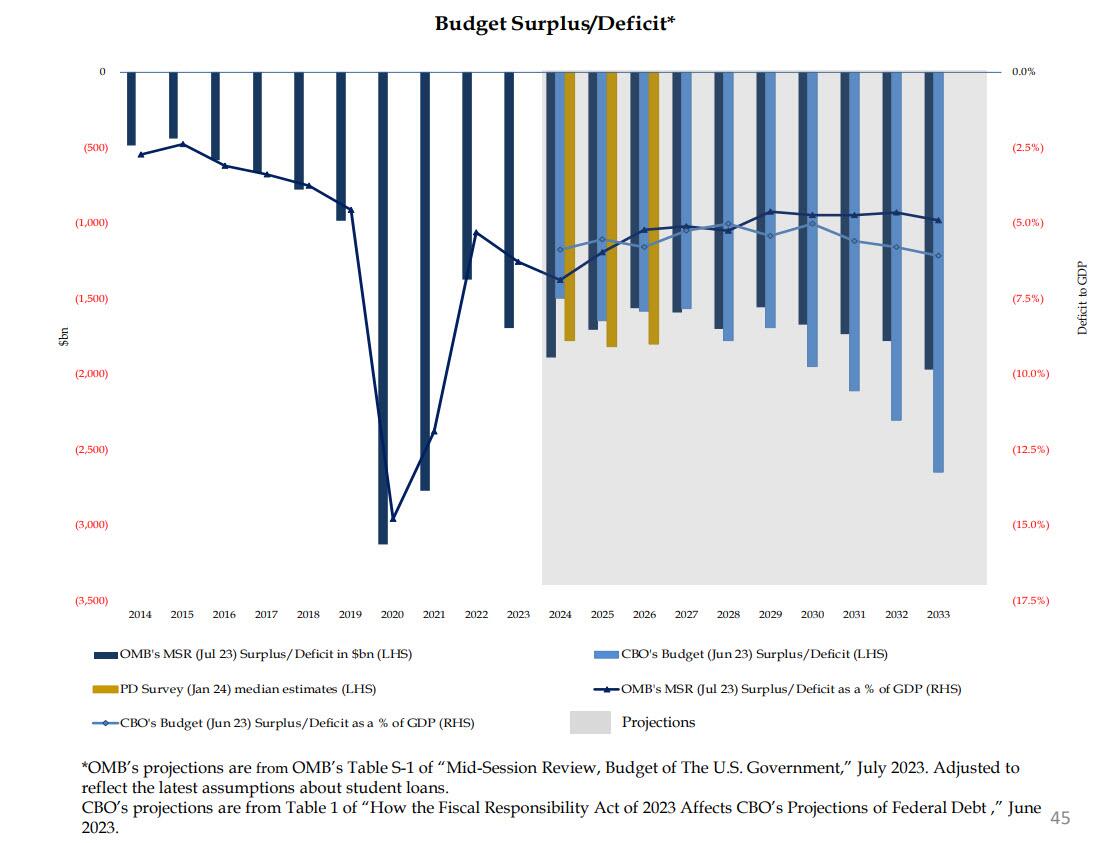
As for the bigger picture, well you can listen to either the Primary Dealers…
… or the CBO:
Both reach the same sad conclusion, the same one voiced by Nassim Taleb on Monday when he said that “we need something to come in from the outside, or maybe some kind of miracle…. This makes me kind of gloomy about the entire political system in the Western world.”
Sorry, Nassim, no miracles… just lots and lots of money printing coming.
And speaking of money printing, the fact that Bill issuance is about to grind to a halt in Q2 means that, just as we expected, reverse repo balances will tumble in the remaining two months of Q1…
… bringing it effectively to zero (which means the Treasury’s stock market liquidity pump is now almost drained), at which point the Fed will have to take over and taper QT as the alternative would be draining some $100BN in reserves every month at a time when total Fed reserves are already at the level which Waller hinted may be the infamous LoLCR floor which is a hard constraint at “10-11% of GDP.” The alternative is simple: a stock market crash just months before the November election, hardly the stuff Biden’s handlers or the anti-Trump Deep State would approve of.
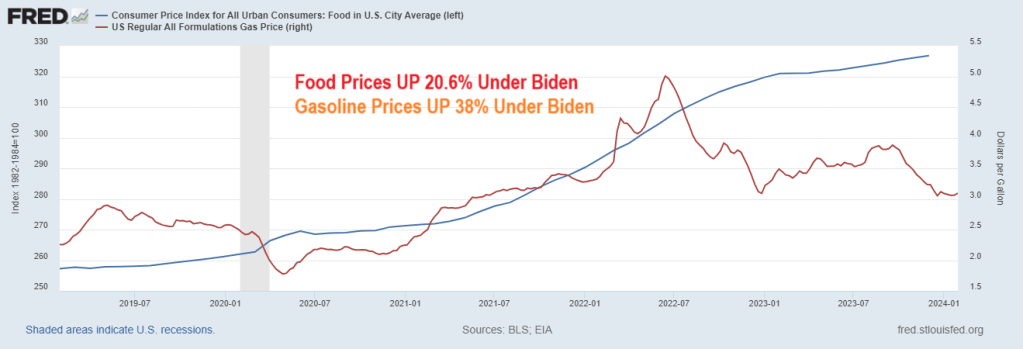
Treasury Secretary Janet Yellen just admitted what the rest of Americans already knew: high prices are here to stay. Example? Food prices (CPI) are up over 20% under Inflation Joe while gasoline prices are up 38% under Clueless Joe.
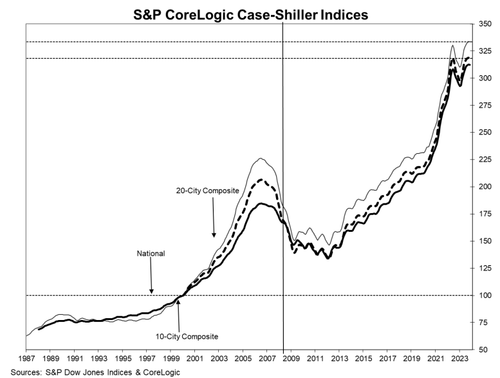
On the housing front, the Case-Shiller National Home Price Index is up 33.2% under Biden. And Freddie Mac’s 3-year mortgage rate is up 154% under Biden’s leadership (c’mon man! Obama is pulling the strings on Puppet Joe).
For months officials in the Biden administration have falsely claimed prices on everyday goods and services were going down. In reality, they’re getting more expensive at a slower pace.
During a briefing at the White House last week, Press Secretary Karine Jean Pierre had trouble explaining complaints from Biden when he purchased a smoothie that cost $6.
“Last Friday, the president was at a coffee shop in Pennsylvania, and he seemed to be surprised that the smoothie was $6 and how expensive it was,” a reporter asked. “I’m curious. So is the president now realizing the costs that Americans are bearing?”
“So, look, when he went over to you all, to the press corps, he was having a good time, right? And offered, as you know, offered to buy them coffee,” Jean Pierre responded. “There was a big group there, and he made sure everyone got coffee and pastries. So I just want to make that really clear.”
That is wonderful, KJP! The White House Press Corps got free coffee and pastries! Yippee!!!
But the rest of us in America are suffering from Bidenomics and inflation. Like food prices having risen 21% under Biden, gasoline prices UP 38%, home prices UP 33.2% and mortgage rates UP 154%.
A Blackstone-owned Manhattan office tower with a $308 million mortgage is being marketed at a discounted rate of $150 million, representing a 50% reduction. The special servicer, Midland Loan Services, has enlisted Jones Lang LaSalle Inc. to facilitate the sale of the tower at 1740 Broadway. The bundled debt, included in a commercial mortgage-backed security, is marked with a 50% discount. In April, the tower was appraised at $175 million, a substantial 71% decline from its $605 million valuation in 2014 when the mortgage originated.
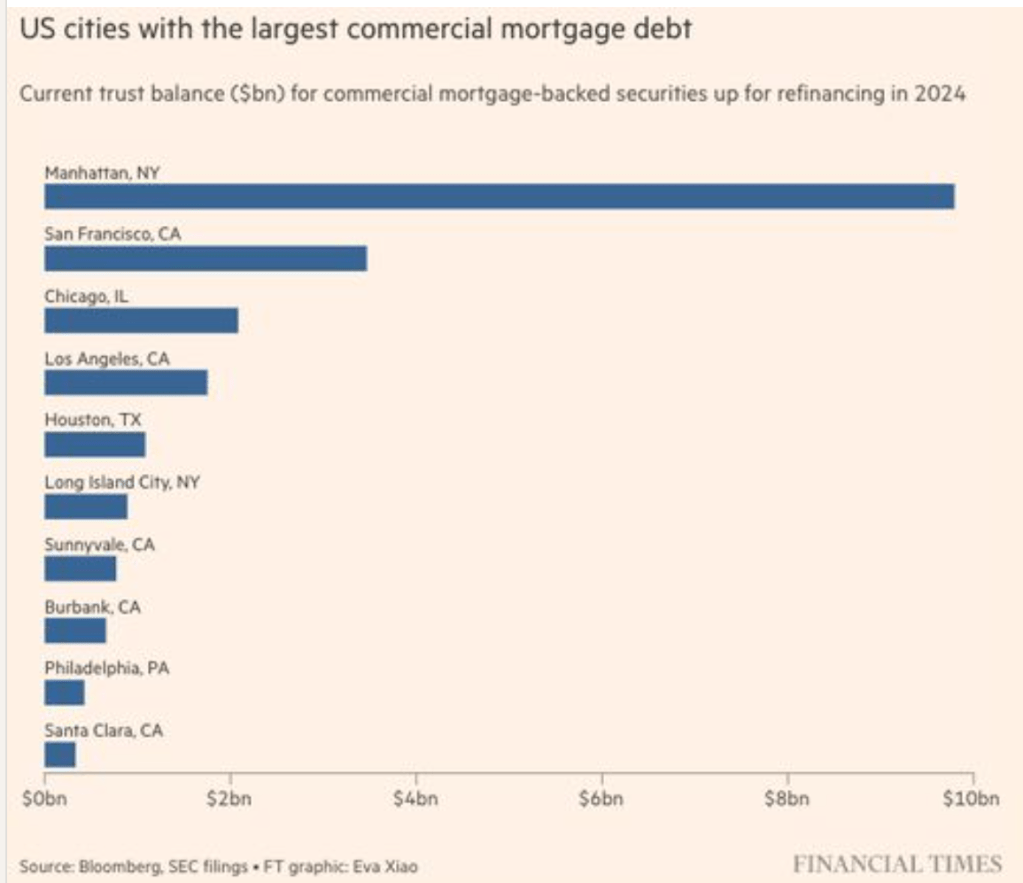
To put this into perspective, a new report by the Mortgage Bankers Association data, shows $117 billion in CRE office debt needs to be repaid or refinanced this year. Much of this debt is concentrated in major cities such as Manhattan, San Francisco, Chicago, and Los Angeles.
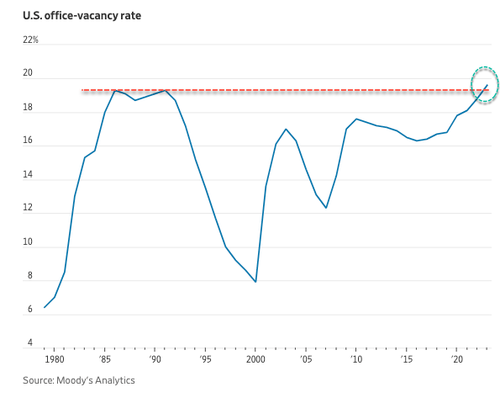
Compounding (or CONFOUNDING) the problem is the near 20% office vacancy rate.
Here is Fed Chair Jerome Powell who replaced now Treasury Secretary Janet Yellen.
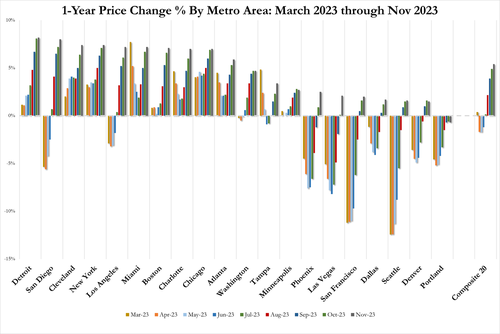
Home prices in America’s 20 largest cities rose for the 10th straight month in November (the latest data released by S&P Global Case-Shiller today), up 0.15% MoM (considerably slower than the 0.50% MoM expected and 0.63% prior).
That is the weakest MoM rise since Jan 2023.
Source: Bloomberg
That pushed the YoY price up to +5.40% (but well below the +5.8% exp)…
“November’s year-over-year gain saw the largest growth in U.S. home prices in 2023, with our National Composite rising 5.1% and the 10-city index rising 6.2%,” says Brian D. Luke, Head of Commodities, Real & Digital Assets at S&P DJI.
Six cities registered a new all-time high price in November – Miami, Tampa, Atlanta, Charlotte, New York, and Cleveland.
Portland is the only city with prices dropping YoY – who could have seen that coming?
Is this really what Jay and his pals were expecting when they embarked on an unprecedented tightening of monetary policy?
But, judging by the resumption of the rise of mortgage rates since the Case-Shiller data was created, we would expect prices to also resume their decline in the short-term…
Are prices set to shrink again (as the lag on Case-Shiller data and human’s response to rates) before re-accelerating later this year?
Yes, Cleveland hit an all-time high despite getting demolished by the Houston Texans in the wildcard game.
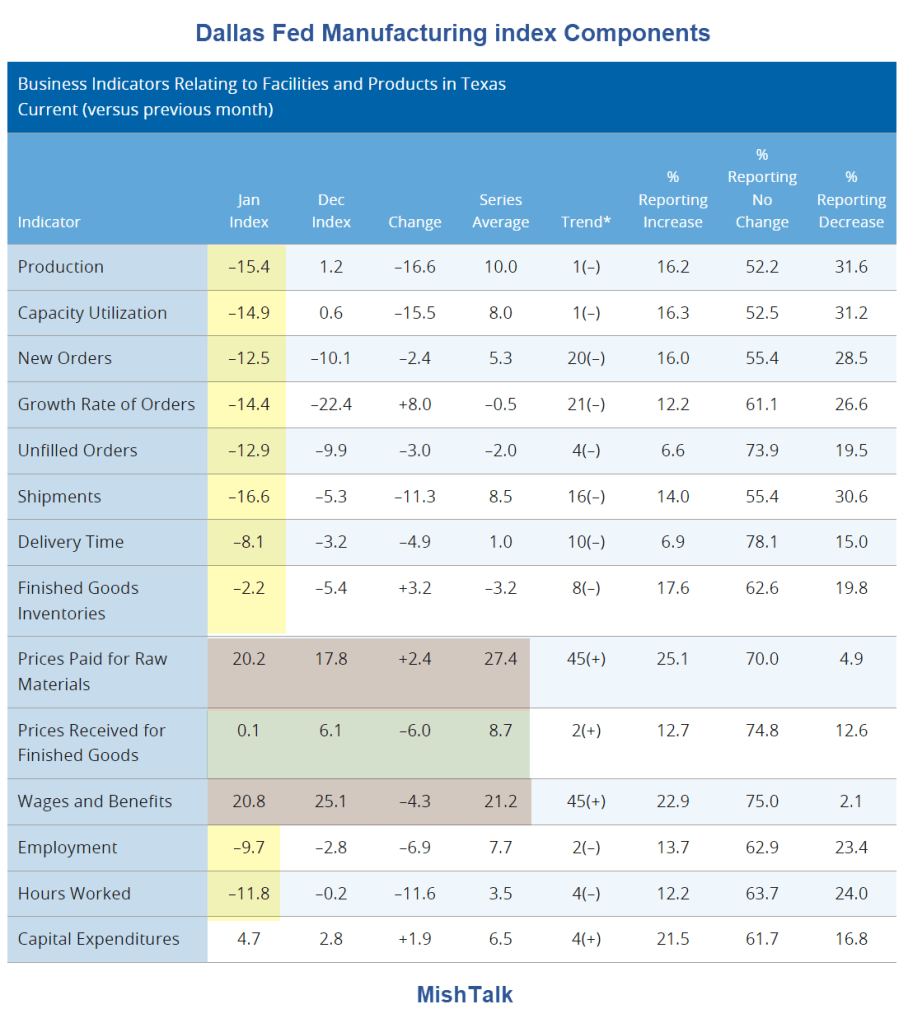
Other measures of manufacturing activity also indicated contraction this month. The new orders index ticked down from -10.1 to -12.5 in January, while the growth rate of orders index remained negative but pushed up eight points to -14.4. The capacity utilization index dropped to a multiyear low of -14.9, and the shipments index slipped 11 points to -16.6.
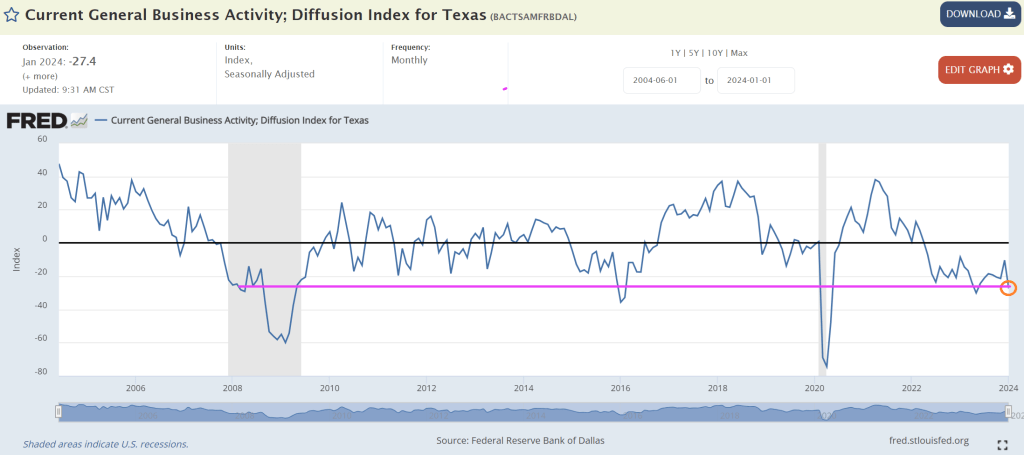
Perceptions of broader business conditions continued to worsen in January. The general business activity index fell from -10.4 to -27.4, and the company outlook index fell from -9.4 to -18.2. The outlook uncertainty index held fairly steady at 20.9.
Note that prices paid for raw materials soared by 20.2%.
Meanwhile, The Fed is impressed by the growth in the economy (primarily government jobs) so will likely keep rates constant this week. I wish they would look at Texas slumping!
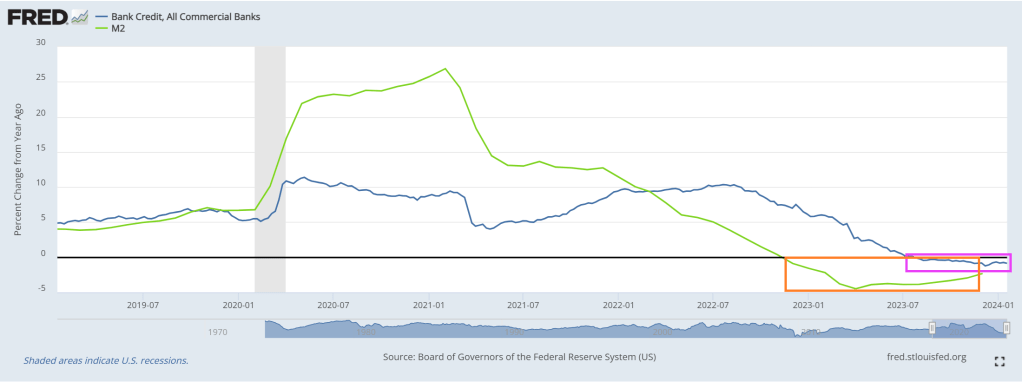
Where do we sit today? Bank credit growth has been negative for the last 26 weeks. As M2 Money growth has stalled.
What will The Fed do?
While the FOMC may start the discussions around tapering QT as soon as at this meeting, tapering itself is still a ways off, and the actual end of QT will come early next year.
In January and May 2022, the FOMC published the principles and then the plan for QT. The fact of a taper this year is not news. More recent communication from Fed officials (for example from President Logan and Governor Waller) reinforced a preference for the reverse repo (RRP) facility to be drawn down to zero, and we infer that getting the RRP near zero will be the starting point for the taper.
Historically, the FOMC has taken at least two meetings to finalize these types of plan, and the December minutes stressed a desire to give the market lots of advance notice. As a baseline, we think the FOMC announces the parameters for the QT taper at its May meeting and enacts that taper in June, by cutting the runoff of Treasury securities in half. Because the Fed’s RRP facility has been declining rapidly, that timing could shift earlier by a month or so.
The change to shedding $30 billion per month in Treasuries would slow the pace of runoff materially, but there is clearly a chance that the subsequent pace is even slower. President Logan pointed out that running off the balance sheet slowly could ultimately allow the Fed to shrink the balance sheet even more while mitigating the risk of money market disruptions. A June taper would be consistent with our house view on the path of the RRP facility, which we expect to stand at approximately $225 billion at the end of May and be depleted by August.
We anticipate that reserves will remain broadly around current levels until RRP is depleted. But from there, we think reserves will ultimately fall to roughly $3.2 trillion, around $300 billion below current levels, and the FOMC will call off QT in early 2025. That view on the ending level of reserves reflects our outlook on the SOFR – IORB (Secured Overnight Funding Rate – Interest on Reserve Balances) spread turning positive, indicating the end of abundant reserves.
For broader markets, however, our strategy team does not expect the tapering and end of QT to be a significant event. Our rates strategists think the phenomenon is mostly in the price and, if anything, front-end swap spreads may have already overreacted to the news of an early taper. With a limited effect on rates, and the tapering and end of QT largely anticipated, our MBS and credit strategists similarly see few if any implications. Of course, some market narrative is focused on QT’s effects on the banking sector. While the intuitive notion that QT must destroy deposits is widespread, we have highlighted the data which show in fact that deposits have edged up, not down, in recent months as QT has progressed. Banks can always choose to bid for wholesale deposits, so instead of focusing on the quantity of “money” and how that changes, a better question is how bank funding costs are evolving.
So, the next step is for the Fed to shift from “talking about talking about tapering QT” to actually talking about tapering QT. Only after that step will we start to look for the end of QT, which the Fed will determine with an eye on money market conditions. In particular, the Fed is looking at whether SOFR is trading below the rate the Fed pays on reserves, in which case it will likely judge conditions to be accommodative, or above the rate the Fed pays on reserves, in which case the Fed’s calculus will change and the discussions about the end of QT will pick up steam.
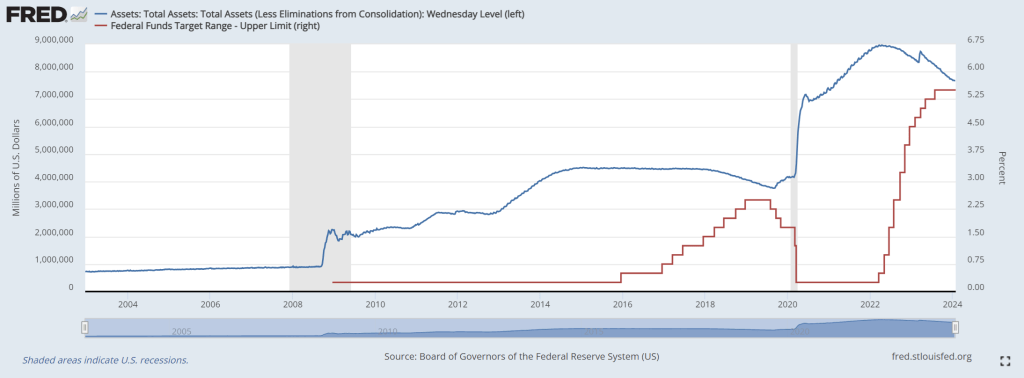
The Fed’s balance sheet remains greatly expanded despite the increase in The Fed’s target rate. Nothing has been the same since the banking crisis of 2008-2009. And Covid in 2020.
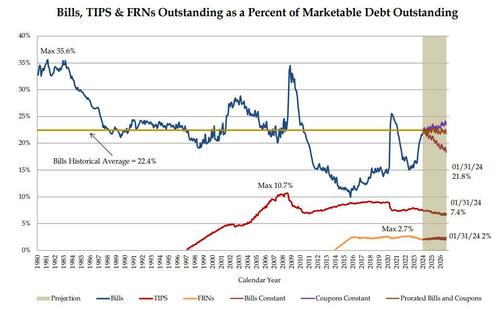
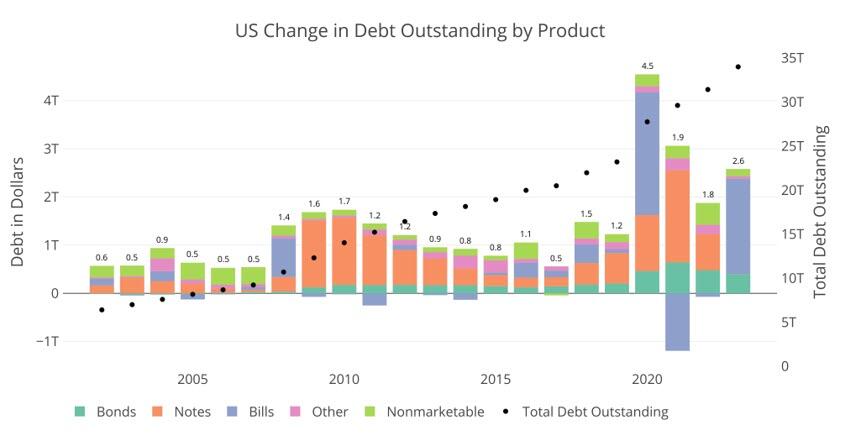
The only other times Bills were used as a primary funding source was in 2008 during the Great Financial Crisis and 2020 during Covid. Neither year came close to 77% of total new debt issuance. These were also emergency times, and specifically in 2021, almost half the short-term debt was retired in favor of Notes and Bonds to undo the 2020 Bill issuance.
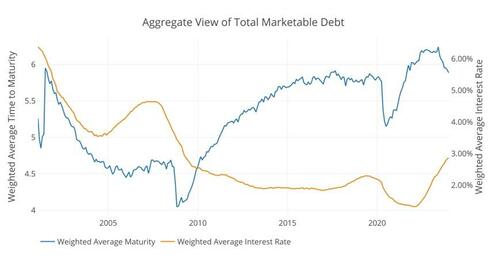
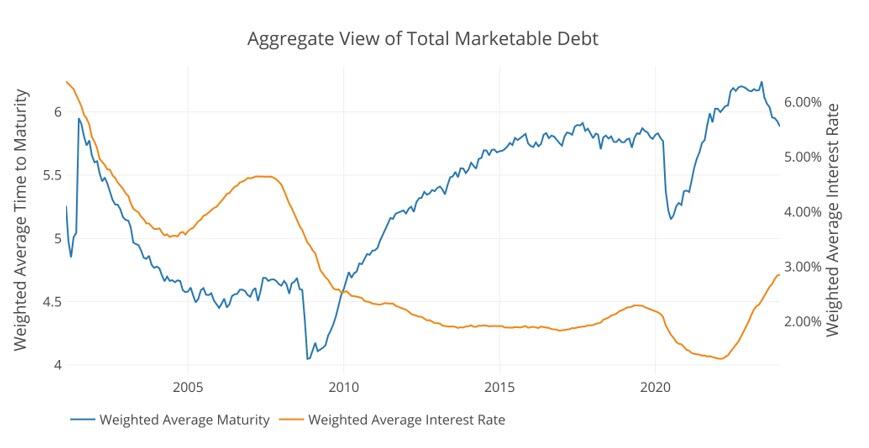
The Treasury has spent nearly two decades trying to extend the maturity of the debt. This can be seen in the blue line below that shows the average debt maturity. When the short term debt is issued in such a way, it drives down the average maturity, which causes the Treasury to have to roll-over more debt in shorter time periods. So why has the Treasury all of a sudden gone entirely to short-term debt in non-emergency times? The answer lies in the orange line, so let’s dig in.
Figure: 2 Weighted Averages
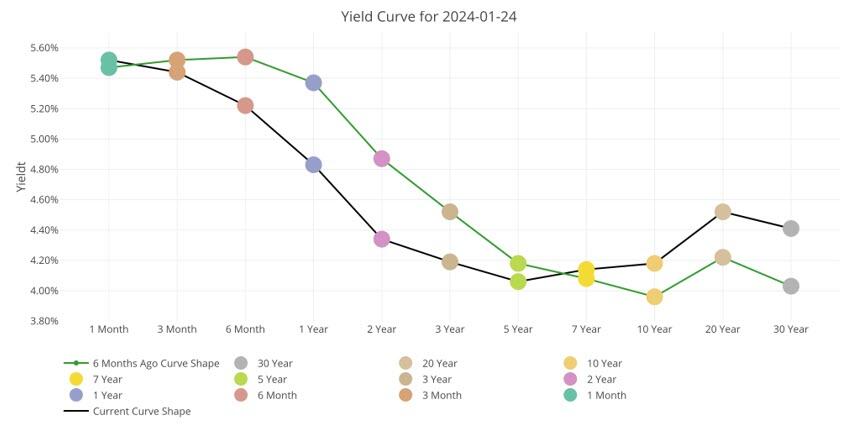
First, it is important to understand the interest rates the Treasury is facing. The chart below shows the current yield curve as it stands today and 6 months ago. As you can see, short-term rates are a full 1%-1.5% higher than medium-term. What?!? Didn’t we just see that the Treasury has specifically targeted short-term debt?
Why are they paying more than they have to? Had the Treasury financed the $2T with Notes, they would have saved $30B in interest this year alone!
Figure: 3 Tracking Yield Curve Inversion
So, why have they done this? Well, there are two potential possibilities.
First, they may be nervous about the market’s ability to handle so much medium-term debt. The market typically digests short-term debt very easily, but it can become saturated with medium-term debt. The chart below shows the amount of medium-term debt that rolled over last year. This is not new issuance; this is debt maturing that needs to be rolled over.
As shown, nearly $2T rolled over last year. This means, had the Treasury issued Notes instead of Bills, the Market would have had to absorb a whopping $4T in new medium-term debt like they did in 2020. The difference this year is that back in 2020 the Fed bought nearly all of that debt, putting a floor under the market.
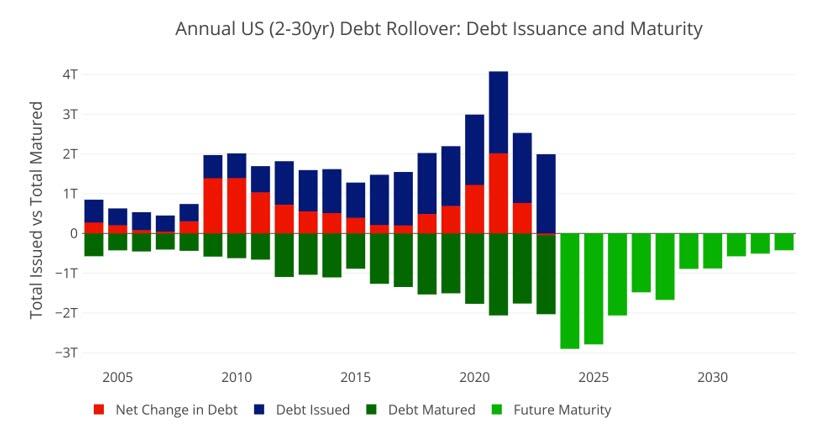
Compounding this problem further is that this year is set to be a record year in terms of debt rollover. Nearly $2.9T in Notes need to be rolled over.
Figure: 4 Treasury Rollover
Still, even with that massive amount of debt issuance, there must be more to the story. Why would Yellen specifically pay $30B more in interest just because she is concerned the about the volume of debt issuance. As Figure 1 above shows, this has never been a concern in the past except in emergency situations. Furthermore, why not issue at least some new debt as medium-term.
This lends to a second, and more probable conclusion. Long-term rates are set to fall in the very near term. The Treasury did not want to lock in for 2-7 years at 4% if it knows rates will fall. It will pay a premium ($30B this year), if it means it can lock in lower rates for longer and save the money on the back end.
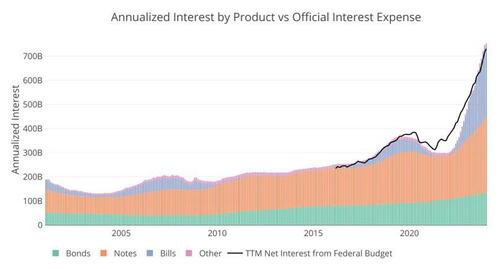
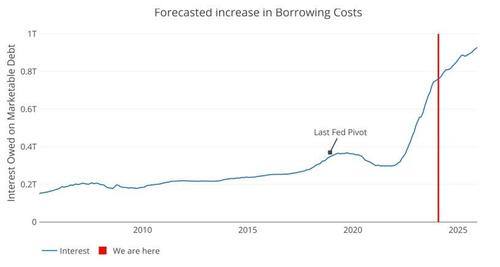
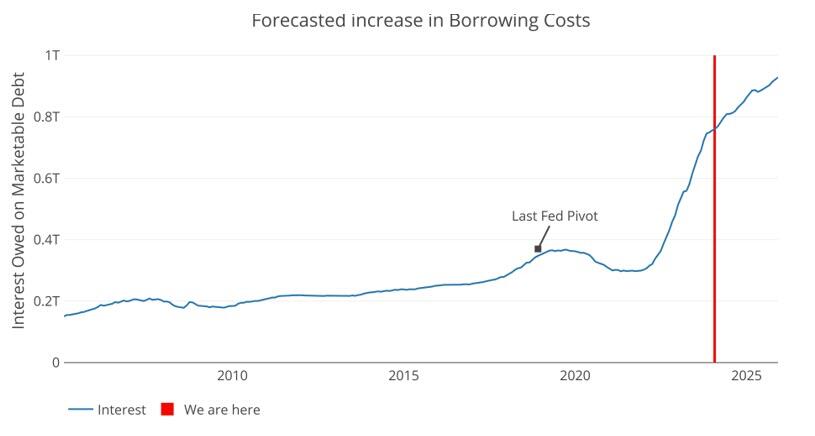
So, why are long-term rates, going to fall? Because they have to… the chart below shows the current interest owed on the national debt annualized. It’s not a pretty picture, and you can see how the interest from Bills has absolutely ballooned.
Figure: 5 Net Interest Expense
The Fed has come out with their dot plot that shows a calm glide path down. Well, we can take the debt maturity and push it forward at the projected rate of the Fed. Even given the current proposed 6 rate cuts, and getting back to 3.5% by early 2025, the trajectory for interest expense is not looking good.
Given current projections by the Fed, the Treasury will owe over $900B on interest by 2025. That is a debt death spiral. The Fed had to pivot back in 2018 when interest expense neared $400B. Next year, the cost will be more than double that!
Figure: 6 Projected Net Interest Expense
There is a potential third option. It’s an election year. Maybe Yellen is doing everything and anything to keep the financial system running smoothly. She has decided that the Treasury market must remain 100% stable and wants to take no chances. Thus, she issues tons of short-term debt, costing the tax payer an extra $30B this year and decides it’s a problem to be fixed at a later date.
While this would be wildly irresponsible and corrupt, the real argument against possibility 3 is the same as possibility 1, the market should be able to ingest at least some medium-term debt. This means the only logical conclusion is that she knows rates are coming down hard and fast. How does she know? Well, she used to be the head of the Fed.
There is no doubt, everyone in Washington can do the simple math above and recognize the Fed cannot take a glide path down. The only option is for rates to come down. Yellen just bet $2T on that outcome.


You must be logged in to post a comment.