And with it, ISM Manufacturing Report for December is showing weakness. New orders (orange line) is down to 45.2 (below 50 is contraction) and the prices paid is down to 39.4 (white line). All this is happening as The Fed raises its target rate (yellow line) and removes monetary stimulus (green line).
This gives us “The Devil’s Tower” looking economic spike after massive Covid-related monetary stimulus and Federal government repeated stimulus.
Speaking of Already Gone, look at the US Treasury 10Y-2Y yield curve with slowing M2 Money growth. Yield curve inversion is more about vanishing M2 Money growth than it is a forecast of recession.
First, banks are stashing cash with the New York Fed on an “overnight basis” although it is looking pretty permanent to me. Repos (or repuchase agreements) soared to $2.55 TRILLION as of 12/30/22.
But this morning we see the US Treasury 10-year plummeting -15 basis points. As I used to tell my University of Chicago, Ohio State and George Mason finance students, any 10 basis point shift (plus or minus) is a big deal. Something is happening.
The 10-year Treasury yield plunging -15 bps is a “good thing” for the mortgage market in that US mortgage rates will likely follow suit and fall.
Today is all quiet of the financial market front since the US stock
Today is all quiet of the financial market front since the US stock and bond markets are closed. But as the new year starts, we have to ask the following question: is the US already in a recession?
A simple measure of IMPENDING recession is the US yield curve which is currently inverted. Typically, a recession occurs within months of the yield curve inverting. But if we look at real GDP growth, the Atlanta Fed GDP tracker is at 3.7%, so no recession there (two consecutive quarters of negative GDP growth is often used as a measure of recession).
But another indicator of “all is not well” is the CBOE Put/Call Ratio. Typically, the Put/Call Ratio spikes during a recession. But on December 28, 2022, the Put/Call Ratio spiked to its highest level since 1996. Although it has calmed down to 0.84 on December 30, 2022. Suffice it to say that there is enormous uncertainty in markets.
Covid begat massive Fed monetary stimulus and an excuse for the Federal government to go on a series of spending sprees (Covid “relief”, Instrastructure, Inflation Reduction, and now the $1.7 Trillion pork-laden Omnibus bill). Now that historic big spender Nancy Pelosi (CA-D) is no longer Speaker, will her successor have such a voracious spending appetite? The US economy is still benefitting from Covid-related stimulus which also helped generate 40-year highs in inflation.
Thanks to inflation, US workers have had 20 consecutive months of negative wage growth. But as M2 Money growth slows to a halt, so will real average hourly earnings.
The traditional measures of recession (unemployment and Real GDP growth) are NOT pointing to recession, but 20 straight months of negative wage growth points to bad news for workers. Throw in an inverted yield curve and massive volatility in the CBOE Put-Call Ratio and we have a party … that I don’t want to attend.
As we begin 2023 (and I am still bummed-out over Ohio State University losing a nail-bitter to Georgia in the Peach Bowl), we need to look at the condition of one of the most important sectors of the US economy.\, housing.
If we look at the US Housing Leading Growth index (courtesy of RecessionAlert.com) has slumped to its worst reading since the recessions of 1982 and 2008.
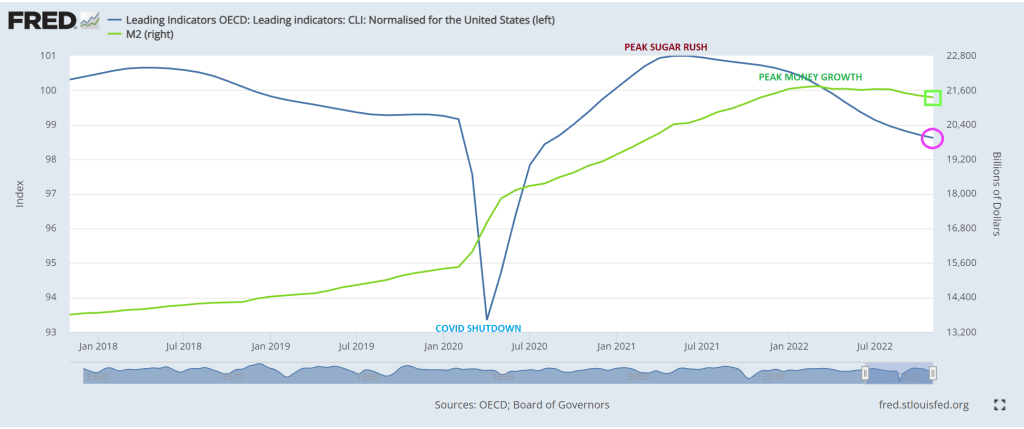
And then we have the OCED leading indicators for the US falling as M2 Money growth slows.
My favorite chart shows US home price growth falling faster than University of Michigan football team’s national championship home hopes.
Will this prompt The Federal Reserve to pivot? Only time will tell.
2022 is one of the record books and not in a Tiger Woods way. Call it a year of pain.
First, the US enacted policies that drove up energy prices (goin’ green) that reverberated through the entire economy in the form of higher prices. Second, The Federal Reserve, in attempt to combat runaway inflation, started removing the excessive monetary stimulus that had been around since Fed Chair Bernanke initiated QE, the seemingly unlimited purchase of Treasury and Agency MBS securities. Janet Yellen continued the massive asset purchases and zero interest rate policies or ZIRP. Now that inflation has struck the American middle class hard, we are seeing Fed Chair Powell doing what Bernanke and Yellen wouldn’t do — remove the monetary punchbowl.
Using Robert Shiller’s on line data, US stocks and bonds have had an awful year, the worst combined year since 1871.
US equity returns have been demolished under the NEW dual mandate (goin’ green = rising prices = Fed tightening).
Let’s see how two of the most famous investment gurus did in 2022, Warren Buffet and Cathie Wood. Buffet’s Bershire Hathaway Class A equity was UP 4% in 2022, while Cathie Wood’s ARK Innovation ETF collapsed by -67% in 2022.
Here is the clinker. The US economy (as well as the global economy) seem dependent on “cheap money” from Central Banks like The Federal Reserve. So the question is … will The Fed pivot? Fed talking heads are saying no, but Fed Funds investors are saying yes to a pivot after June 2023.
Ulysses S Grant was the President the last time the combined stock and bond market was this bad.
The market began downshifting earlier this year as the Federal Reserve started hiking its benchmark interest rate, with the goal of easing high inflation that’s been driven in part by skyrocketing housing costs.
Rates for 30-year, fixed mortgages reached 7.08% in October — and again in November — though they have since retreated, Freddie Mac data show. With borrowing costs roughly double where they were at the start of the year, and inflation leaving less savings to put toward a down payment, homebuyers have pulled back. Sellers are also reluctant to list their properties, yet houses that are on the market are lingering and getting discounted as demand slumps.
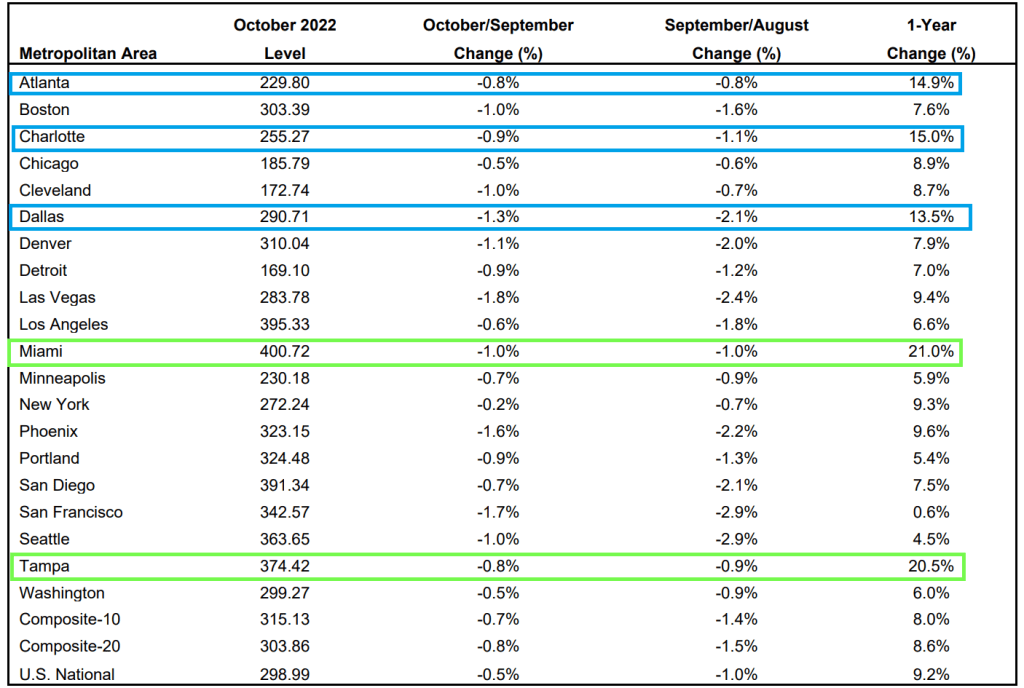
The Case-Shiller National Home Price Index “cooled” to 9.24% YoY growth as The Federal Reserve tightens its monetary noose.
Of the top twenty metro areas, both Miami and Tampa Florida were up over 20% YoY. Hot ‘Lanta, Charlotte and Dallas were over 10% YoY. Mordor on the Potomac was up “only” 6% and all other metro areas were under 10%.
But if we look at October/September changes, all metro areas are down (MoM) with San Francisco the worst.
Finally, The Federal Reserve’s massive balance sheet is still out in force.
Look at this chart of the Case-Shiller National home price index again The Fed’s balance sheet. Uh-oh.
Let’s look at San Francisco (my hometown) since The Federal Reserve began interest rate tightening.
On a year-over-year (YoY) basis, US real GDP rose to a measly 1.9%. US core PCE YoY fell slightly to 4.93%. M2 Money growth is at 2.6% YoY.
The Misery Index (U-3 inflation rate + inflation) remains elevated and above 10% (it currently clocks-in at 12%), far above the pre-Covid reading of around 5%.
Here is the rest of the story. On a quarter-over-quarter basis, real GDP rose to 3.2% QoQ. Personal consumption rose 2.3% QoQ. Core PCE (Personal Consumption Expenditures) rose to 4.7% QoQ. If we use core PCE as a measure of inflation, inflation is rising.
Here is a video of Fed Chair Jerome Powell (doubling as President Joe Biden) saying creating inflation and then raising interest rates to fight it “It’s for the best.”
(Bloomberg) — Bank of Japan Governor Haruhiko Kuroda just gave investors a glimpse of what to expect when the world’s boldest experiment with ultra-loose monetary policy comes to an end.
In the face of sustained market pressure, Kuroda shocked markets Tuesday by saying he’ll now allow Japan’s 10-year bond yields to rise to around 0.5%, double the previous upper limit of 0.25%.
Whether this is a strategic tweak to buy time for his yield-curve control settings until his decade-long term ends in Aprilor the start of the end for his unprecedented monetary easing remains to be seen.
Here are the BOJ’s rate. bands being widened.
The yen?
And with the ECB, Fed and now Bank of Japan all tightening, we are seeing sovereign yields rising across the board.
The Japanese sovereign yield curve is upward sloping unlike the humped US Treasury yield curve.
Rising mortgage rates courtesy of The Federal Reserve’s tightening to fight Bidenflation has led to a Covid-level plunge in the NAHB Homebuilder Market Index.
Everything seems to be going down with a sinking M2 Money growth.
And today, the 10-year US Treasury yield is up over 10 bps. Watch out mortgage rates!
Like the Mel Gibson movie “Apocalypto!”, we are seeing the US middle class and low-wage workers being economically sacrificed by The Federal Reserve, the Biden Administration and Congress.
Despite the rhetoric that Fed stimulus (aka “Stimulypto!”) is being removed, the US remains plagued by NEGATIVE real 10-year Treasury yields, NEGATIVE real Fed Funds Target rate and NEGATIVE real average hourly earnings growth under Inflation Joe.
This chart demonstrates the Stimulytpo problem. Prior to Covid, US wage growth was consistently higher than headline inflation. But starting in March 2021, three months after Biden became President, headline inflation became higher than wage growth.
Even with all these negative REAL rates, the US economy is forecast to have almost no growth in 2023.
To quote Peggy Lee, Is That All There Is? Trillions in Federal spending and Fed monetary stimulus and all we get it 0.50% Real GDP??


You must be logged in to post a comment.