Philly Fed Business Outlook Plunges -10% In September As Fed Tightens Rates (It’s NOT Always Sunny In Philadelphia)

It’s NOT always sunny in Philadelphia.

The Philadelphia Fed Business Outlook fell almost -10% in September as The Federal Reserve tightens monetary policy.

On a related note, the share of total net worth held by the bottom 50% in the US (red line) was always higher than the share of total net worth held by the top 1% (blue line) … until The Federal Reserve began QE in late 2008. Under Obama, the top 1% surpassed the bottom 50% in terms of share of total net worth. it equalized under Trump and before Covid. Then the massive QE (and surge in Federal spending) to battle Covid seemingly made the rich even richer and the bottom 50% even poorer. This is Biden’s America … massive Federal subsidies to the wealthy, crumbs for the bottom 50%.

Green energy anyone??

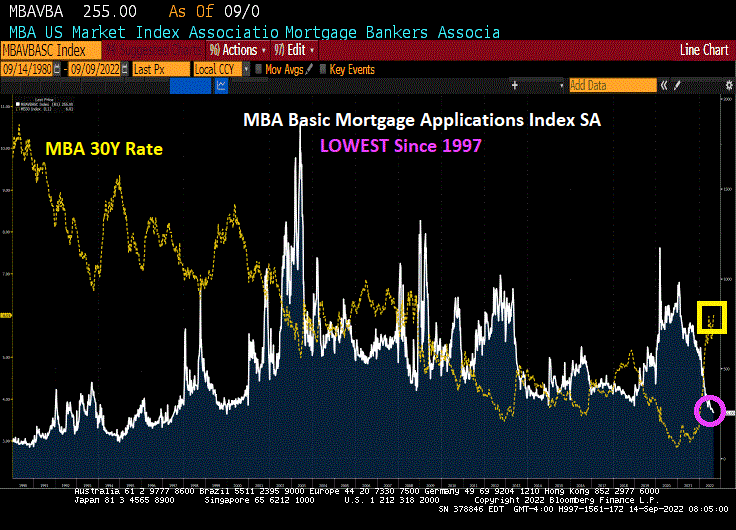
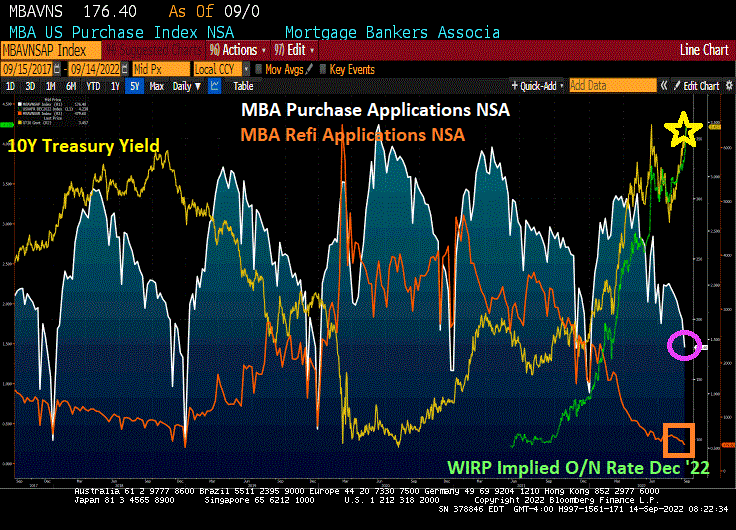
US Mortgage Applications Fall To Lowest Level Since 1997 As Fed Tightens The Monetary Noose (Purchase Apps DOWN -29% YoY, Refi Apps DOWN -83% YoY)

US mortgage applications dropped to the lowest level since 1997. I wonder if President Biden will invite boring crooner James Taylor back to the White House to sing about the collapsing mortgage market? Perhaps he can sing “Shower The People” and change the lyrics to “Shower ON The People.”

Mortgage applications decreased 1.2 percent from one week earlier, according to data from the Mortgage Bankers Association’s (MBA) Weekly Mortgage Applications Survey for the week ending September 9, 2022. This week’s results include an adjustment for the observance of Labor Day.

The Refinance Index decreased 4 percent from the previous week and was 83 percent lower than the same week one year ago.
The seasonally adjusted Purchase Index increased 0.2 percent from one week earlier. The unadjusted Purchase Index decreased 12 percent compared with the previous week and was 29 percent lower than the same week one year ago.

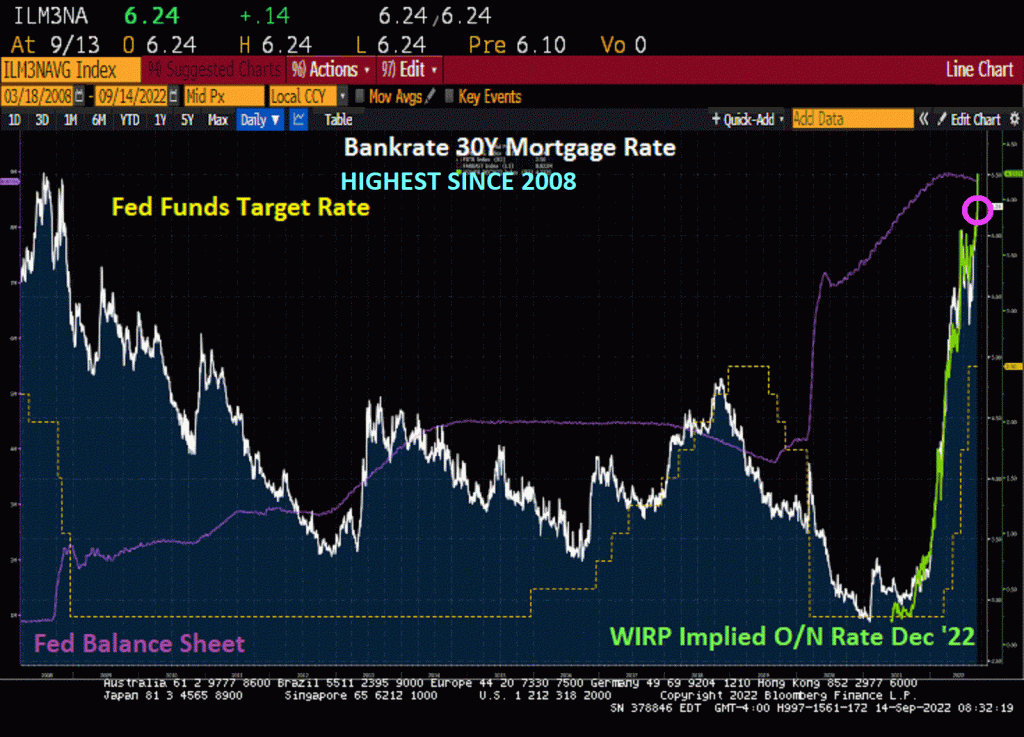
The Bankrate 30-year mortgage rate is now at the highest level since 2008 at the advent of Fed’s QE.

Yes, The Fed has been slow as a sloth in shrinking its balance sheet.

NASAQ Index Plunges 4% On Fed’s Inability To Cool Inflation (Gimme Some Quantitative Tightening!)

That’s the way The Fed likes it!

On today’s inflation report for August, it is clear that The Fed has failed to cool off US inflation, meaning that MOAR QT is on the way.

The NASDAQ composite index plunged -3.85% after The Fed’s failure was released.

The Dow was down “just” -2.70% today. But things are red all over in Europe where they too are failing to tame inflation.

The Fed is probably singing “Give me some quantitative tightening!”

The likelihood of further rate increases just rose to over 4% for the December FOMC meeting.

Jay and The Statists At The Fed!

Pain is coming!

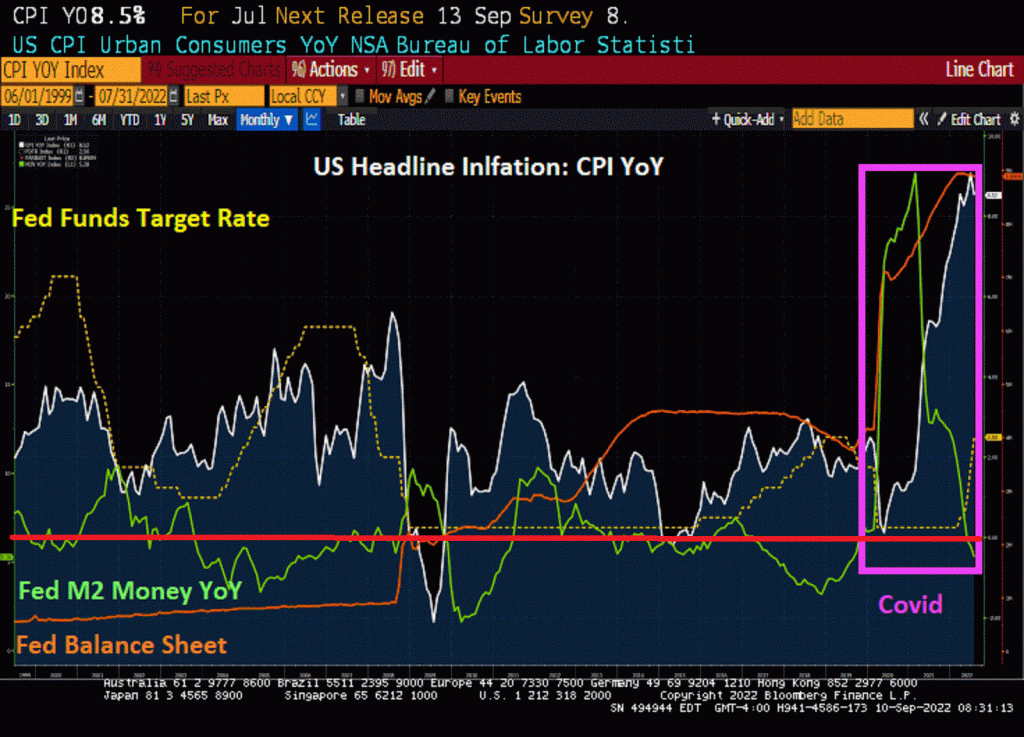
Behind The Curve! US Headline Inflation 8.5% Is Far Ahead Of Fed Target Rate 2.5% (Eurozone Is In Similar Situation 9.1% Inflation Versus 0.75% Deposit Rate)

The Federal government reaction to the Covid outbreak in early 2020 included massive monetary stimulus, Federal government spendathons and Biden’s green energy policies have resulted in a sizzling 8.5% inflation rate (update on Monday morning).

The problem is that The Federal Reserve is far behind the inflation curve with their target rate at only 2.5%. And The Fed’s balance sheet remains near $9 TRILLION in assets held.

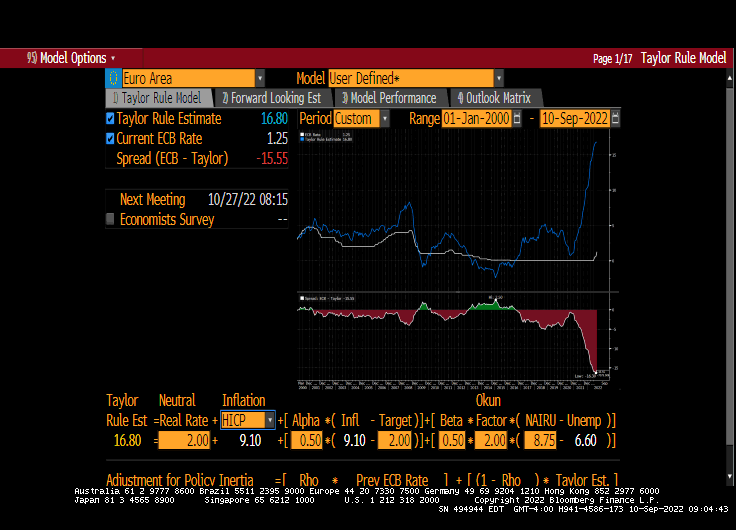
In Euroland, we are seeing a similar problem (Frankfurt, we have a problem!). The Eurozone inflation rate is at 9.1% while their version of The Fed Funds Target rate is only 0.75%, a large catch-up gap.

If we look at the Taylor Rule for the US using headline inflation, we see that The Fed needs to raise their target rate to … 21.72% to crush inflation.

In Euroland, the problem is similar. At 9.10% inflation, the ECB will have to raise their version of The Fed’s target rate to 16.80% to combat inflation. As if that will happen in either the US or Euroland.

On a different note, is it my imagination or does US Democrat Senate candidate from Pennsylvania John Fetterman look like the alien from the flick “Battleship”?

Fetterman is the top picture.

Here is a video of the Fetterman/Dr. Oz debate … if it ever occurs.

The Oakland Stroke? Oakland CA Leads Nation In Home Price DECLINE At -15.1% Over 3 Months (San Francisco DOWN -11.2% Over 3 Months As Fed Removes Punch Bowl)

Is the Oakland housing market having a stroke?

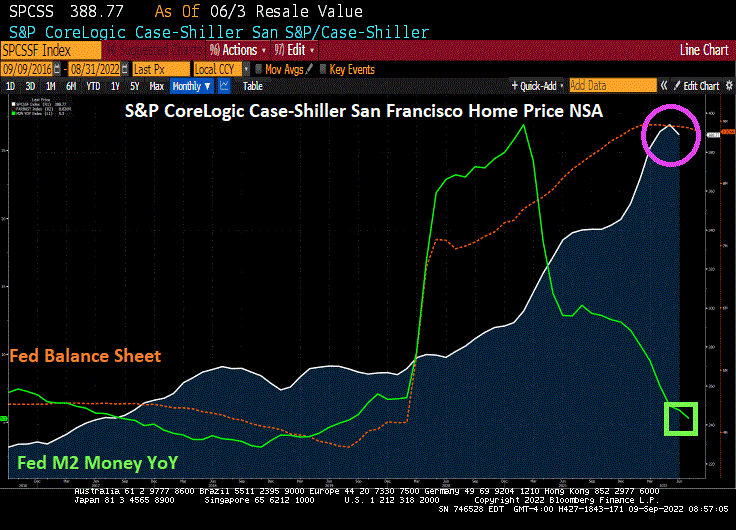
The US housing market is facing stress thanks to The Federal Reserve’s “war on inflation.” As The Fed starts trimming its excess ballast and M2 Money growth YoY slows to the lowest since Pre-Covid, we are seeing housing markets like San Francisco beginning to experience declines in home prices.

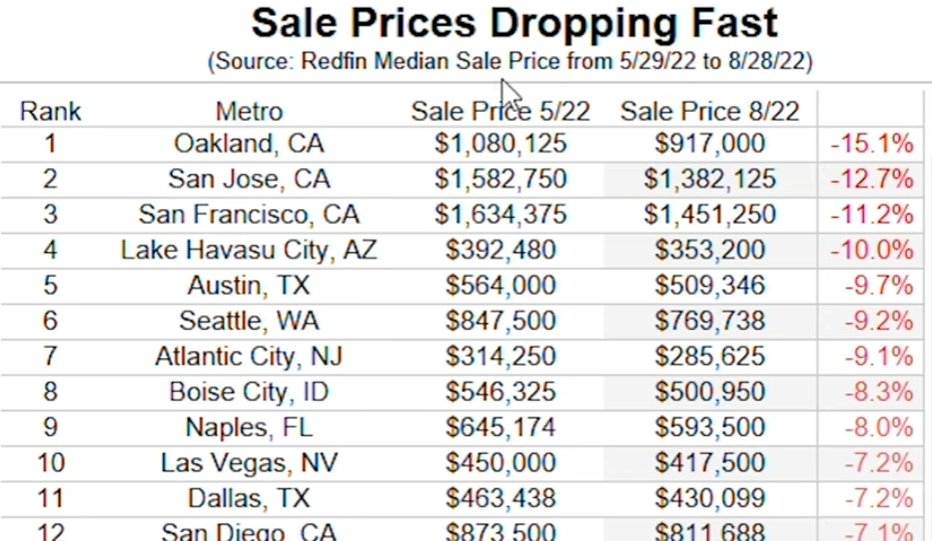
According to Redfin, Oakland California is leading the nation in terms of declining sales prices at -15.1% over a 3 month period. Followed by Silicon Valley and San Jose at -12.7%. San Francisco is in third place at -11.2% (I will ignore Lake Havasu AZ since it is teeny but does have one of the London Bridges) and Austin TX is in 5th place at -9.7%.

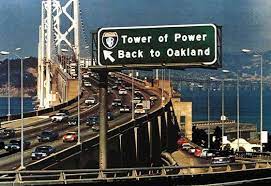
Powell and The Fed are doing “The Oakland Stroke.”

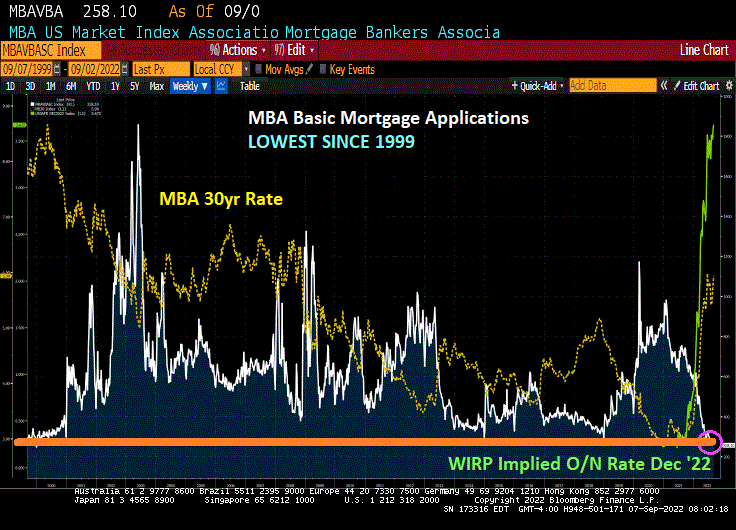
MBA Applications Sink To Lowest Since 1999 (Purchase Applications Down 23% YoY As Fed Tightens Monetary Noose)

The monetary noose tightens on the housing and mortgage markets.

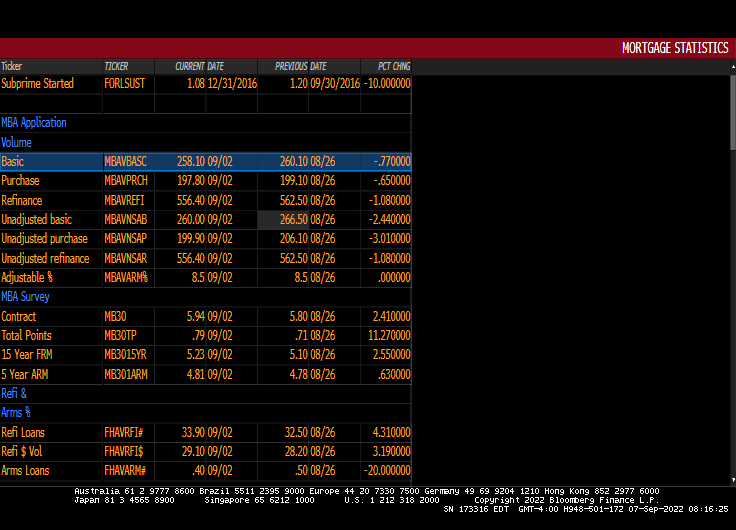
Mortgage applications decreased 0.8 percent from one week earlier, according to data from the Mortgage Bankers Association’s (MBA) Weekly Mortgage Applications Survey for the week ending September 2, 2022. They are now the lowest since 1999.

The Refinance Index decreased 1 percent from the previous week and was 83 percent lower than the same week one year ago. The seasonally adjusted Purchase Index decreased 1 percent from one week earlier. The unadjusted Purchase Index decreased 3 percent compared with the previous week and was 23 percent lower than the same week one year ago.

At least the percentage of adjustable rate mortgages (ARMs) remained the same at 8.5%.

For the sake of the housing and mortgage market, somebody stop Powell and The Gang from tightening!

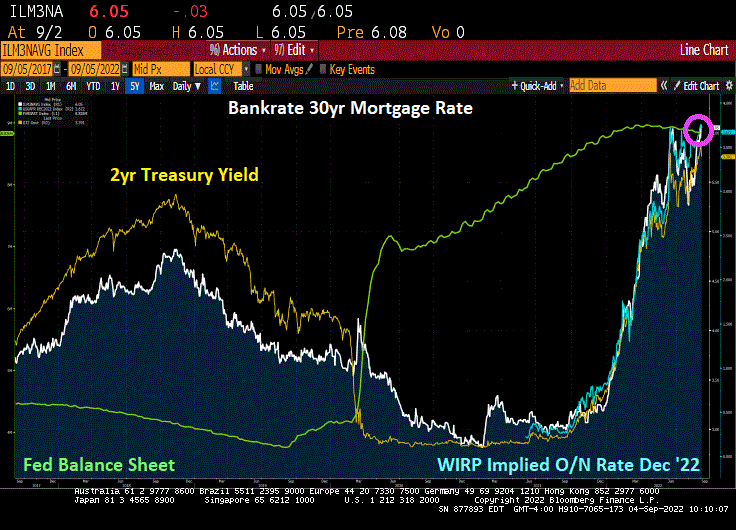
US Mortgage Rate Rises Above 6% As Fed Slow To Withdraw Stimulus (Drives Me Crazy!)

The Federal Reserve drives me crazy!

Thanks to Federal Reserve increases in their target rate, the 30-year mortgage rate has risen above 6%.

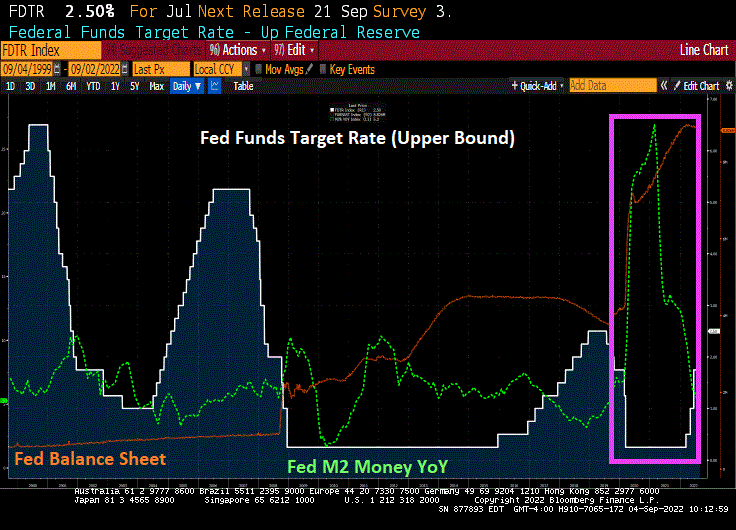
What drives me crazy about The Fed is their failure to removed monetary stimulus following the financial crisis of 2008 when they dropped their target rate to 25 basis points (0.25%) and began assets purchases (orange line). The Fed raises their target rate only once during Obama’s Presidency but then raised rates 8 times after Trump was elected President.

Now we are seeing The Fed NOT shrinking their balance sheet in a meaningful way. However M2 Money growth YoY (green line) has slowed to 5.2%.

While it is a good thing that The Fed is FINALLY reducing some of the monetary stimulus in place since 2008, the bad thing is that mortgage rates are rising rapidly.

The Fed’s quantheads are predicted to resume easing in March 2023.

August Jobs Growth Slows To 315k Added, REAL Wage Growth Continues To Decline -3.3% YoY, Multiple Jobholders Increases (Fed Will Interpret At Green Light To Further Raise Interest Rates)

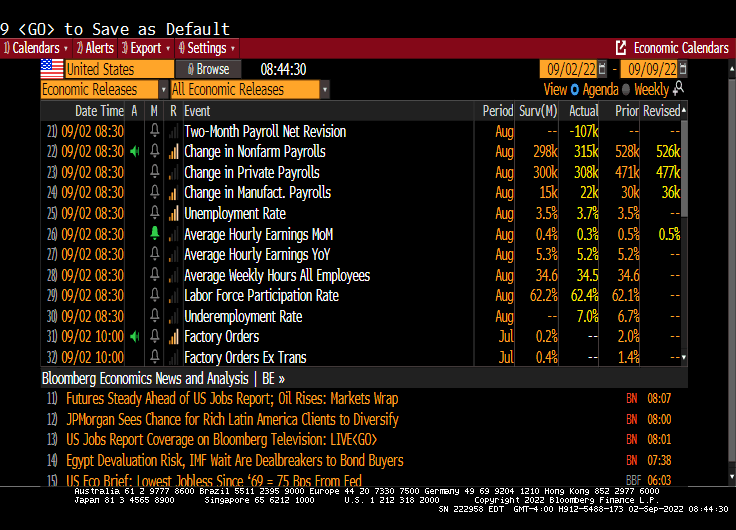
The August jobs report is out. 315k jobs were added, which was considerably higher than the ADP jobs added report of 132k. Hmm.

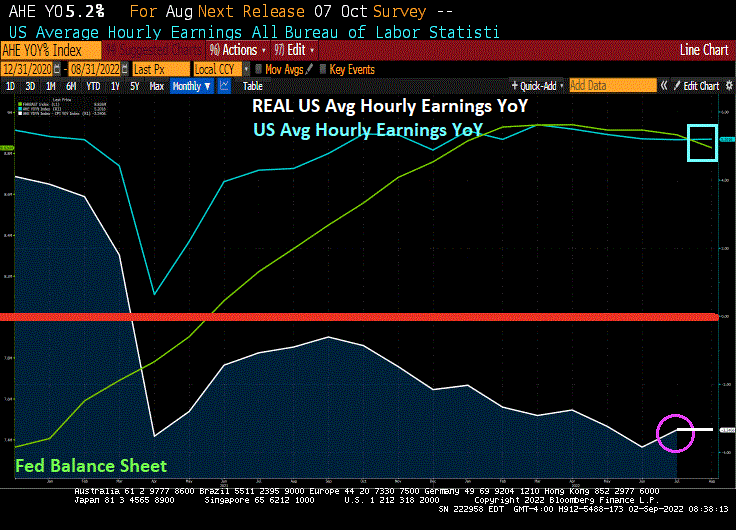
Be that as it may, US Average Hourly Earnings YoY remained at 5.2%. That’s a shame since the last inflation report had US inflation at 8.5%. That translates to REAL Average Hourly Earnings YoY of … -3.3%.

Labor force participation rose to 62.4%.

This is a decent jobs report and will likely lead The Fed to continue raising rates, particularly when The Fed sees that multiple jobholders has increased to cope with inflation.

US Jobs Data Have Potential to Push Fed Toward Third Jumbo Hike (Remember That ADP Jobs Added In August Was Only 132k)

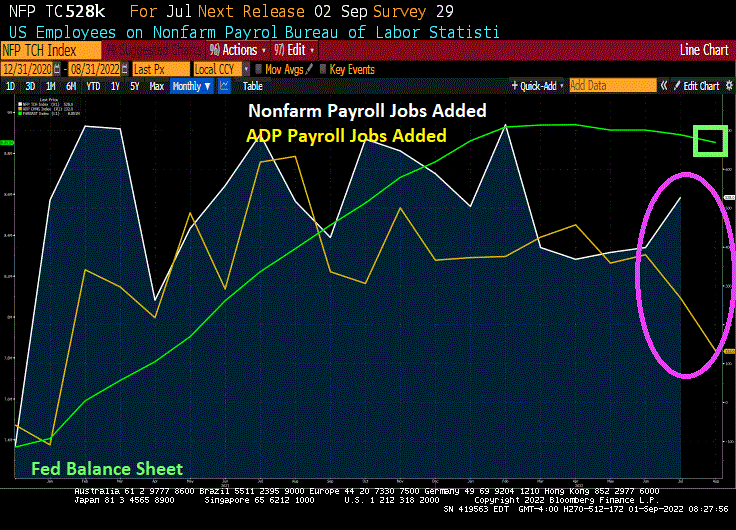
When we look at tomorrow’s US jobs report, it is important to acknowledge that 1) The Federal Reserve has not yet removed the Covid stimulus (green line) and 2) the ADP payroll jobs added was only 132k in August while non-farm payrolls jobs added in July was 528k. That is quite a spread!

(Bloomberg) The hotly anticipated US jobs report has the potential to tip the scales toward a third jumbo-sized hike in interest rates later this month after a wave of data that point to a resilient consumer and high labor demand.

Friday’s report is one of the last marquee releases Fed officials will have in hand before the mid-September policy meeting to help them decipher a complex economic and inflationary puzzle. 

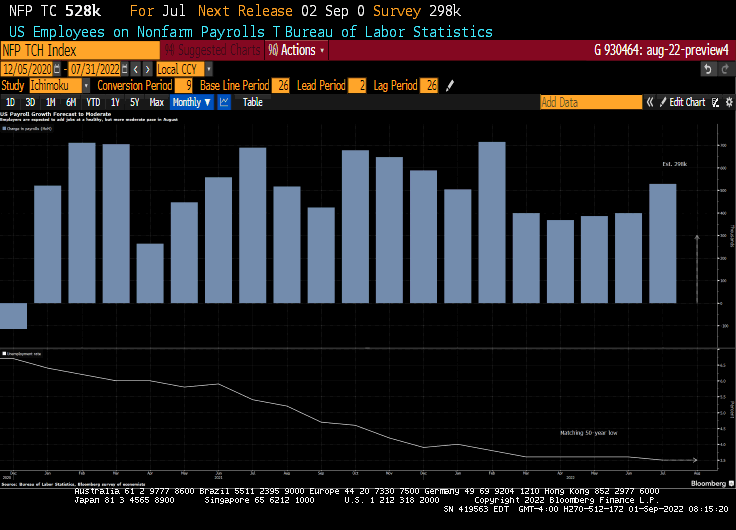
Forecasts call for a healthy, yet more moderate 298,000 gain in August payrolls and for the unemployment rate to hold steady at 3.5%, matching the lowest in five decades. Solid wage growth is also expected amid a persistent mismatch between labor demand and supply.

Such figures, in conjunction with a blowout July employment print, improving consumer sentiment figures and a surprise pickup in job openings, could be enough to push the Fed to raise borrowing costs by 75 basis points, extending the steepest interest-rate hikes in a generation to curb an inflation surge.

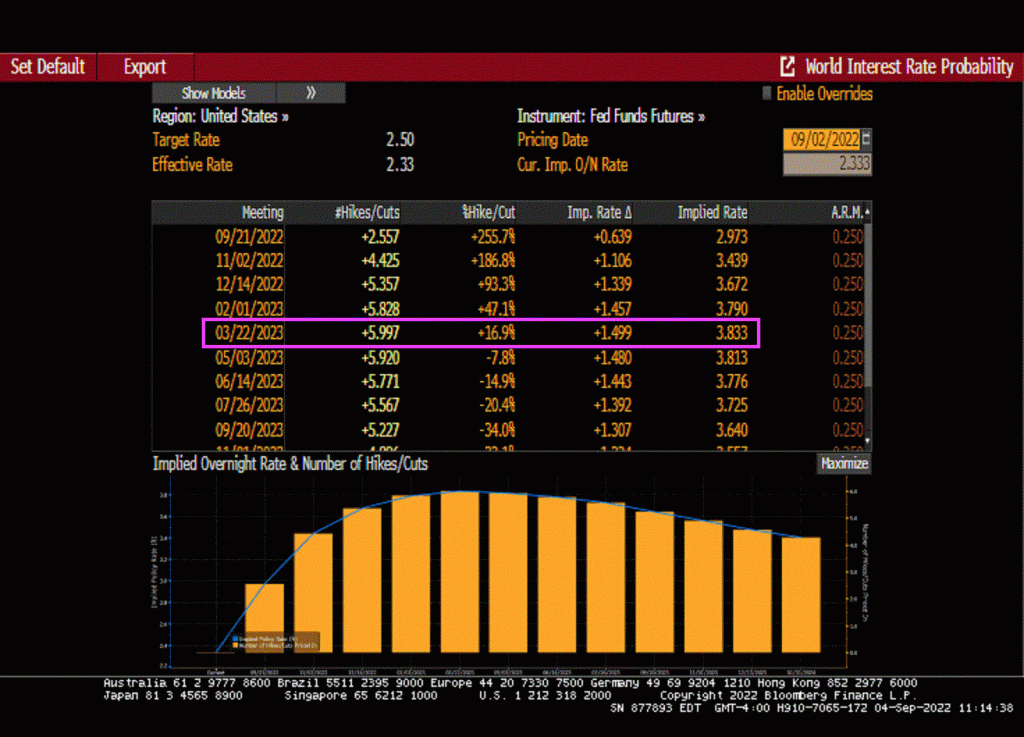
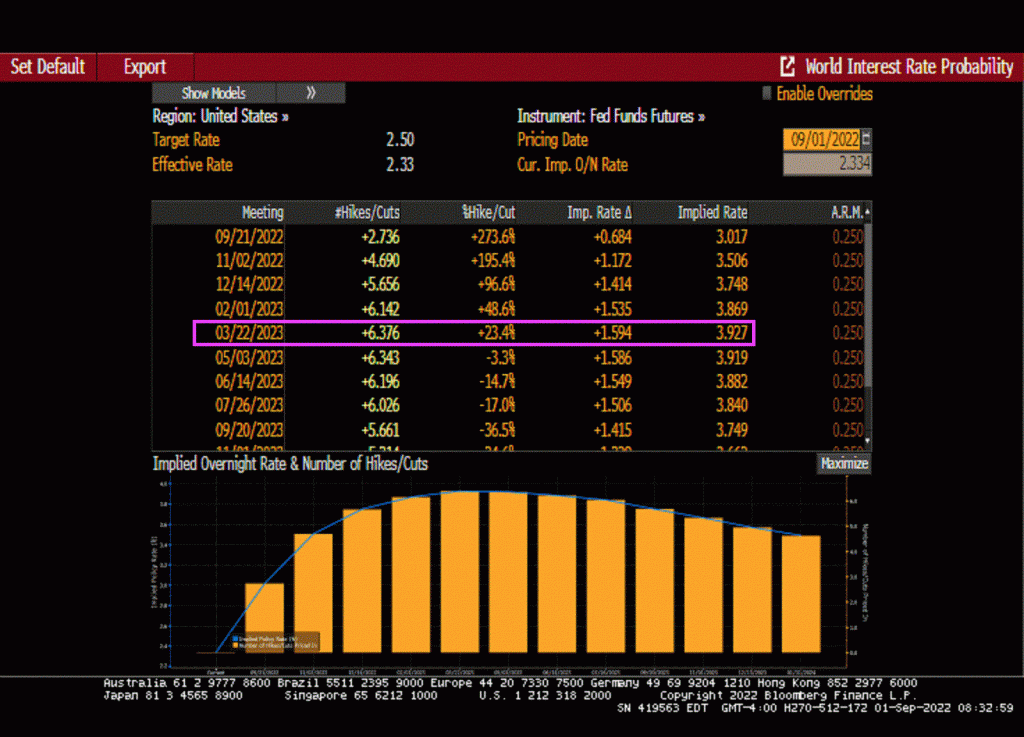
As of this morning, Fed Funds futures data is still pointing to The Fed Funds Target rate rising from 2.50% to around 4% by the March FOMC meeting. That is still a large jump of another 150 basis points anticipated.

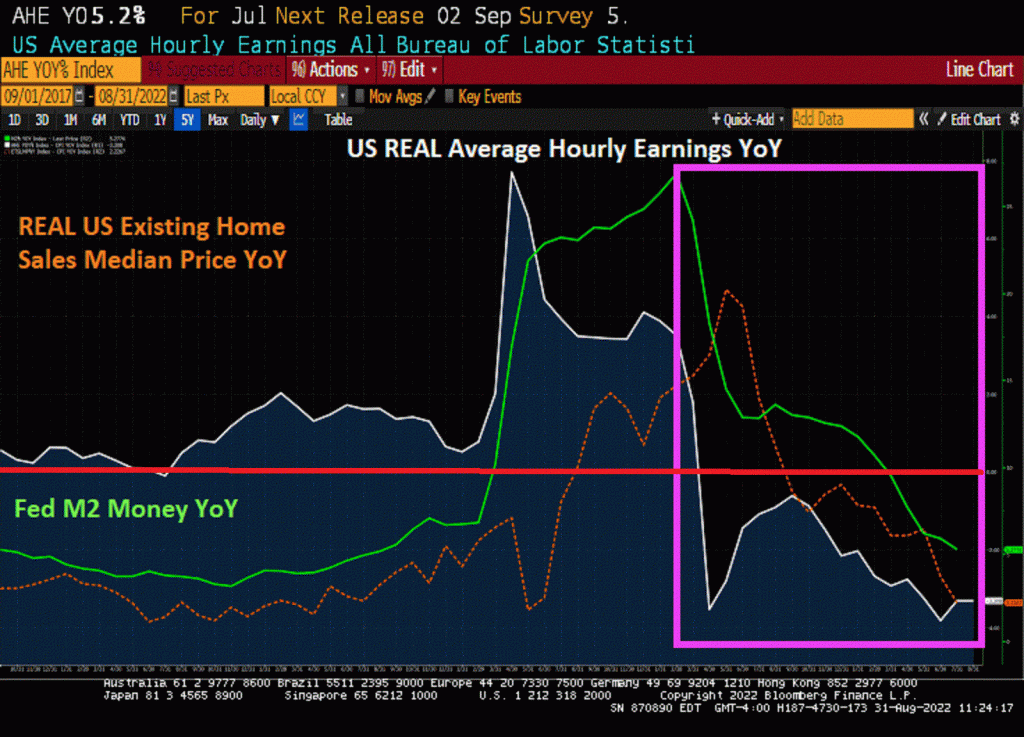
Inflation Is SO Bad That REAL Home Price Growth Has Slowed To 2.23% YoY While REAL Wage Growth Is -3.31% YoY (As Fed’s M2 Money Growth Slows)

When inflation is so bad that REAL wage growth is negative (-3.31% YoY), I would hardly call that a strong economy for the middle class and low-wage workers.

We also see that REAL home price growth (existing home sales median price YoY – CPI YoY) has slowed to only 2.23% YoY in July.

As The Fed tightens, it is only growing to get worse.

Perhaps Biden can enthrall us with yet another “Corn Pop was a bad dude” story.