The US Misery Index, Christmas Edition! Americans Experienced 20% Higher Food Prices, 19% Higher Rents And 61% Higher Gasoline Prices Under Bidenomics, Yet Misery Index Is Almost Back To “Normal”

Have a holly, jolly Christmas! Despite it being far more expensive under Bidenomics.

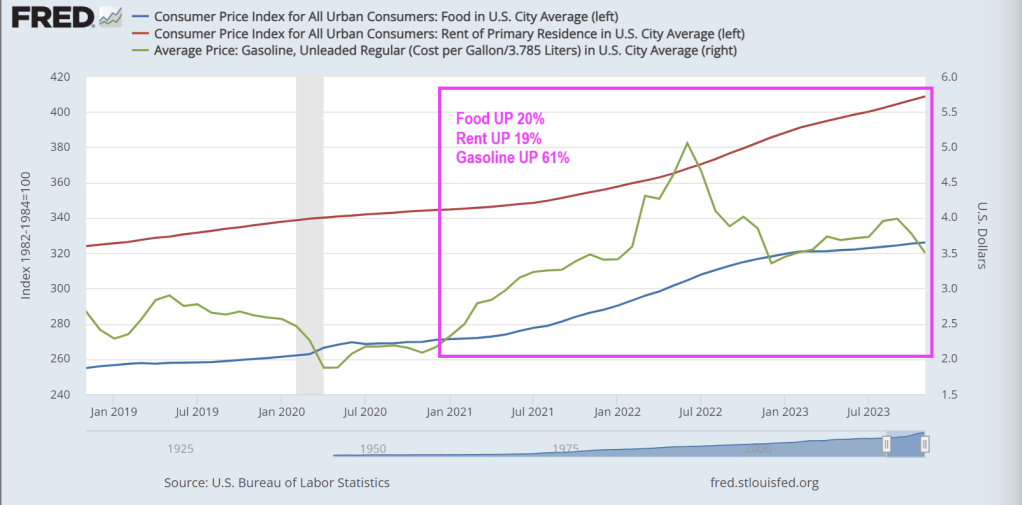
The ‘Misery Index’ is near its lowest level since pre-COVID, but Misery Index masks the true horrors of Bidennomics: 20% higher food prices, 19% higher rents and 61% higher gasoline prices under Bidenomics.

Americans should be in a better financial position heading into the holidays, according to a famous formula developed in the 1960s under President Lyndon Johnson.

The sum of U.S. unemployment and inflation – known as the “misery index” – fell to 6.8% in November from 7.5% the previous month. That’s the lowest since the summer and fast approaching pre-Covid levels.

The misery index is calculated by adding up the current unemployment rate (3.7%) and the inflation rate (3.1%). The formula provides a simple way to gauge whether the well-being of Americans is improving or not.

Misery peaked in April 2020 when the index spiked to 15%, the highest since 1982. Conditions have improved since the early onset of Covid, but it hasn’t been smooth sailing.

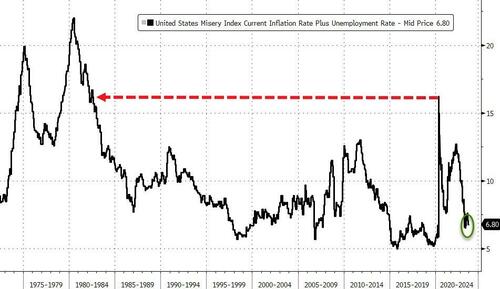
After falling back to 7.7% in January 2021, the index re-accelerated over the next two years as inflation surged. The misery index was 12.5% in June 2022—the same month that annual inflation hit 9.1%.

The unemployment component of the index has been faring well since Covid emergency measures were lifted back in 2021. The unemployment rate has remained below 4% for nearly two years—even as the economy begins to slow.

But economists warn that the misery index doesn’t offer a complete picture of how the average American is doing.

You can tell just by asking them how they feel about the economy and personal finances.

How do Americans really feel?

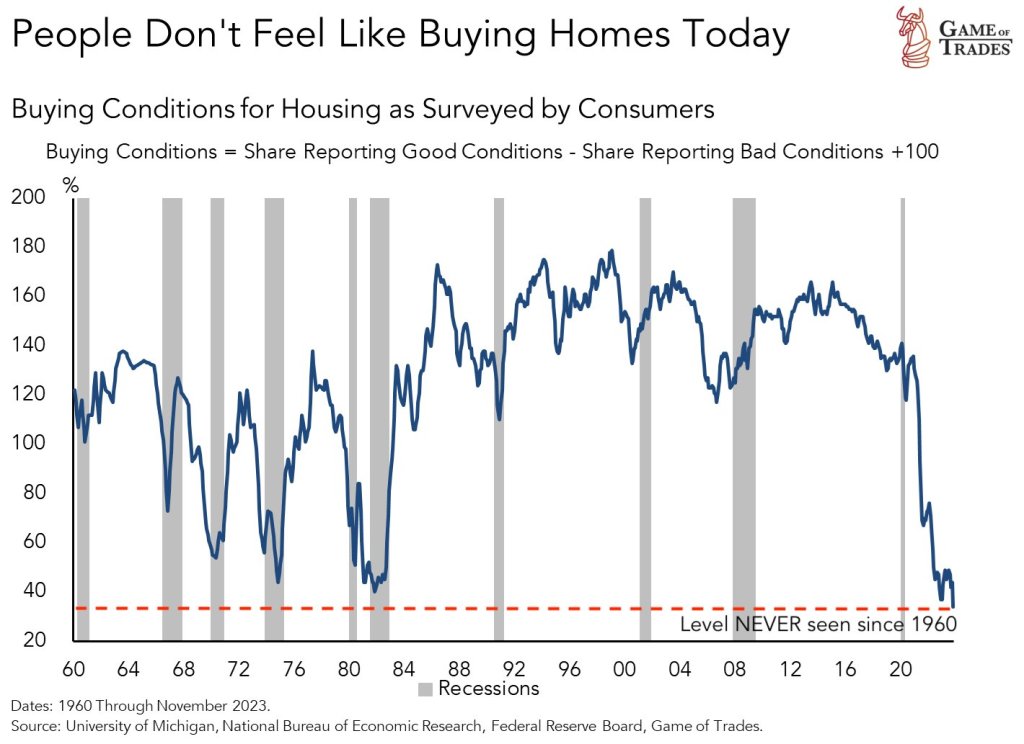
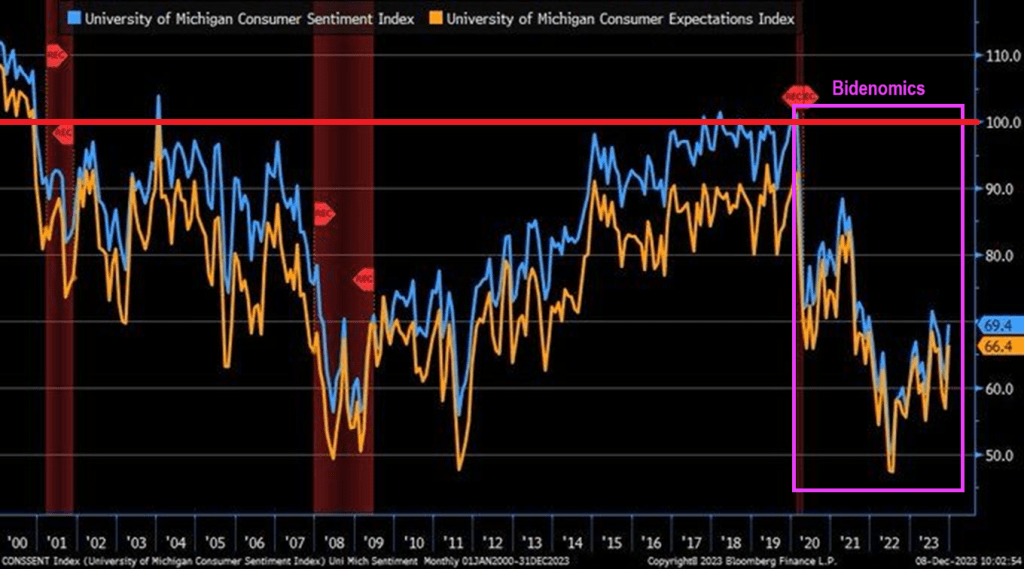
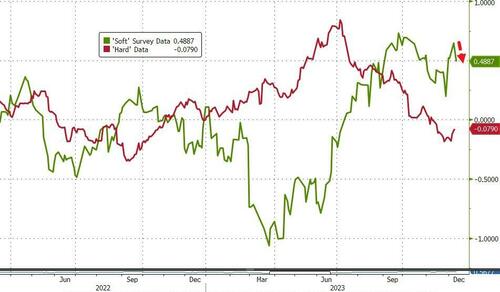
Economist Greg Ip, who heads economic commentary at The Wall Street Journal, compared the misery index to the University of Michigan’s consumer sentiment index—one of the most closely-watched consumer surveys.

“Based on historic correlations, sentiment has been more depressed this year than you would expect given the level of economic misery,” Ip wrote, arguing that consumers are more pessimistic than the misery index would suggest.

A deeper dive into the sentiment data reveals that Americans are still frustrated about inflation and the impact of high interest rates on their finances. And while the consumer sentiment index rose in December—breaking a four-month skid—some economists attributed it to a temporary holiday boost ahead of Christmas.

“Consumer spirits are perking up for the holiday season which is a sign Christmas is still coming this year,” said Christopher Rupkey, chief economist at FWDBONDS, a New York-based financial research company.

A separate sentiment survey from LSEG/Ipsos paints an even less enthusiastic picture of the average consumer.

The December primary consumer sentiment index—which measures Americans’ attitudes toward jobs, investments, the economy, and personal finances—declined from November and was only up slightly compared to 12 months earlier.

According to the survey, attitudes toward the current situation, investments, and jobs “showed significant declines this month.”

The impact of cumulative inflation

As Creditnews Research reported in a recent study, Americans aren’t celebrating the slowdown in inflation because they’re still reeling from the cumulative price increases of the past three years.

While inflation has fallen to 3.1%, consumer prices have increased by a cumulative 19% since the start of 2020. Food prices are up a whopping 25% over that period.

Americans spent the better part of two years—April 2021 to January 2023—seeing inflation grow faster than their paychecks. That trend reversed in February of this year.

But even with stronger purchasing power this year, the vast majority of Americans (92%) said they reduced their spending in the six months through September, according to a Morning Consult survey for CNBC.

A majority of respondents across all wage brackets said current economic conditions negatively impacted their finances.

So, while the Misery Index indicates that the inflation RATE has slowed, it masks the fact that Americans are far worse off under Bidenomics.

Bidenomics Isn’t Working! Conference Board Leading Economic Index Fell Again In November

Biden says over and over again the Bidenomics is working. It isn’t working.

The Conference Board Leading Economic Index® (LEI) for the U.S. declined by 0.5 percent in November 2023 to 103.0 (2016=100), following a (downwardly revised) decline of 1.0 percent in October. The LEI contracted by 3.5 percent over the six-month period between May and November 2023, a smaller decrease than its 4.3 percent contraction over the previous six months (November 2022 to May 2023).

US Existing Home Sales Decline -7.28% Since Last Year (UP 0.8% MoM)

For November, US existing home sales are down -7.28% since last year. At least that is an improvement over -14.6% YoY in October.

Despite homebuilder sentiment ticking up (along with their stock prices) and housing starts soaring – buoyed by a 100bps decline from multi-decade highs in mortgage rates – analysts expected a small 0.4% MoM decline in existing home sales in November (after October’s big drop).

Instead, existing home sales beat expectations by rising 0.8% MoM in November, which pulled the YoY decline up to just 7.28%…

Source: Bloomberg

“The latest weakness in existing home sales still reflects the buyer bidding process in most of October when mortgage rates were at a two-decade high before the actual closings in November,” said NAR Chief Economist Lawrence Yun. “A marked turn can be expected as mortgage rates have plunged in recent weeks.”

The total existing home sale SAAR bounced very marginally off record lows…

Source: Bloomberg

Regional sales were mixed:

  • Existing-home sales in the Northeast slipped 2.1% from October to an annual rate of 470,000 in November, down 13.0% from November 2022. The median price in the Northeast was $428,600, up 4.8% from the prior year.
  • In the Midwest, existing-home sales rose 1.1% from the previous month to an annual rate of 940,000 in November, down 8.7% from one year ago. The median price in the Midwest was $280,800, up 4.9% from November 2022.
  • Existing-home sales in the South improved 4.7% from October to an annual rate of 1.77 million in November, a decline of 4.3% from the prior year. The median price in the South was $351,500, up 3.4% from last year.
  • In the West, existing-home sales slumped 7.2% from a month ago to an annual rate of 640,000 in November, down 8.6% from one year before. The median price in the West was $603,200, up 5.3% from November 2022.

Mortgage rates are down, but leave a long way for home sale to drop still…

Source: Bloomberg

But, the gap between current rates and effective rates for Americans is still immense…

Source: Bloomberg

The median existing-home price for all housing types in November was $387,600, an increase of 4.0% from November 2022 ($372,700), but down MoM…

All four U.S. regions posted price increases.

“Home prices keep marching higher,” Yun added.

“Only a dramatic rise in supply will dampen price appreciation.”

Well, with housing starts accelerating in the latest data and Powell’s massive pivot, has The Fed re-ignited its 3rd housing bubble?

And the buying condition for housing sinks to all-time low.

Fire! November US Housing Starts Explode +14.8% In November As New Home Prices Collapse By -20% YoY

There is a sudden fire in housing as housing starts soar in November.

Housing Starts:
Privately‐owned housing starts in November were at a seasonally adjusted annual rate of 1,560,000. This is 14.8 percent above the revised October estimate of 1,359,000 and is 9.3 percent above the November 2022 rate of 1,427,000. Single‐family housing starts in November were at a rate of 1,143,000; this is 18.0 percent above the revised October figure of 969,000. The November rate for units in buildings with five units or more was 404,000.

Building Permits:
Privately‐owned housing units authorized by building permits in November were at a seasonally adjusted annual rate of 1,460,000. This is 2.5 percent below the revised October rate of 1,498,000, but is 4.1 percent above the November 2022 rate of 1,402,000. Single‐family authorizations in November were at a rate of 976,000; this is 0.7 percent above the revised October figure of 969,000. Authorizations of units in buildings with five units or more were at a rate of 435,000 in November.

Median NEW home prices dropped -20% YoY.

1-unit housing starts exploded, but permits declined.

Housing Market Index Remains Depressed Under Bidenomics As Federal Debt SOARS (Its A Long Way To The Bottom!)

As AC/DC sang; “Its a long way to the top bottom.” But Bidenomics is sending us there!

Today, the NAHB/Wells Fargo Housing Market Index rose slightly on falling mortgages. But the housing market index remains depressed since Biden seized the reigns of power in 2021.

The Federal government added $7 trillion in debt since 2020 while it took 215 years to get to $7 trillion before Covid and Bidenomics.

In what can simply be called fiscal insanity, The Federal government is borrowing like there is no tomorrow (given that Biden is 81 years old, this isn’t far off) displacing businesses and households. Heaven help us if the Federal government has to borrow more money to fight a real war like World War II.

So, the massive Federal debt gorging isn’t helping the housing market.

Fiscal Inferno! Banks Draw On Term Funding Program (BTFP) As Consumer Sentiment Remains Bleak (Newsom Defaults On $20 BILLION Federal Loan)

Both the US Federal government and California’s government are facing a fiscal inferno. Thanks to a softening economy and inane fiscal policies.

At the macro level, we see that The Federal government has gone wild spending money and borrowing it. Much more than businesses and households. Biden’s wild spending reduces the degrees of freedom that Treasury has if the US slips into another recession or depression.

First, let’s begin with banks to illustrate the worsening condition of the economy. Emergency loans from The Fed’s Bank Term Funding Program (BTFP) is on the rise, signaling perceived trouble in the economy.

Small banks are suffering more than big banks.

Consumer sentiment is below 70 (100 baseline) under Biden and Bidenomics.

And then we have Gavin “Gruesome” Newsom and California. California is now facing a $68 billion deficit. It has also defaulted on a $20 billion loan from the federal government. The situation is so dire the state is telling agencies not to replace broken printers or re-stock office supplies. Workers are being stripped of benefits and could face furloughs. This is all happening as the state has spent billions funding High-Speed Rail and expanding Medi-Cal to all undocumented immigrants, while losing billions in tax revenue from people leaving the state.

$68 billion is over twice this forecast deficit of $24 billion.

But never fear. “Billions Biden” will make sure California is okay, ar least until the 2024 Presidential election.

Financing Bidenomics! The Good, The Bad And The Ugly (Rising Bond Total Returns, Rising Refinancing Costs, Falling Mortgage Purchase Demand)

Like the spaghetti western “The Good, The Bad And The Ugly,” Bidenomics has had similar effects on financing. Some good, some bad and a lot of uglies.

The good! For investors like pension funds the own US Treasuries, inflation has led The Federal Reserve to raise interest rates. This is good for investors holding short-term debt. The Bianco Fixed Income Total Return Index is soaring!!

The Bad: Well, the flip-side of the same coin is that debt refinancing costs have soared.

The Ugly. There are many contenders for losers under Bidenomics and current Fed (garbled) policies. But I choose … mortgage demand collapse with rising home prices and rising mortgage rates. Mortgage rates are up 165% under Biden.

And mortgage demand (applications) have been crushed.

Also on the ugly side, global aggregate corporate yields have collapsed.

So, there have been winners with Bidenomics (the top 1%), and lots of losers.

The Empire Strikes Out! Empire Fed Manufacturing Unexpectedly Crashes Into ‘Contraction’ (Falls To -14.5!)

The Empire (State) Strikes Out! Contraction (or economic slowdown) is hitting New York State!

After three strong ‘beats’ in a row, the Empire State Manufacturing Survey crashed back into contraction, well below expectations in December (from +9.1 to -14.5, +2.0 exp).

The drop takes the measure from ‘expansion’ at 7-month-highs to ‘contraction’ at 4-month-lows…

Source: Bloomberg

The new orders fell six points to -11.3, pointing to a decline in orders for a third consecutive month, and the shipments index fell sixteen points to -6.4, indicating that shipments fell.

The unfilled orders index held steady at -24.0, a sign that unfilled orders continued to fall significantly.

After rising into positive territory last month, the inventories index retreated fourteen points to -5.2, suggesting that inventories moved lower.

The delivery times index dropped ten points to -15.6, its lowest reading in several years, a sign that delivery times shortened.

The index for number of employees fell four points to -8.4, its lowest level in several months, pointing to a modest decline in employment levels.

On the bright side, the prices paid index moved down six points to 16.7, suggesting an ongoing moderation in input price increases, while the prices received index held steady at 11.5, a sign that selling price increases remained modest.

Is this the start of ‘soft’ data’s reversion to ‘hard’ reality?

The Fed – with its six rate-cuts – better hope so.

Using PF Flyer Decoder Ring To Decode Powell’s Fed Message

Yes, you need a PF Flyer magic decode ring to decode Powell’s latest message.

This week’s central-bank bonanza brings with it the usual set of ambiguous and often impenetrable statements and press conferences.

Traders and investors must spend precious time deciphering them. For those who wouldn’t mind a break from this parlor game, there are some markets that don’t march to the beat of the global policy cycle, and offer diversification benefits for portfolios.

The game was in full flow at Wednesday’s Federal Reserve meeting, as the central bank patiently unpicked the higher-for-longer stitching it had spent many months carefully inculcating in the market.

Anyone who had listened to it on financial conditions, keeping rates restrictive for an extended period, or who thought Powell meant it when he implied he was a Paul Volcker and not an Arthur Burns, is now left trying to figure out if the Fed’s reaction function has indeed changed.

Adding confusion to the game are the dots. They reinforced the dovish message, with the median dot implying three cuts next year versus two back in September.

But with one dot implying six cuts, two implying none and the rest all spread in between, this isn’t exactly sure-footed clarity.

It’ll be repeated again today with the ECB, BOE, the SNB and the Norges Bank all meeting to set rates (the SNB held rates steady and the Norges unexpectedly hiked). For those who can trade only G7 markets, there is not much choice but to play the game.

However, for those looking for markets less reliant on the Delphic utterances of central bankers, there are other options.

The problem is that most bond markets tend to be quite alike over the medium-to-longer term.

Interest rate cycles are typically quite synchronized (with the US the most influential), and capital can flow freely around most of the world.

To show the broad uniformity of bond markets we use a statistical tool called principal component analysis.

PCA is a way of making sense of large data sets. For instance, a retailer may have reams of data on how users use its website: how long they spend on it, which pages they visit, where they hover their mouse, etc. PCA will tell you which input – or combination of inputs – has the greatest explanatory power in determining the total time users spend on the website (something they would want to maximize).

Using PCA on yields from 40 countries, we can show that over half of global bond market moves are described by just one factor.

This not a trivial result. It means we could replace our data on 40 bond markets by this one component and it would capture more than half of the variance of the individual yields.

A bond market that was similar to this component would therefore be a good proxy for the global bond market. However, as the mathematician Carl Jacobi advised, we should always invert. A more interesting question is: which bond markets look least like this factor?

The chart below shows how each of the 40 bond markets are correlated to the first PCA factor. Most have a high correlation – more than 75% – but what stands out is the handful of markets with a low or negative correlation.

Japan and Turkey are among those with a negative correlation, while China’s correlation is close to zero.

This is intuitive.

Japan has been running a deliberately counter-cyclical monetary policy, while Turkey until recently was running a through-the-looking-glass one, cutting rates in the face of rampant inflation. And China’s economy is in deflation, at odds with every other major DM and EM country.

The above analysis provides analytical backing for the intuition that Japan et al have provided diversification for global bond portfolios in recent years, while most other markets, e.g. Europe, the US, Australia, New Zealand, etc are low-resolution facsimiles of each other and therefore have delivered few diversification benefits.

Of course, there will be other things to consider before adding a country’s bond index to a portfolio, such as how overbought or oversold it is, how liquid it is, the expected stance of the central bank, and so on.

But if the correlations persist, such a market should produce a more resilient and lower-volatility bond portfolio.

We can extend this analysis to look at stocks.

Global equity markets are even more similar to one another than bond markets, with the first component explaining 60% of the total move. Nonetheless, applying PCA offers up some portfolio diversification candidates (using as our data set MSCI country indices in USD).

Indeed, it can be shown that the first PCA component of equity markets is highly correlated to the US’s manufacturing ISM, elegantly demonstrating that in large part global stocks are driven by macro.

Indonesia, UAE and Chile’s stock markets are all negatively correlated to the global equity move, and therefore the global macro cycle, while European markets move almost in lockstep with it. As the chart below shows, Indonesia’s market (white line) remained supported in late 2022/23, as its market bottomed in July 2022 and rallied through, while other markets went on to make a new low in October of that year.

Indonesia et al also have had among the lowest returns of all global equity markets this year. It is relatively common for the markets that are among the worst performers one year to be the among the top the following year.

We can complete the analysis by looking at commodities.

The first PCA component here explains about half the move of all commodities, a similar proportion to global bond markets. PCA shows that precious metals, such as gold, silver and platinum are the most negatively correlated to commodities.

As almost all commodities are traded in dollars, the first component is quite similar to the DXY.

So to some extent we are asking which commodities are most negatively correlated to the dollar. Precious metals typically exhibit a more negative dollar correlation than most other commodities. Further, in the current environment they should offer some protection against inflation.

The lack of variation among macro-driven markets makes portfolio investment challenging as it is easier to add risk rather than uncorrelated factors.

The above PCA analysis shows that Japanese bonds, Indonesian equities and platinum are examples of assets that may confer some diversification advantages for global portfolios.

At the very least, you may not have to pay as much attention to central bankers.

The magic Fed Decoder ring!

No, that isn’t Mike Pence, RINO from Indiana.

The Powell Pivot! Powell/Yellen Think Everything Is Beautiful While Market Thinks The Fed Will Cut Rates From 5.50% To 4% By December 2024 (150 Basis Point Cut In One Year!)

In this corner, we have Fed Chair Powell, Treasury Secretary Yellen, President Biden and Cheerleader Brainard all cheering and singing “Everything Is Beautiful!”. In the other corner, we have … investors who are are betting that The Fed will be cutting the target rate from 5.50% to 4% by December 2024, a cut of almost 150 basis points in one year.

Why? First, the US economy is softening. Second, The Fed will want Biden (or whoever Democrats prop up in his place) re-elected as President.

While Wednesday’s FOMC statement had barely any changes in it, with the notable addition of the word “any” in the context of policy firming meant to acknowledge that the Fed is at or near the peak rate

… it was the dot plot, where the median 2024 dot plot now forecasts 3 rate cuts up from 2,  that shocked traders: in a very rare admission by the Fed, the central bank confirmed that the pre-meeting market pricing of multiple cuts in 2024 were correct in interpreting the Fed’s intentions. It also confirmed – yet again – that the market was right and every single FOMC member was wrong. In retrospect, none of this should have been a shock.

Commenting on the dot plot, TS Lombard’s Steven Blitz said that “for a group that prizes the pricing of its policy intentions in the forward markets as being more important to shifting market conditions than the spot rate, they h d to know that moving the median forecast for Fed funds at the end of 2024 back to June levels would be a bullish signal.

Or maybe concerns about the market’s reaction were of secondary importance to a Fed which had gotten the tap on the shoulder by the Biden admin and its Democratic cronies on the Hill, terrified about their re-election chances now that the snake of Identity Politics is finally eating its poisonous tail. Indeed, almost as if having seen the collapse in the recent approval polls, Biden’s handlers made some very persuasive phone calls to the Fed. After all, only something as ridiculous – and serious – as steady political pressure can explain the unprecedented U-Turn by the Fed chair, one which even shocked Powell’s own mouthpiece, Nikileaks, who commented on the “Powell pivot” saying “what a difference two weeks can make.”

But markets are behaving as if The Fed will begin cutting rates. Look at the US 2-year Treasury yield on Wednesday AFTER the Fed minutes were released.

Bear in mind that mortgage rates are up 149% under Biden. And mortgage payments up 88%. Yikes!

Everything is NOT beautiful, according to investors.

Welcome to the REAL Snake Hole Lounge: The Federal Reserve. And their famous “Snake Juice!” Now forecast to be under 4% by 2025!!