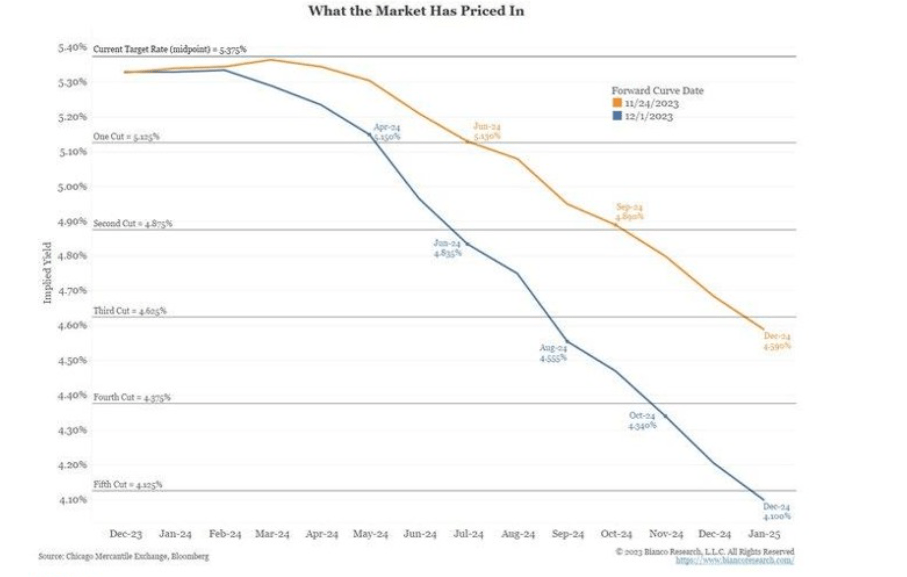
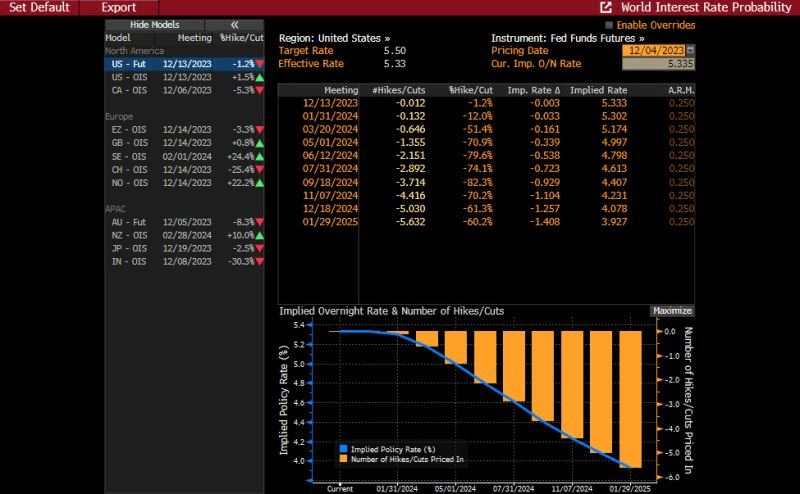
In this corner, we have Fed Chair Powell, Treasury Secretary Yellen, President Biden and Cheerleader Brainard all cheering and singing “Everything Is Beautiful!”. In the other corner, we have … investors who are are betting that The Fed will be cutting the target rate from 5.50% to 4% by December 2024, a cut of almost 150 basis points in one year.
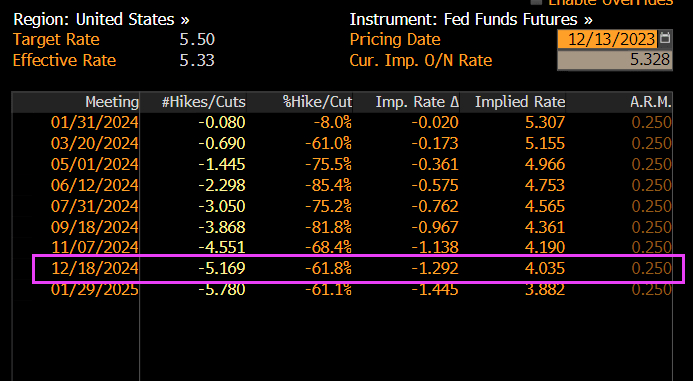
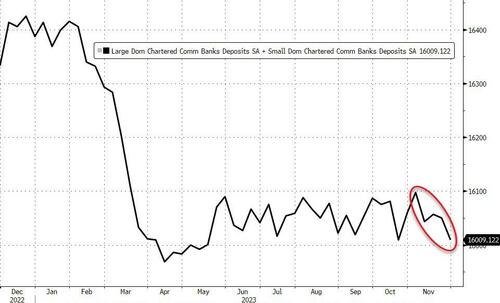
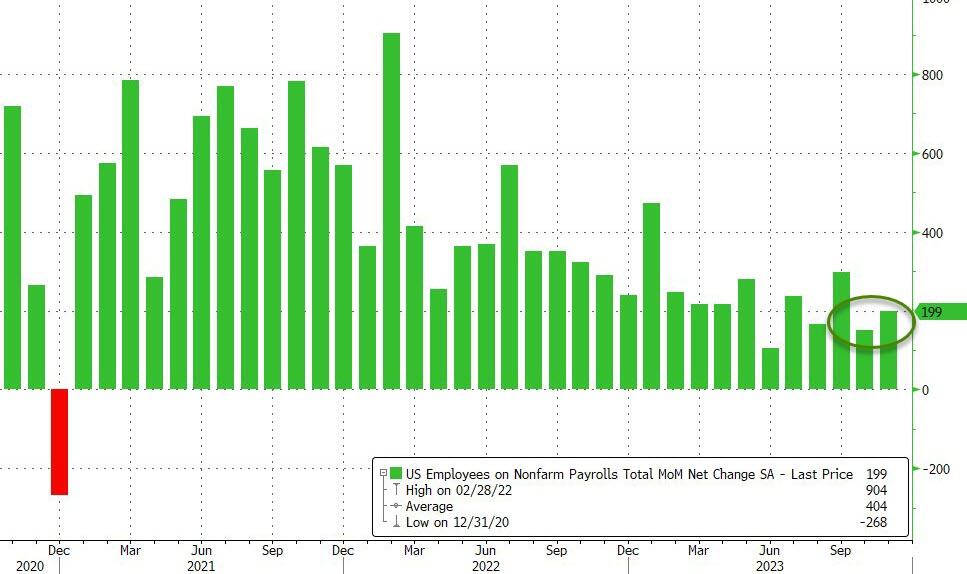
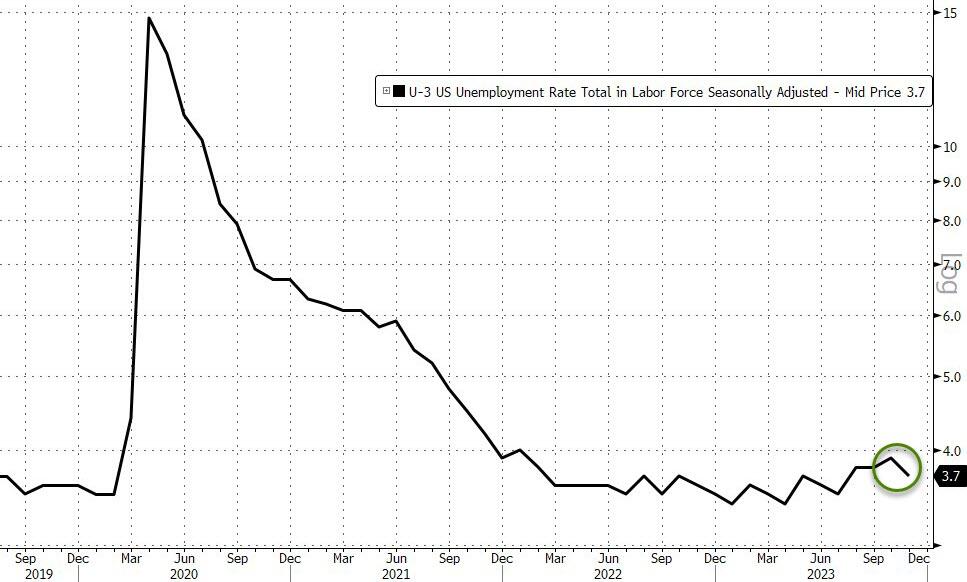
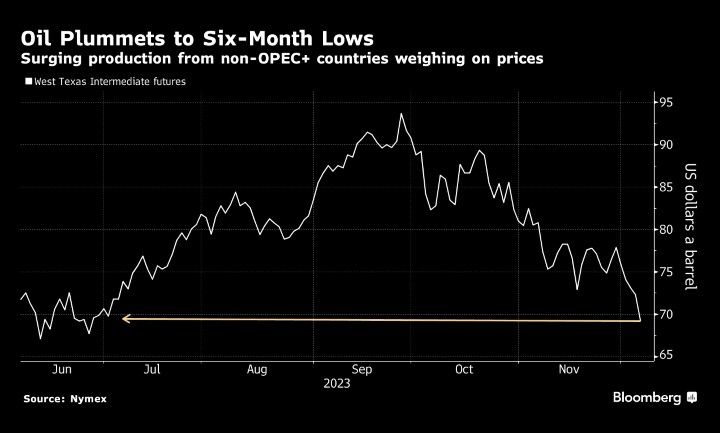
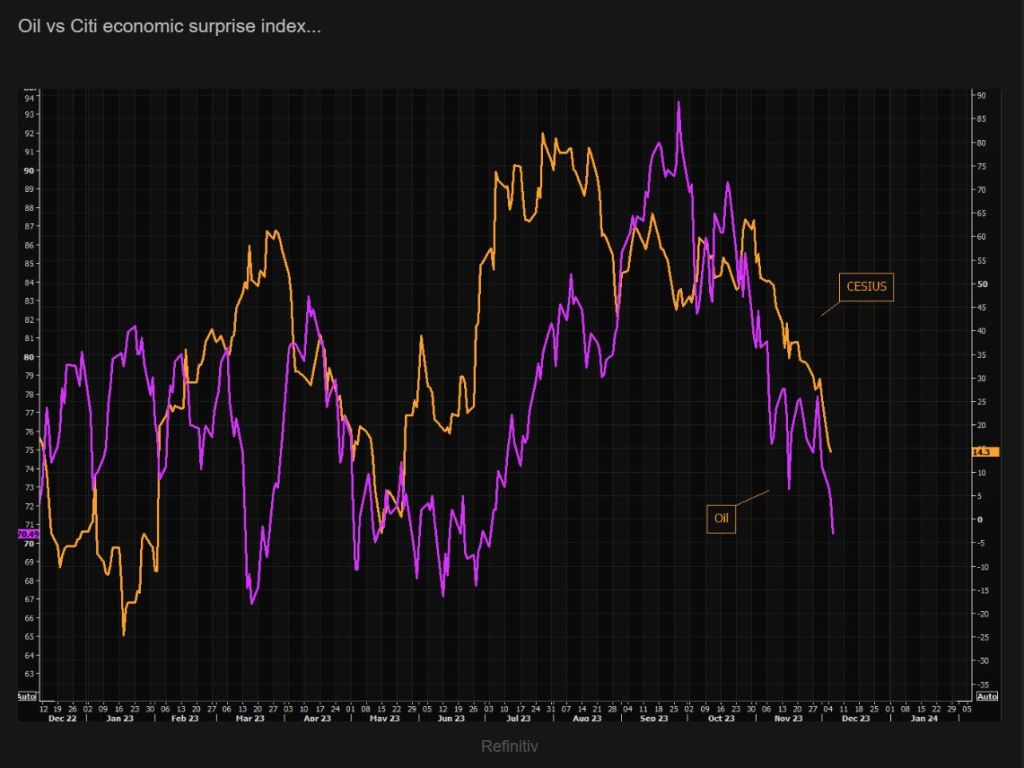
Why? First, the US economy is softening. Second, The Fed will want Biden (or whoever Democrats prop up in his place) re-elected as President.
… it was the dot plot, where the median 2024 dot plot now forecasts 3 rate cuts up from 2, that shocked traders: in a very rare admission by the Fed, the central bank confirmed that the pre-meeting market pricing of multiple cuts in 2024 were correct in interpreting the Fed’s intentions. It also confirmed – yet again – that the market was right and every single FOMC member was wrong. In retrospect, none of this should have been a shock.
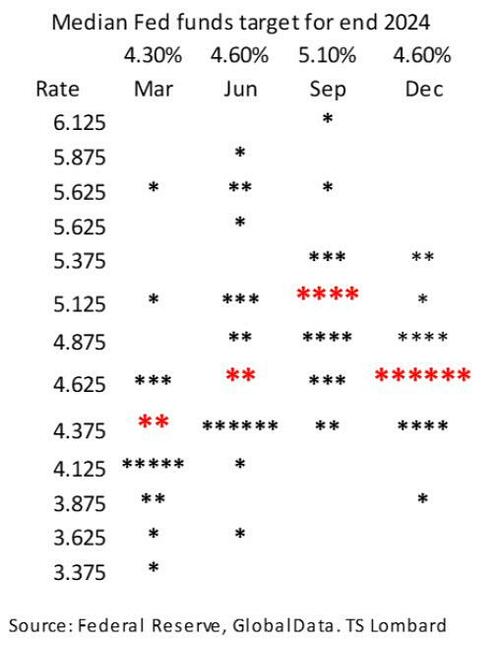
Commenting on the dot plot, TS Lombard’s Steven Blitz said that “for a group that prizes the pricing of its policy intentions in the forward markets as being more important to shifting market conditions than the spot rate, they h d to know that moving the median forecast for Fed funds at the end of 2024 back to June levels would be a bullish signal.“
Or maybe concerns about the market’s reaction were of secondary importance to a Fed which had gotten the tap on the shoulder by the Biden admin and its Democratic cronies on the Hill, terrified about their re-election chances now that the snake of Identity Politics is finally eating its poisonous tail. Indeed, almost as if having seen the collapse in the recent approval polls, Biden’s handlers made some very persuasive phone calls to the Fed. After all, only something as ridiculous – and serious – as steady political pressure can explain the unprecedented U-Turn by the Fed chair, one which even shocked Powell’s own mouthpiece, Nikileaks, who commented on the “Powell pivot” saying “what a difference two weeks can make.”
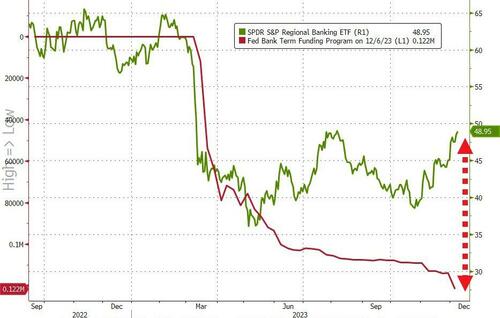
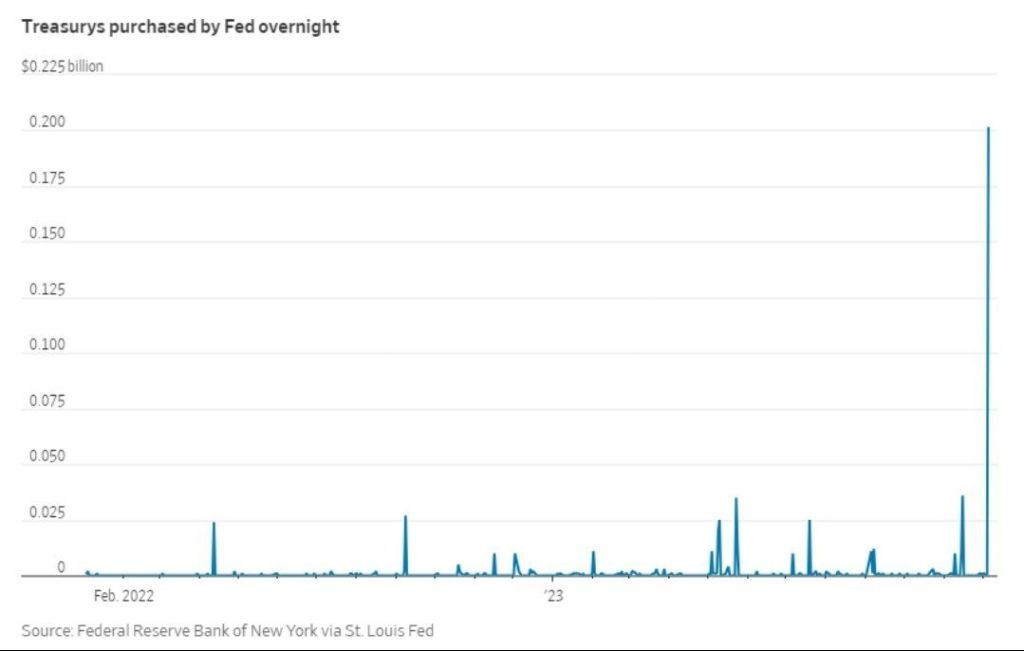
But markets are behaving as if The Fed will begin cutting rates. Look at the US 2-year Treasury yield on Wednesday AFTER the Fed minutes were released.

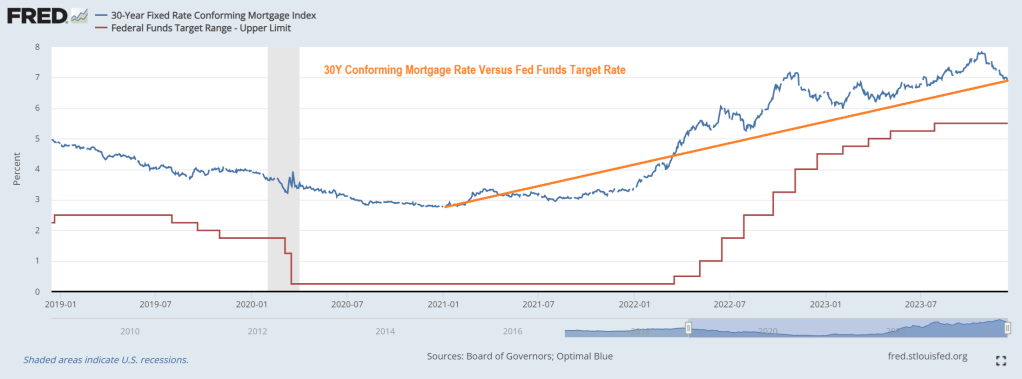
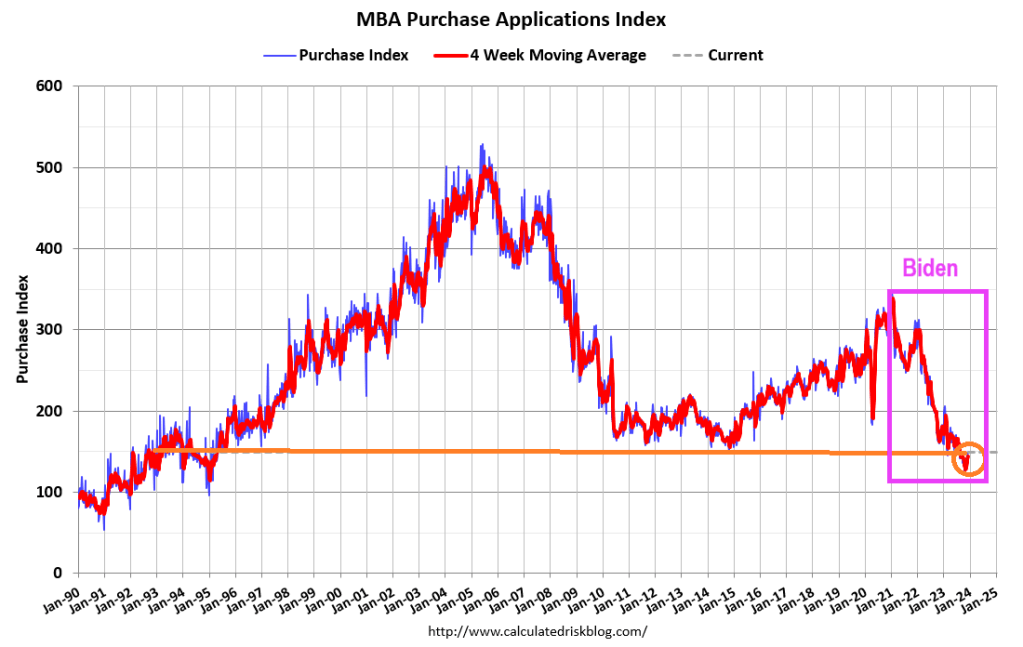
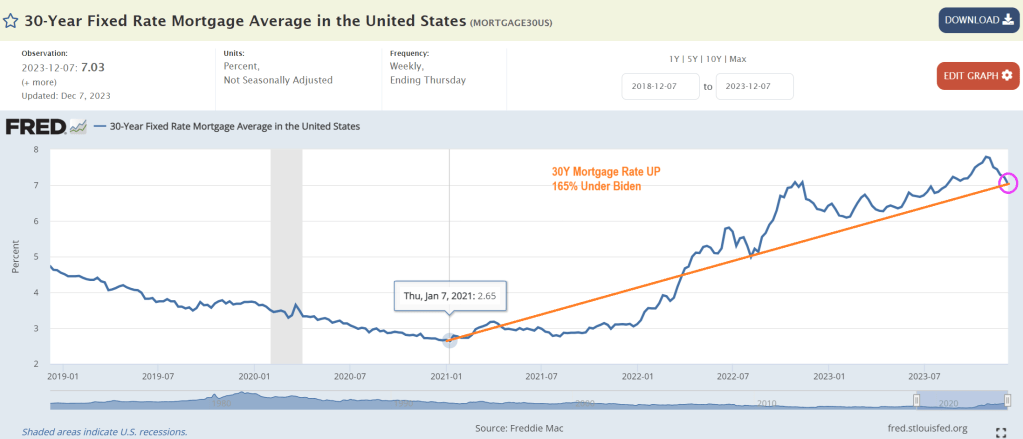
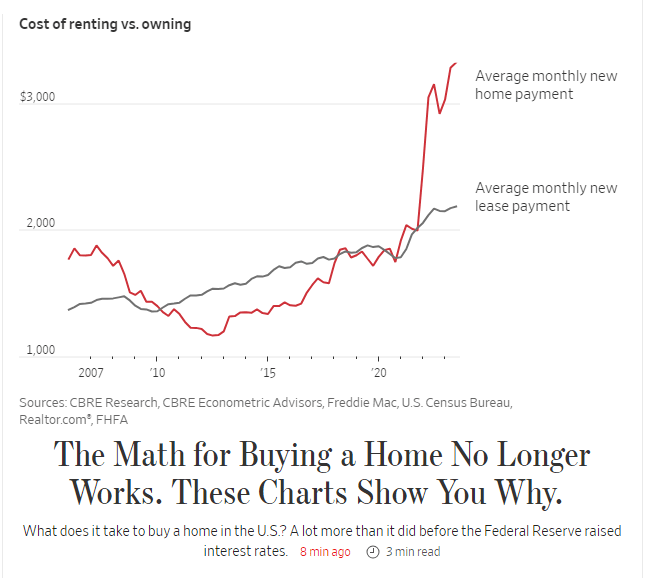
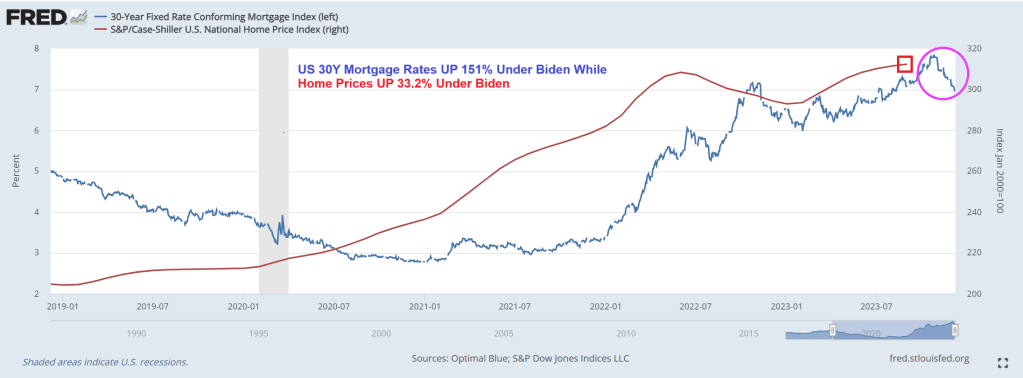
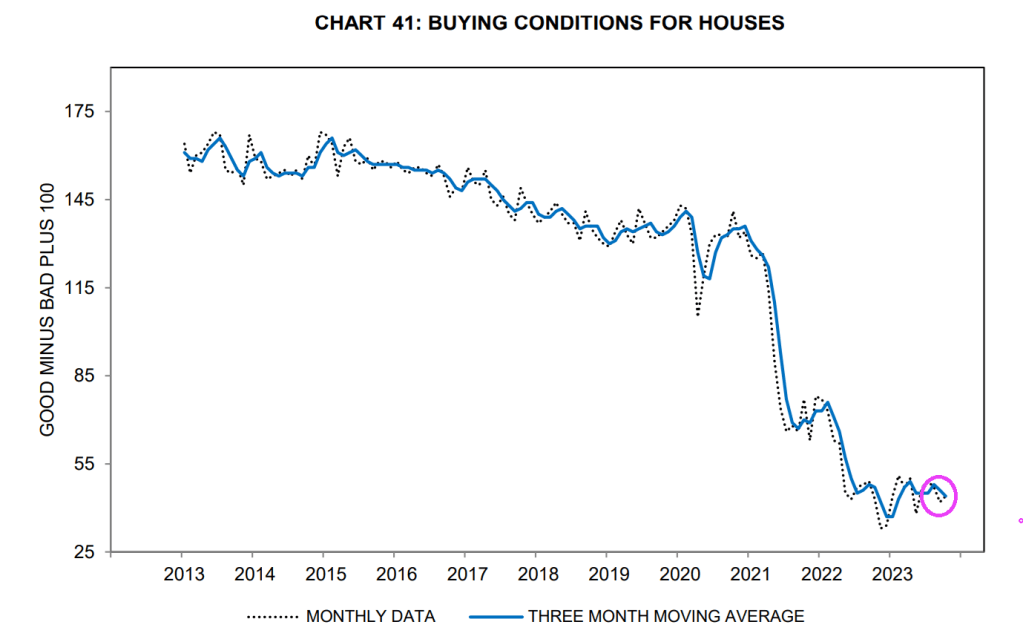
Bear in mind that mortgage rates are up 149% under Biden. And mortgage payments up 88%. Yikes!
Everything is NOT beautiful, according to investors.
Welcome to the REAL Snake Hole Lounge: The Federal Reserve. And their famous “Snake Juice!” Now forecast to be under 4% by 2025!!


You must be logged in to post a comment.