Jobless Claims Rise As Layoffs Soar At Fastest Pace (UP 410% MoM) Since Lehman Collapse (UP 427% On YoY Basis)

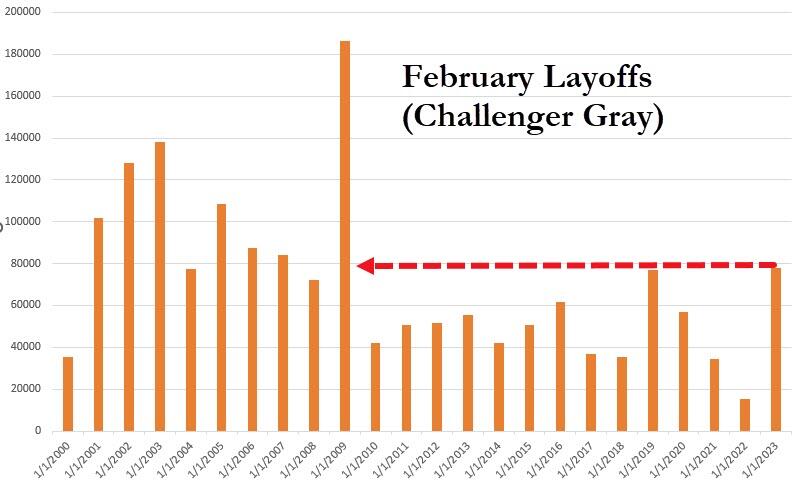
I am waiting for tomorrow’s employment report to see if the Biden Administration plays it straight or give another padded report like first half 2022. But in the meantime, according to Challenger Gray & Christmas, U.S.-based employers announced 77,770 job cuts in February. It is 410% higher than the 15,245 cuts announced in the same month last year.

February’s total is the highest for the month since 2009…

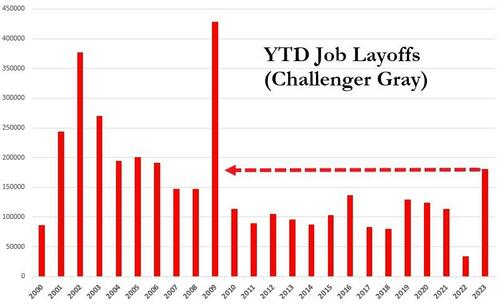
So far this year, employers announced plans to cut 180,713 jobs, up 427% from the 34,309 cuts announced in the first two months of 2022. It is the highest January-February total since 2009

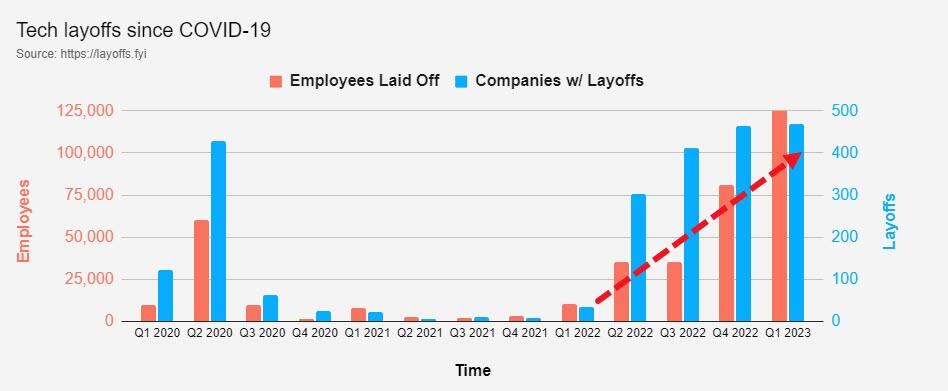
While many of the job cuts is coming in the tech sector,

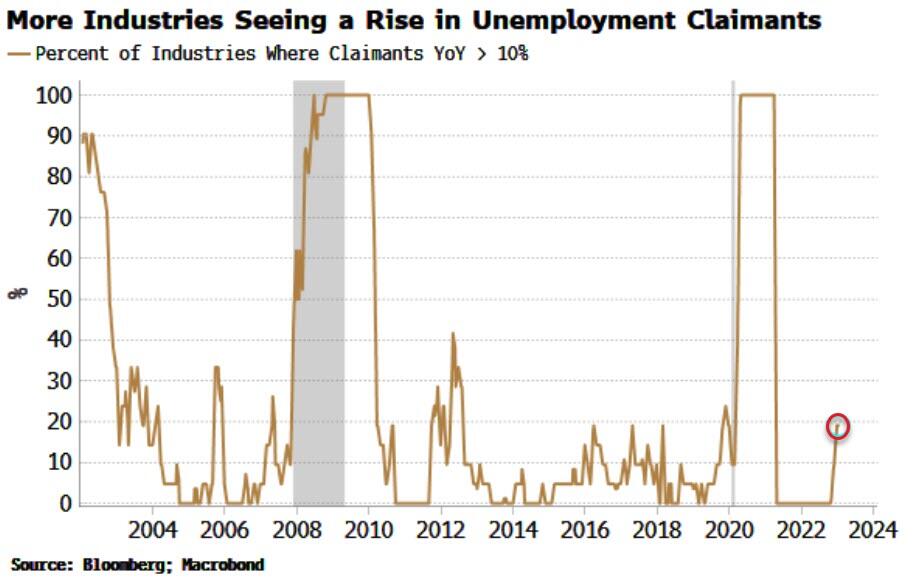
we are seeing more industries reporting a rise in unemployment claims.

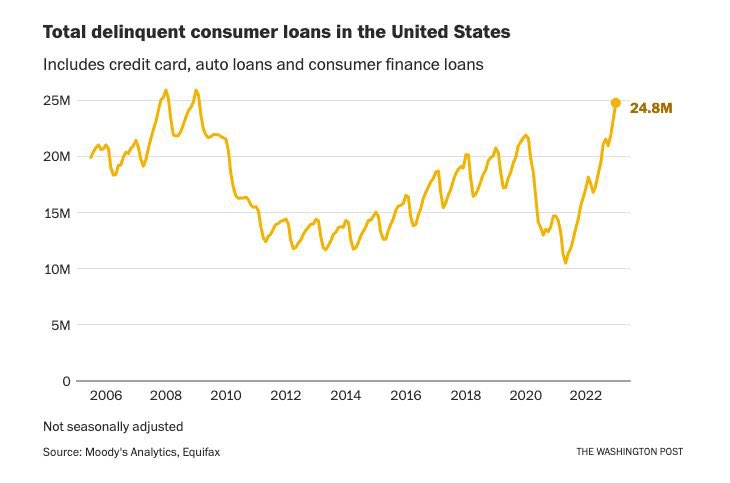
And then we have total delinquent consumer loans at 24.8 million. Highest since 2009.

I wonder if the answer to tomorrow’s employment report lies in one of the nine boxes of Biden’s documents taken from a Boston office?

Slippin’ Into Darkness! US Treasury Yield Curve Descends To -108 BPS (169 Days Of Inversion) As US Mortgage Rate Hits 7.11% (Fed No Longer Low Riding Interest Rates)

Slippin’ into darkness! The US Treasury 10Y-2Y yield curve, that is.

At the same time that the 10Y-2Y yield curve inverts to -108 basis points, Bankrate’s 30-year mortgage rate has risen to 7.11%.

Now that The Federal Reserve is no longer low riding interest rates, I expect to see a cooling of the US economy.

Price Of Insuring Against US Debt Default Highest Since Last Debt Ceiling Crisis In 2013 (Debt Up 88% Since The Last Crisis, $182 In Unfunded US Liabilites)

The last US debt crisis occured in 2013 when Congress finally raised the debt ceiling … and kept on borrowing and spending, But if you thought that a debt crisis would scare Congress (and the Administration) into balancing the Federal budget, you would be wrong. In fact, since the 2013 debt crisis, Federal debt is up 88% (+$14.7 TRILLION over the last 10 years).

And with the massive growth in Federal debt under Obama, Trump and Biden has resulted in an explosion in interest payments on the Federal debt.

And with $182 TRILLION in UNFUNDED liabilities, the debt issuance won’t stop.

Let’s see what is in Treasury Secretary Janet Yellen’s bag of tricks.

LIBOR cracked 5% for first time since 2007.

And the US Treasury 10Y-2Y yield curve is the most inverted since 1981.

Is Janet Yellen the “evil woman” from Crow’s song?

Sink The Economy! S&P 500 Down -6% Since Fed Started Raising Rates On May 4, 2022, Equity REITs Down -16% (Pension Pain From Interest Rate Increases)

Interest rates are an important driver of the economy and financial markets. And what has happened to the S&P 500 index since The Federal Reserve started raising their target rate on May 4, 2023 to fight surging inflation?

Since that fatal day, the S&P 500 index has fallen -6% and equity REITs (commercial real estate) has fallen -16%.

What about returns on US Treasuries and Mortgage-backed Securities (MBS)? Same thing. PAIN!

Although The Fed has pledged to keep raising rates to fight inflation (and further decimate retirement accounts), investors are pointing to a peak (terminal) Fed rate of 5.44% at the September 2023 FOMC meeting. Then rate cuts following the September 2023 meeting.

Of course, much of the blame belongs to former Fed Chair Ben (QE) Bernanke and current Treasury Secretary Janet “Too Low For Too Long” Yellen who never met a Fed rate hike that she liked. But Yellen LOVES giving away US taxpayer dollars … to Ukraine.

US Mortgage Rates Rise To Over 7% As Fed Tightens Monetary Noose (Is Powell Chanelling Volcker?)

Yesterday’s inflation report (in the form on skyrocketing labor costs) helped lead Bankrate’s 30-year mortgage rate to over 7% … again.

Here is yesterday’s horrible unit labor costs YoY chart showing the fastest growth in labor costs since 1982 and Fed Chair Paul Volcker. Jerome Powell, the current Fed Chair is trying to reduce the Bernanke/Yellen/Powell monetary stimulypto (with an extra dose of “sugar” from the Covid outbreak).

The good news is that the 10-year Treasury yield is down -7.3 basis points this morning.

Here is The Fed’s Open Market Committee (FOMC) trying to summon Paul Volcker to help them figure out how they got inflation so wrong.

Inflation Alert! US Unit Labor Costs Soar in Q4 2022 To 3.2%, 2x Expectation Of 1.6%, UP 6.50% YoY (The Worst In 30 Years)

Despite Treasury Secretary Janet Yellen claiming that inflation was only transitory and likely to disappear, we are seeing continued inflation. Now we see that Unit Labor Costs are up 3.2% QoQ for Q4 2022.

Even worse, US unit labor costs rose 6.5% on a year-over-year (YoY) basis, the WORST since 1982.

And yes, Q4 2022 unit labor costs are up 2x the expectations.

In normal times, The Federal Reserve would raise rates to cool down the economy. The Taylor Rule suggests a Fed target rate of 10.59% versus the current Fed rate of 4.75%. A long way to go!!

Damn it, Janet!

Dazed And Confused! Treasury Flows Show Bullish $2.5 Billion Shift to ST Sovereigns Versus S&P 500 (Credit ETFs Hammered by Record Outflows of Almost $12 Billion As Fed Worries About Inflation)

The Federal Reserve is dazed and confused about inflation.

As The Federal Reserve reaffirms their draining of the monetary punch bowl, we are seeing investors flock towards the bond market. Particularly the iShares Short Treasury ETF. $2.5 BILLION to be exact.

Meanwhile, credit ETFs are hammered by record outflows of almost $12 Billion.

The reason why? Inflation remains elevated which is leading The Fed to keep their foot on the monetary brake pedal.

I’m an economist.

Mortgage Purchase Demand Decreases, Lowest Level Since 1995 As Fed Removes Punch Bowl (Punch Bowl To Dust Bowl)

Today’s mortgage application (demand) numbers from the Mortgage Bankers Association was disappointing to say the least. Mortgage purchase demand just sank to it lowest level since 1995.

Typically, mortgage purchase applications peak in May or June of each year before beginning their annual lemmings drive downwards. But this year is seeing a early turn for the worse.

The unadjusted Purchase Index decreased 3 percent compared with the previous week and was 44 percent lower than the same week one year ago. The Refinance Index decreased 6 percent from the previous week and was 74 percent lower than the same week one year ago.

The Fed is hell bent on removing the punch bowl to fight inflation. Looks like Biden’s economic plan is turning the punch bowl into a dust bowl.

Case-Shiller National Home Price Index Cools To 5.76% YoY As Fed Tightens The Monetary Noose (But Only Seattle And San Francisco Have Negative YoY Price Changes, All 20 Metro Areas Fell In December From November)

The December CoreLogic Case-Shiller home price indices are out … for December 2022. And it shows that the CS National home price index growth continues to slow as The Fed tightens its monetary noose. December’s YoY growth was 5.76%.

Only Seattle and San Francisco experienced negative growth in home prices on a year-over-year basis. All of the top twenty metro areas experience negative month-over-month price declines from November to December.

Terminal Velocity! Fed Implied Terminal Rate Now 5.363% At July ’23 FOMC Meeting As US GDP Report Revised Lower On Weaker Consumer Spending In Q4 ’22 (GDP PRICE Index Revised UP To 3.9%)

Yesterday, we saw The Federal Reserve release the minutes of the last meeting. In a nutshell, The Fed is going to keep raising rates.

The terminal Fed Funds target rates is now 5.363% for the July FOMC (Fed Open Market Committee) meeting in 2023.

This comes as US Q4 GDP was revised lower on weaker consumer spending, revised downward to 1.4%

With the revision of Personal Consumption, real GDP was revised downward to 2.7% annualized QoQ.

The Taylor Rule estimate for The Fed Funds Target rate is 10.15%. The Fed is only at 4.75%, so there is a long way to go! Except that The Fed doesn’t follow any useful rule like the Taylor Rule. Just the “seat of the pants” rule.