No, not the Klaus von Bulow type of “reversal of fortune” (when he killed his wife). I am talking about a reversal in fortune for America.
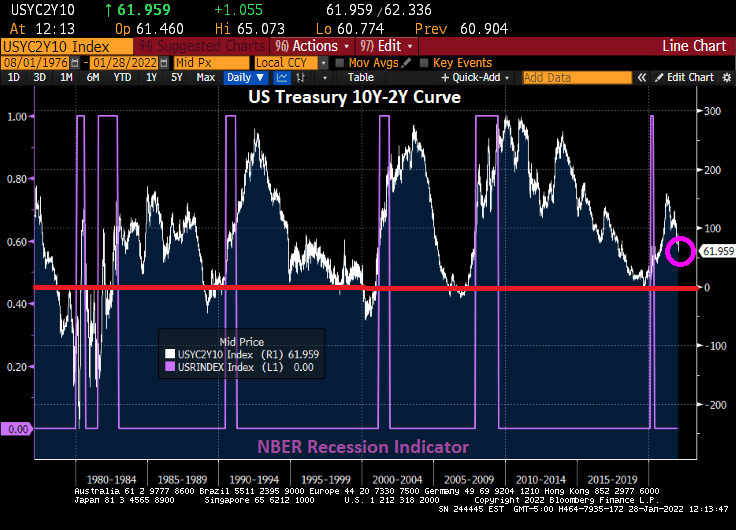
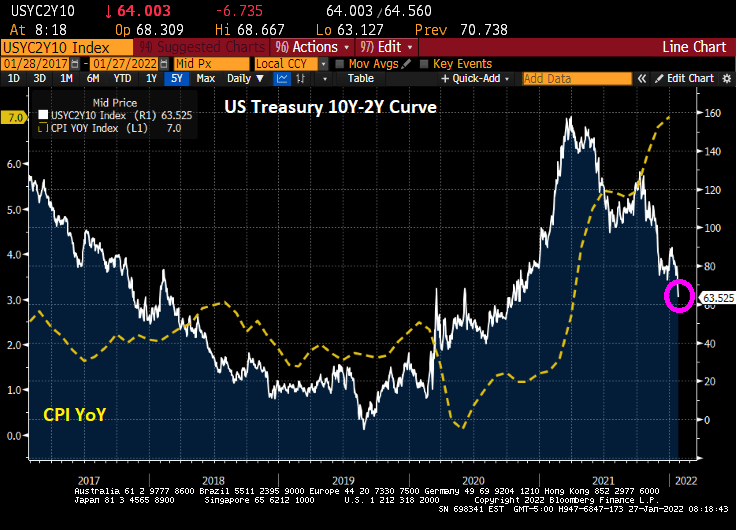
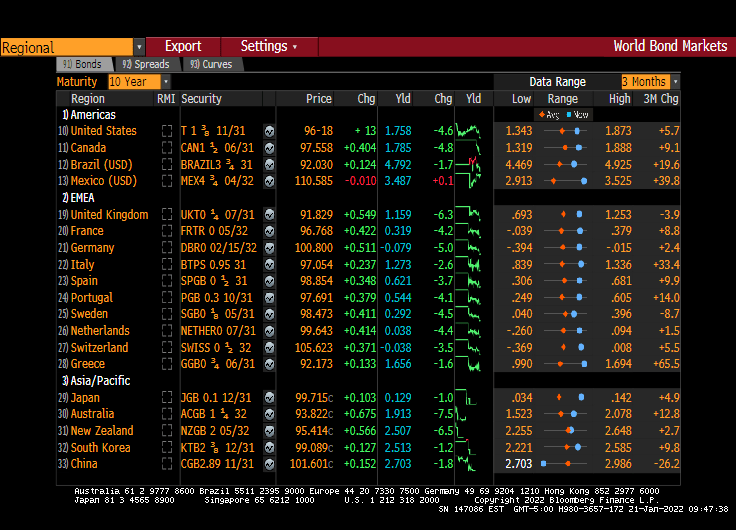
Let’s look at the 10Y-2Y Treasury curve. It typically falls below 0 basis points before every recession. Except the mini-COVID recession of 2020. But notice that the Treasury curve did not recover from the COVID recession as it typically did. More along the lines of 1984-1985.
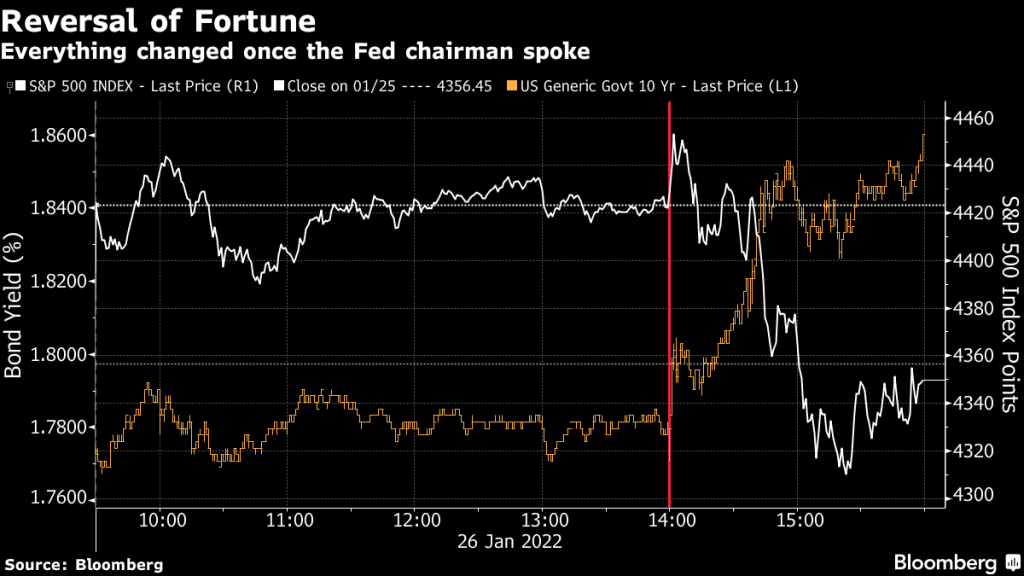
Speaking of Reversal of Fortune, everything changed once Fed Chair Powell started to speak after Tuesday’s FOMC meeting.
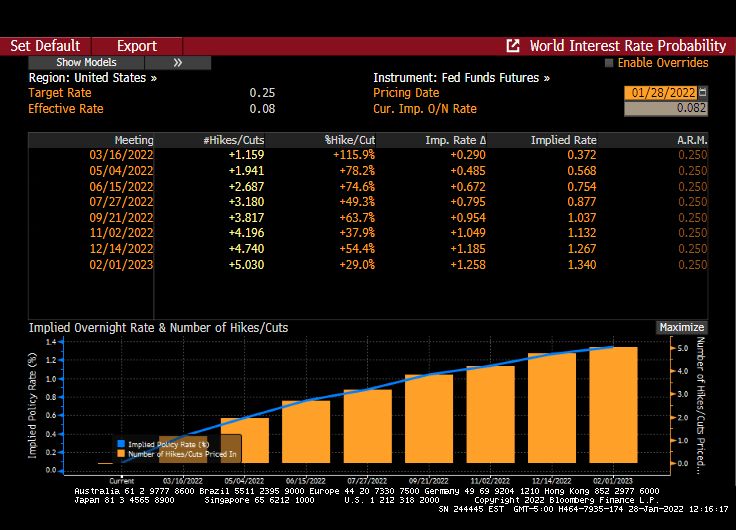
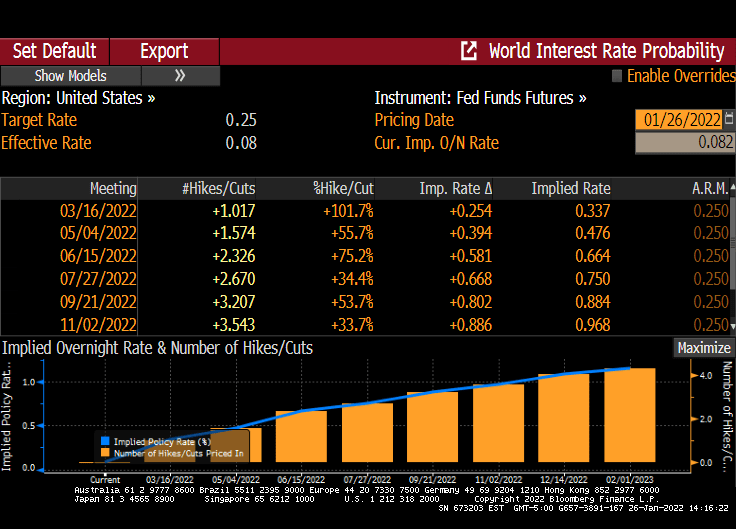
Hmm. Midterm elections, possible Russian invasion of The Ukraine, further problems in China, etc. While The Fed Funds Future data implies that The Fed may raise their target rate 5 times over the coming year, we’ll see.
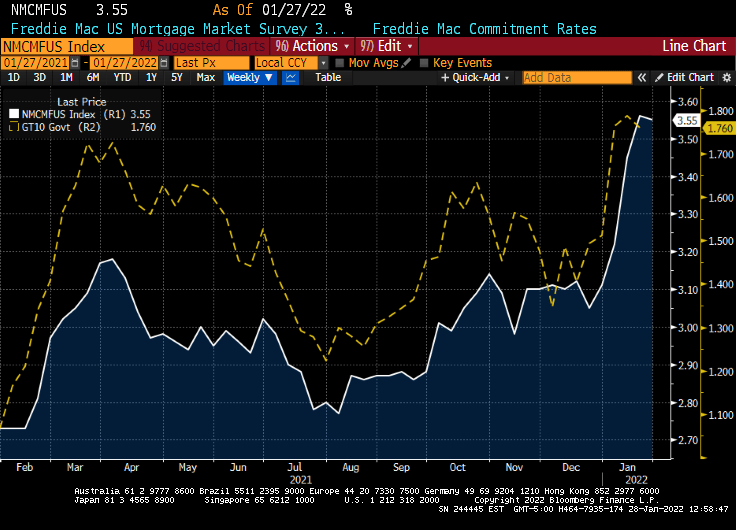
If 2021 was a great year for the US housing market, 2022 faces “a new normal” marked by a slowing down of home price rises, job layoffs in the mortgage industry, and concerns over rising inflation and interest rate hikes, according to Douglas Duncan (pictured), Fannie Mae’s senior vice president and chief economist.
Duncan said “a shift” was underway in the market and the wider economy, which would result in far more moderate home price appreciation, expected to be between 7% and 7.5% this year due to the ending of fiscal and monetary stimulus.
“One of the elements of the shift is that you’re going to see house prices up, but not nearly as far as they were in the last two years because that was driven hugely by the fiscal and monetary stimulus (now) being removed,” he told MPA.
Ominously, he added that low interest rates “may never be seen again”. Or at least until Biden appoints more doves to The Federal Reserve Board of Governors.
Here is a lesson in Bidenomics. “Going Green” sounds great to some (like Al Gore, Leonardo DiCaprio and Greta Thunberg), but there are costs to not growing America’s energy supply.
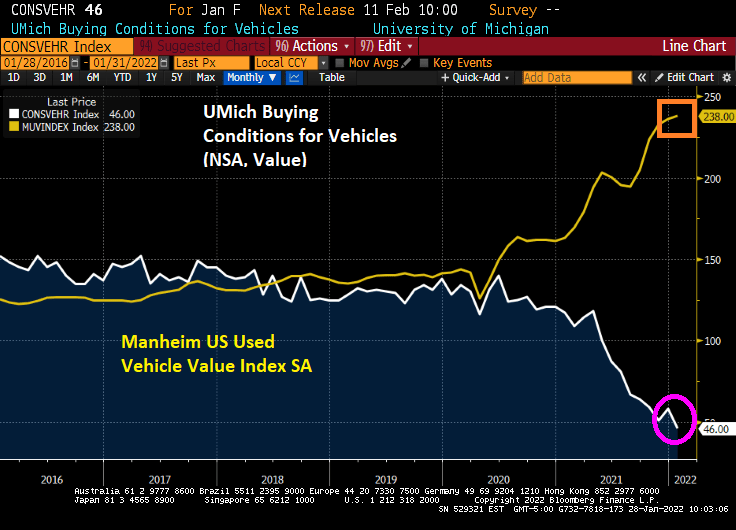
Rising energy costs have helped create the rise in consumer prices and inflation. Not to mention chip shortages for car and trucks. The University of Michigan conditions for vehicles plummeted to 46 (100 baseline) as used vehicles prices sky rocket.
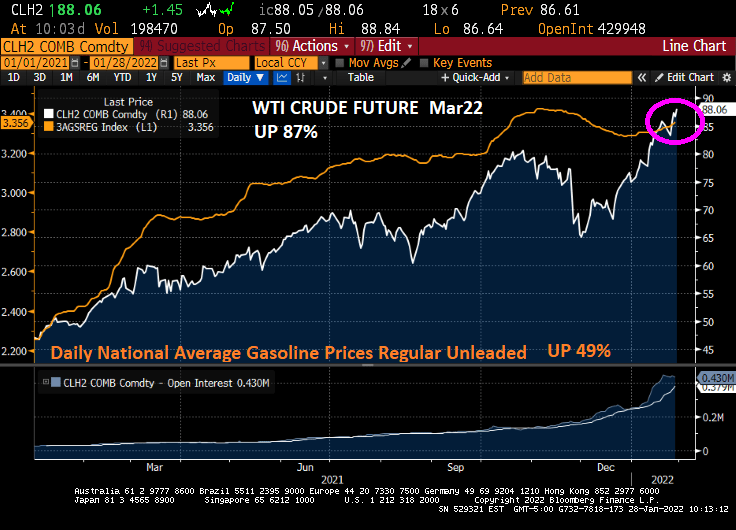
Under Biden’s reign of error, West Texas Crude futures prices have risen 87% (regular gas prices are up 49% even with Biden’s releasing two days of supply from the Strategic Petroleum Reserve.
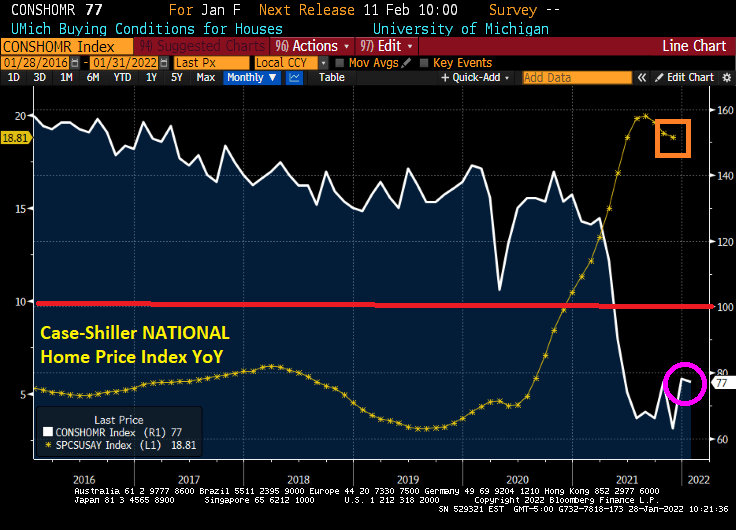
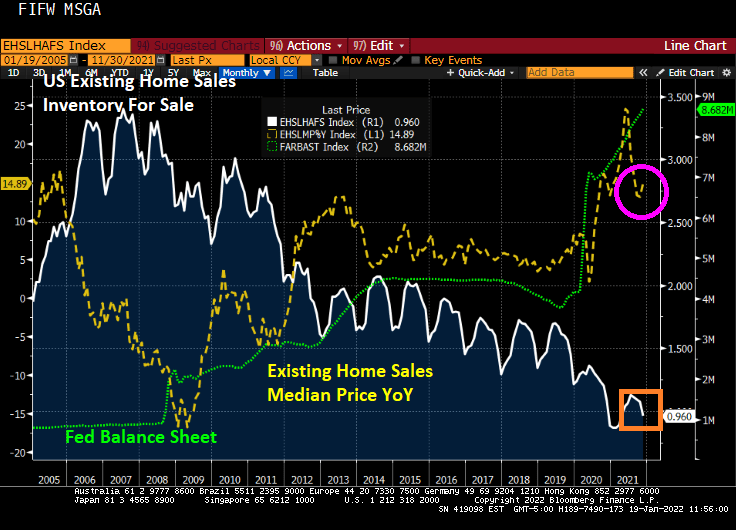
On the housing front, the University of Michigan buying conditions for houses fell to 72 (baseline of 100) as home prices are roaring at a 18.81% YoY clip.
To paraphrase the comic strip “Gasoline Alley,” “Unca’ Joe, what have your done t’ US?”
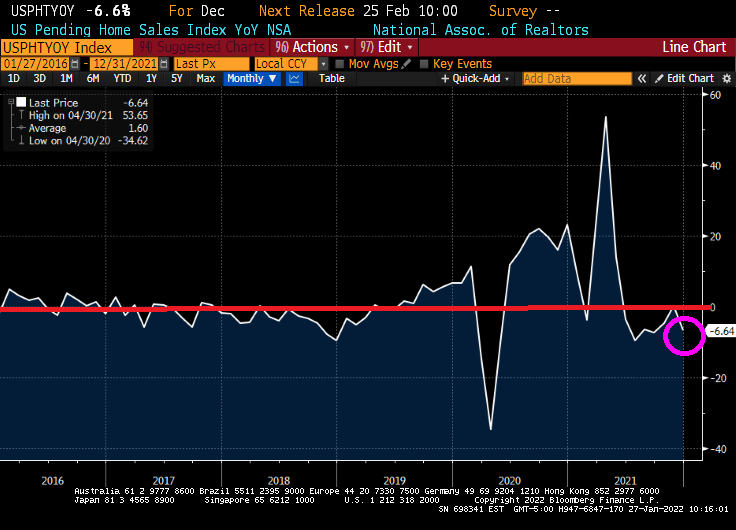
Pending home sales in the USA tanked 6.64% YoY. Yes, it was for December, but down 6.64% YoY means that pending home sales are lower than last December.
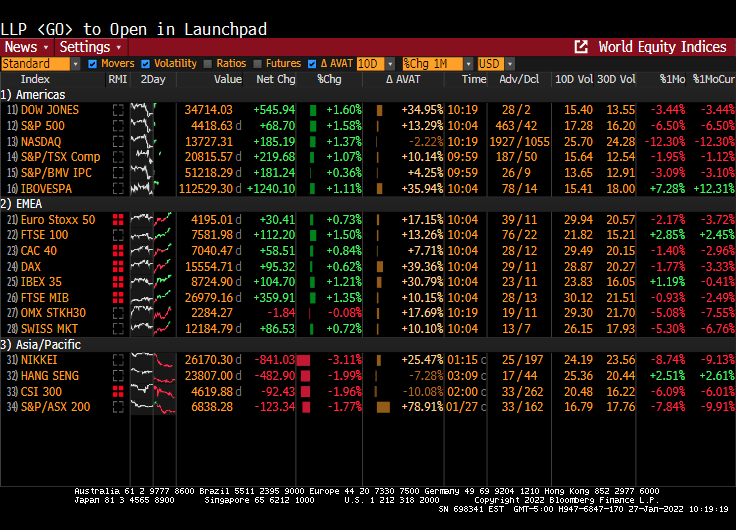
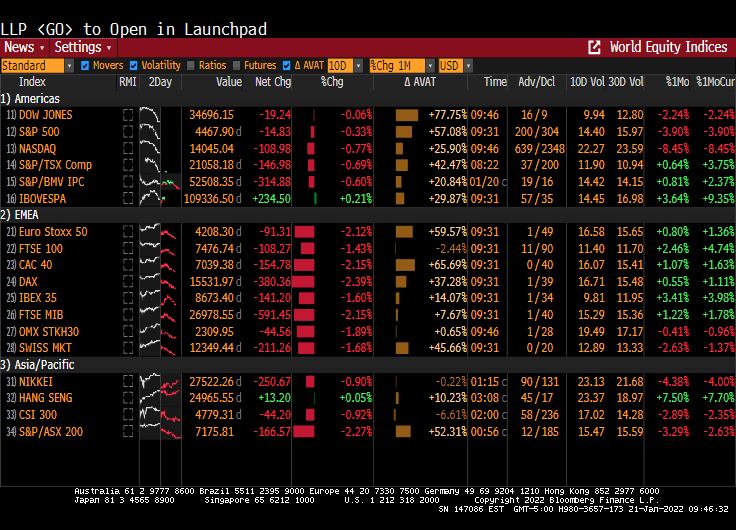
And the stock market was up across the board as Powell refused to take his foot off the monetary gas pedal.
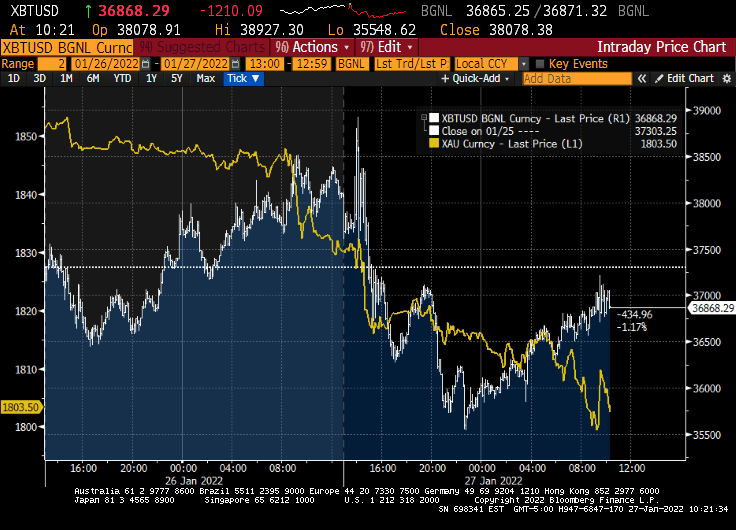
Gold is down along with Bitcoin for you ALT investment types.
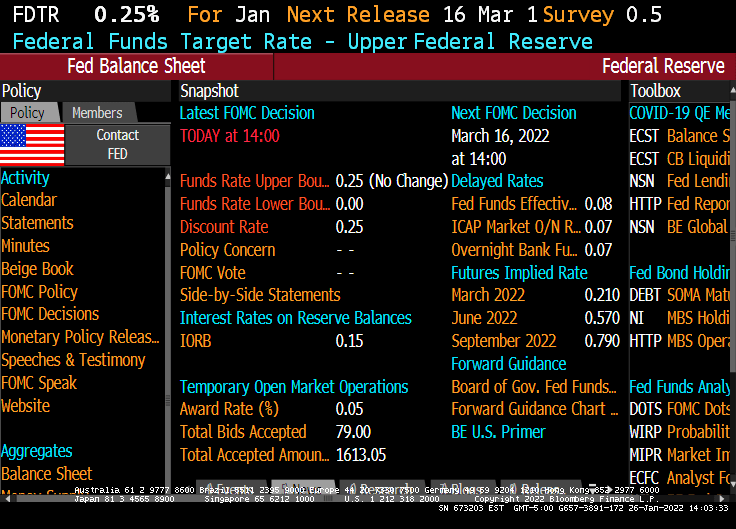
Yes, The Federal Reserve could have raised their target rate at their January meeting, but chose not to raise rates. Instead, Chairman Powell said that rate increases are a comin’!
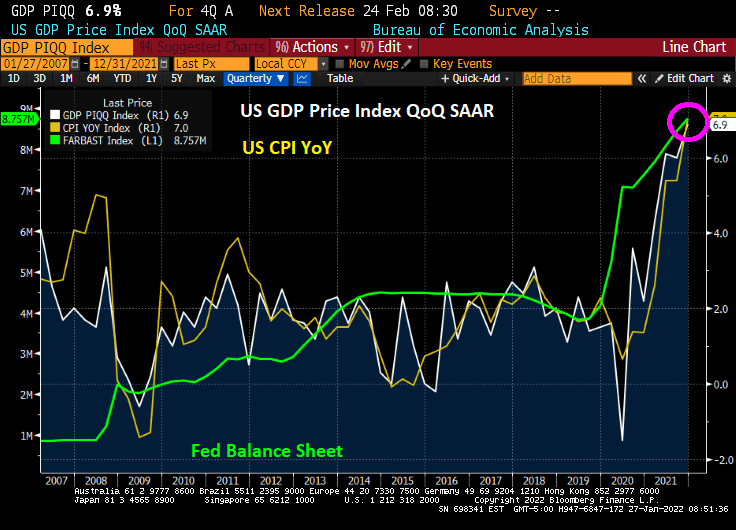
I hope Powell wasn’t hoping for a slowdown in inflation, because today’s Q4 GDP report showed a surge in GDP to 6.9% QoQ. But with that GDP surge we also got a surge in prices paid by consumers to 6.9% as well. Thanks to the continuing massive Federal stimulus being poured into markets.
Despite the positive news on Q4 GDP, we are still seeing 7% inflation and a diving 10Y-2Y yield curve.
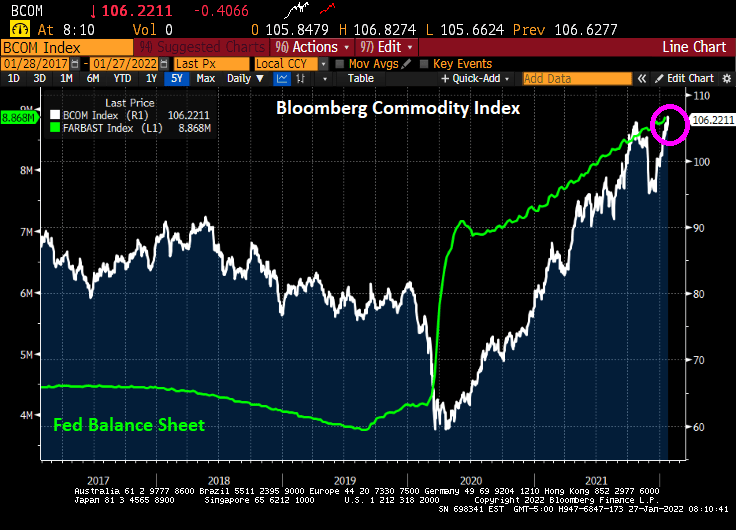
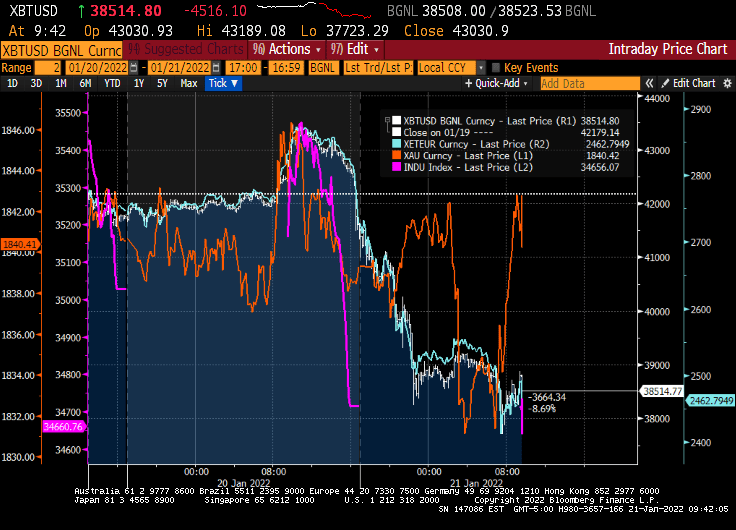
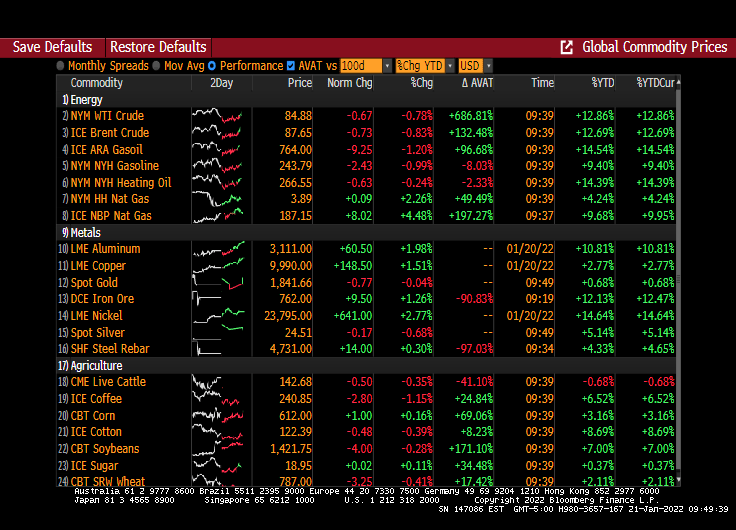
Along with that surprising GDP report, we are seeing the Bloomberg Commodity Index rising like a bat out of hell (RIP, Meatloaf).
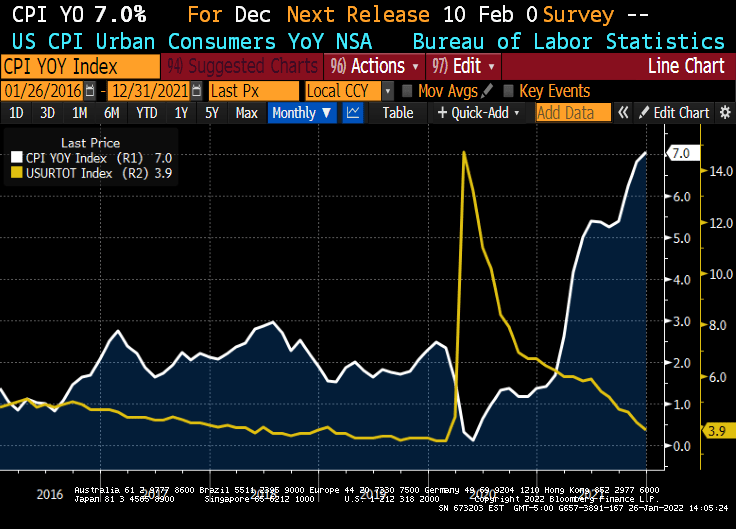
Despite inflation growing at 7% (versus The Fed’s target rate of 2%) and U-3 unemployment being only 3.9%, one would have thought that Jay and The Gang would have started increasing rates at the January meeting.
But nooooo. The Fed actually sat on their hands and did nothing.
What did The Fed say?
“The Committee seeks to achieve maximum employment and inflation at the rate of 2 percent over the longer run. In support of these goals, the Committee decided to keep the target range for the federal funds rate at 0 to 1/4 percent. With inflation well above 2 percent and a strong labor market, the Committee expects it will soon be appropriate to raise the target range for the federal funds rate. The Committee decided to continue to reduce the monthly pace of its net asset purchases, bringing them to an end in early March. Beginning in February, the Committee will increase its holdings of Treasury securities by at least $20 billion per month and of agency mortgage‑backed securities by at least $10 billion per month.“
According to The Fed Funds Futures data, the market is anticipating 1 rate increase at the March FOMC meeting. And another at the June FOMC meeting.
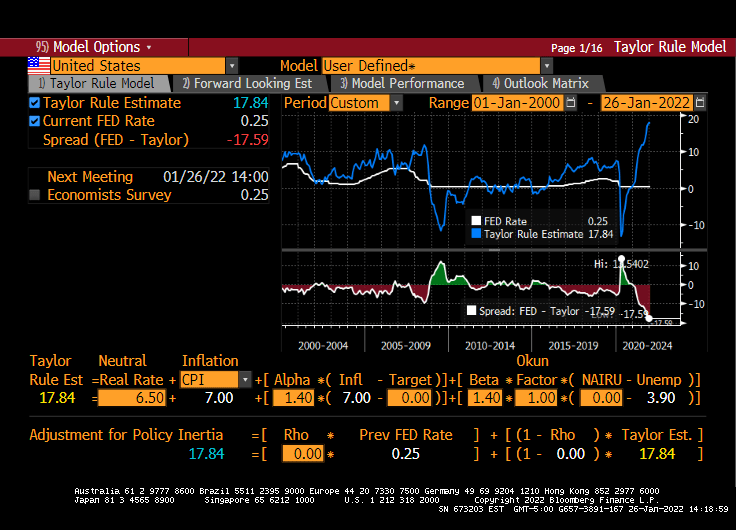
The Taylor Rule (not used by Jay and The Gang), suggests that The Fed should have their target rate at almost 18%! NOT 0.25%.
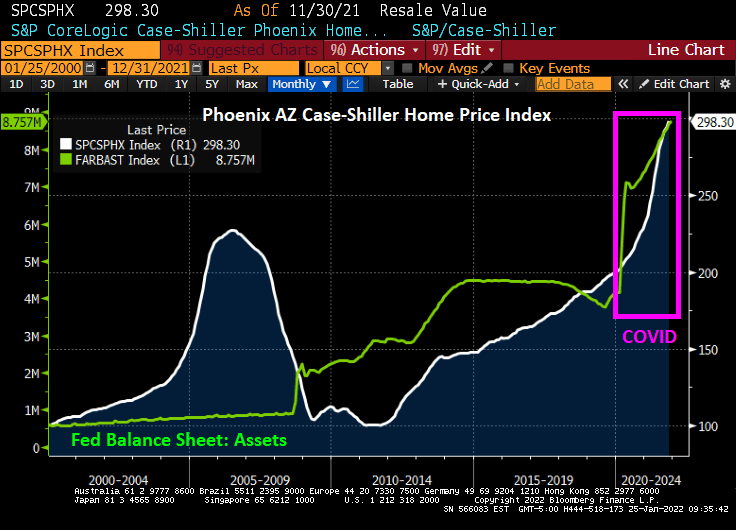
The Case-Shiller National home price index “slowed” to 18.81% YoY in November as The Fed continues its monetary stimulypto. Notice that The Fed is easing even when there is limited inventory available. Result? Hideous home price inflation.
Which metro area is growing the fastest, making housing even more unaffordable for renters? Phoenix AZ is growing at a 32.2% YoY clip while Washington DC is the slowest growing metro area at 11.1% YoY. The second faster growing metro area in Tampa FLA.
Phoenix AZ is growing at the fastest rate in the nation as The Fed still has its monetary stimulus at FULL SPEED AHEAD.
COVID and its omicron variant (as well as government reactions such as mask and vaccination mandates) are wreaking havoc on the global economy, but particularly in the USA where the Federal government dumped trillions of dollars in fiscal stimulus along with The Federal Reserve’s monetary stimulus into an economy not prepared for it. The result? INFLATION.
But global supply chains are nearing a turning point that’s set to help determine whether logistics headwinds abate soon or keep restraining the global economy and prop up inflation well into 2022, according to several new barometers of the strains.
Just a week before the start of Lunar New Year, the holiday celebrated in China and across Asia that coincides with a peak shipping season, economists from Wall Street to the U.S. central bank are unveiling a string of models in the hope of detecting the first signs of relief in global commerce.
From Europe to the U.S. and China, production and transportation have stayed bogged down in the early days of 2022 by labor and parts shortages, in part because of the fast-spreading omicron variant.
Among the big unknowns: whether solid demand from consumers and businesses will start to loosen up, allowing economies to finally see some easing in supply bottlenecks. Fresh indicators from the private and official sectors are in high demand because there’s still much uncertainty in industries overlooked by mainstream economics before the pandemic.
Once the realm of trade and industrial organization experts, supply chains “have shifted to center stage as a critical driver of sky-high inflation and a stumbling block to the recovery,” Bloomberg Chief Economist Tom Orlik said. “The profusion of new indices and trackers won’t unblock the arteries of the global economy any quicker. They should give policy makers and investors a better idea of how fast — or slowly — we are getting back to normal.”
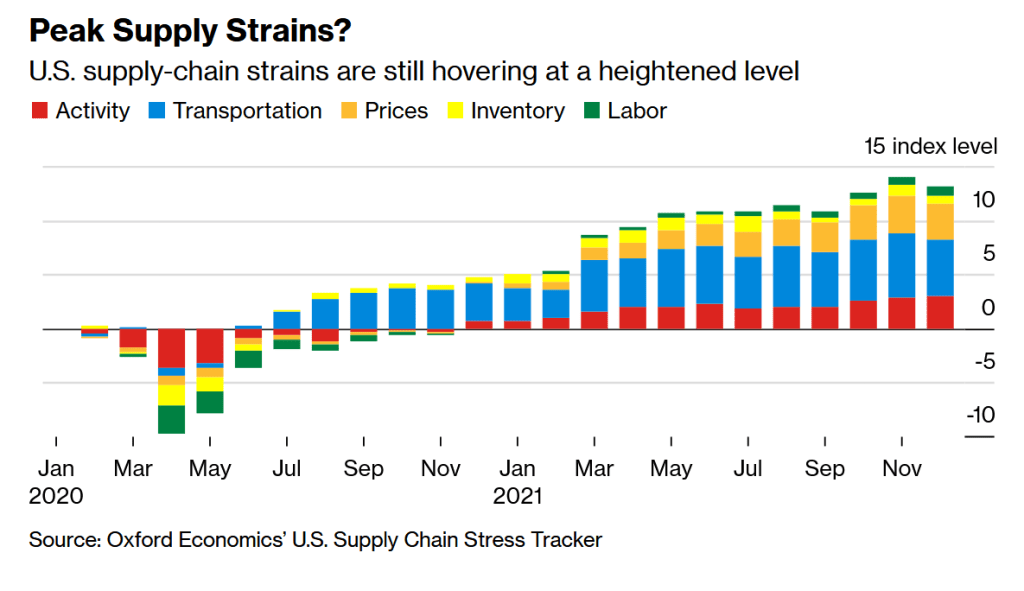
The Bloomberg Economics Index
Bloomberg Economics’ latest supply constraint index for the U.S. shows that shortages have trended modestly lower for six months. Even so, strains remain elevated, and the wave of worker absenteeism is adding to the problems at the start of 2022.
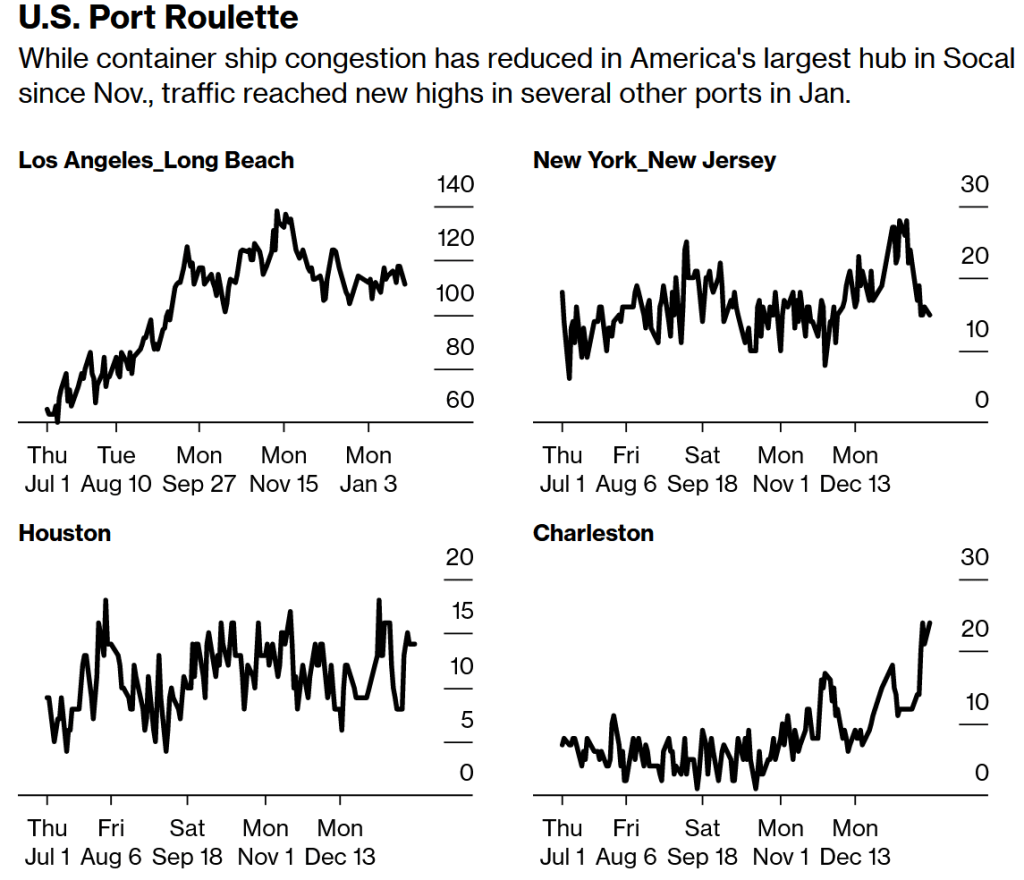
Port traffic tracked by Bloomberg shows container congestion continues to rankle the U.S. supply chain from Charleston, South Carolina, to the West Coast. The tally of ships queuing for the neighboring gateways of Los Angeles and Long Beach, California, continued to extend into Mexican waters, totaling 111 vessels late Sunday, nearly double the amount in July.
Source: Bloomberg, IHS Markit, Genscape
Note: Data counts the total number of container ships combined in port and in offshore anchorage area.
Kuehne+Nagel’s Disruption Indicator
Kuehne+Nagel International AG last week launched its Seaexplorer disruptionindicator, which the Swiss logistics company says aims to measure the efficiency of container shipping globally. It shows current disruptions at nine hot spots is hovering near “one of highest levels ever recorded,” with 80% of the problems happening at North American ports.
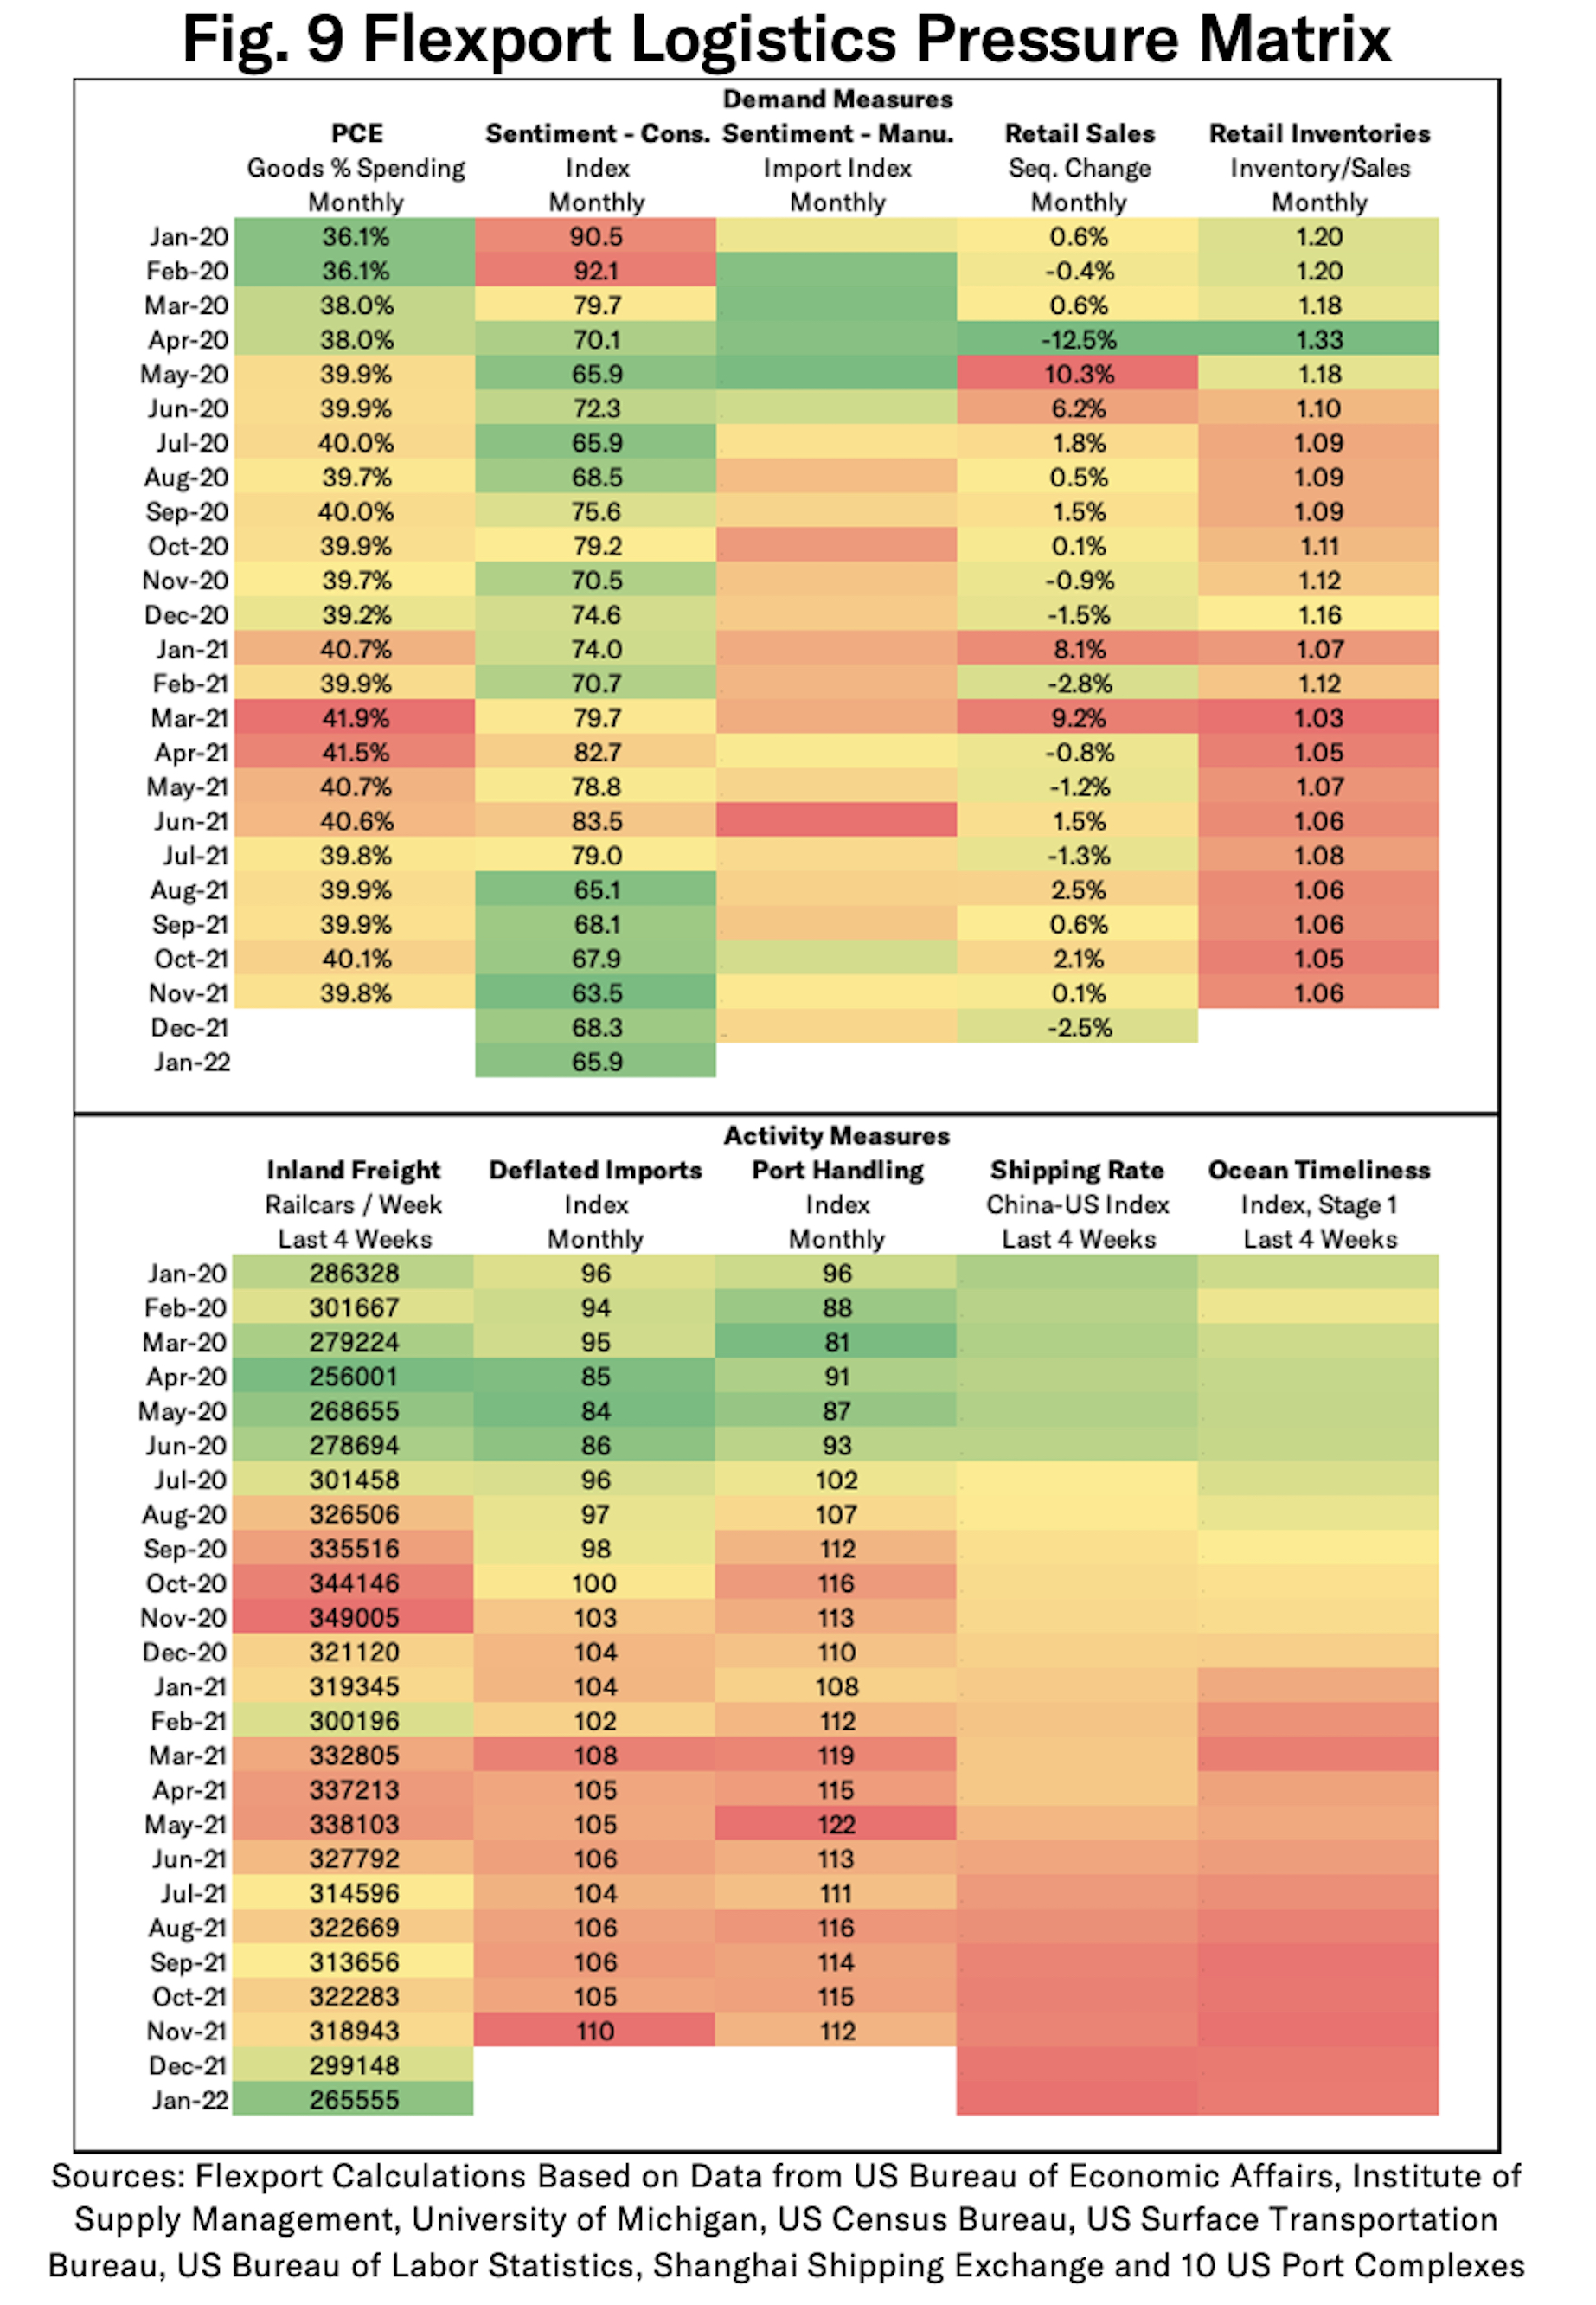
Flexport’s Guages
Another freight forwarder, San Francisco-based Flexport Inc., last year developed its Post-Covid Indicator to try to pinpoint the shift by American consumers back to purchasing more services and away from pandemic-fueled goods. The latest reading released Jan. 14 “indicates the preference for goods will likely remain elevated during the first quarter of 2022.”
Flexport has a new Logistics Pressure Matrix with a heat map showing demand and logistics trends, and much of those numbers are still flashing yellow or red. Flexport supply chain economist Chris Rogers said in a recent online post that similar grids for Asia and European markets will be part of the research.
The Federal Reserve’s Stress Monitor
Adding their stamp to the burgeoning genre of supply stress indicators were three Ph.D. economists from the Federal Reserve Bank of New York, with the launch its Global Supply Chain Pressure Index. Rolled out earlier this month, it shows that the difficulties, “while still historically high, have peaked and might start to moderate somewhat going forward.” The New York Fed said it plans a follow-up report to quantify the impact of shocks on producer and consumer price inflation.
Morgan Stanley’s Index
Less than a week later came the Morgan Stanley Supply Chain Index. It lined up with the Fed’s view that frictions have probably peaked, though some of improvement ahead will come from a slowdown in the demand for goods.
“Supply disruptions remain a constraint to global trade recovery, but as firms continue to make capacity adjustments to address them, capacity expansion could mitigate these,” Morgan Stanley economists wrote in a report Jan. 12.
Citigroup’s Tool
Citigroup Inc. last week released research that was less optimistic yet complementary to the New York Fed’s work, which Citi said doesn’t factor the role of surging demand as a contributor to the supply disruptions. Sponsored Content The Collaboration Disconnect Atlassian
Co-written by Citi’s global chief economist Nathan Sheets, a former U.S. Treasury undersecretary for international affairs, the bank’s analysis “gives a more complete, and intuitive, picture of the current situation.” While strains may ease in coming months, Citi said, “these supply-chain pressures are likely to be present through the end of 2022 and, probably, into 2023 as well.”
The Keil Institute’s Flows Tracker
In Germany, the Kiel Institute for the World Economy updates twice a month its Trade Indicator, which looks at flows across the U.S., China and Europe. Its latest reading Jan. 20 shows that along the key trading route between Europe and Asia, there are 15% fewer goods moving than there would be under normal times. The last time the gap was that large was in mid-2020, when many economies were reeling from initial lockdowns, Kiel said.
More recently, “the omicron outbreak in China and the Chinese government’s containment attempts through hard lockdowns and plant closures are likely to have a negative impact on Europe in the spring,” says Vincent Stamer, head of the Kiel Trade Indicator, said in a post last week. “This is also supported by the fact that the amount of global goods stuck on container ships recently increased again.”
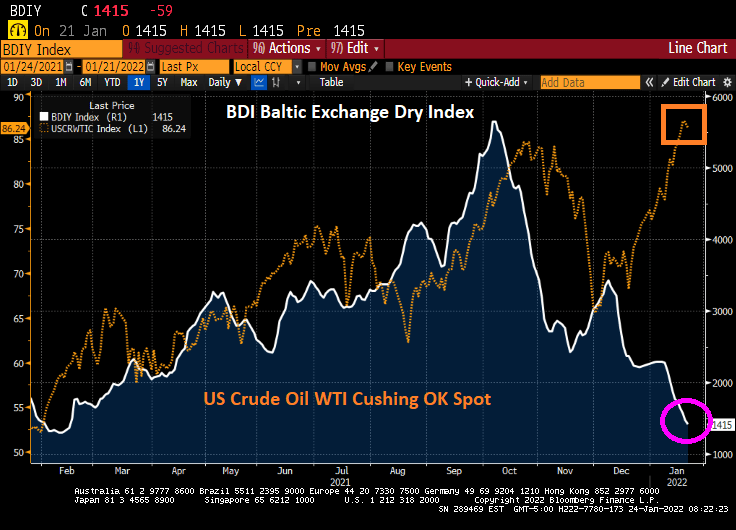
Baltic Dry Index
The Baltic Dry shipping cost index indicates that costs for shipping materials such as iron ore have decline to where it started under Biden, despite West Texas Crude Oil spot prices begin considerably higher thanks to Biden’s anti-fossil fuel policies.
So as the world comes out of Omicron (and whatever COVID variant rises to take its place), we should see a normalization in the supply chain. And with Intel building a new chip factory in New Albany Ohio (aka, outskirts of Columbus). the supply chain woes will eventually subside.
Then again, there is always the Russia-Ukraine tension that may erupt into a disaster. I suggest that President Biden sent Hunter Biden to Moscow to negotiate on behalf of The Ukraine.
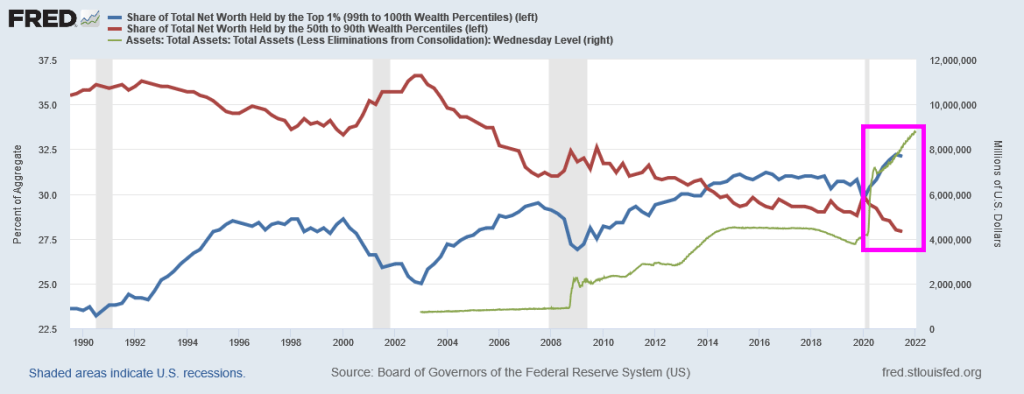
Massive Federal stimulus (both fiscal and monetary) have led to bidding wars among the wealthiest Americans. Despite clamoring for The Fed to increase rates and speed-up the shrinking of The Fed’s balance sheet, nothing has happened … yet.
(Bloomberg) — Home buyers willing to spend almost a $1 million are competing the most for a piece of the red-hot U.S. housing market.
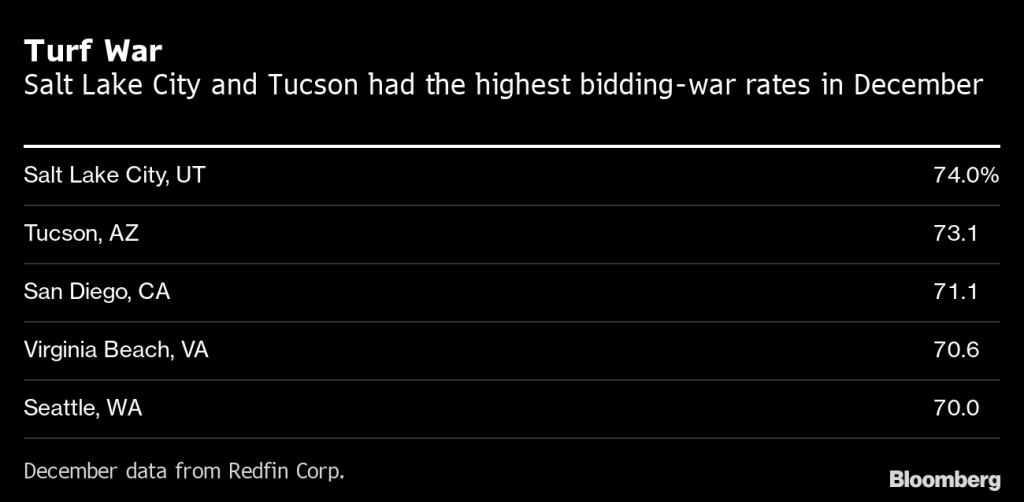
Homes priced between $800,000 and $1 million saw the highest rate of bidding wars at 64.6%, followed by 62% for homes between $1 million to $1.5 million and 61.7% for homes above $1.5 million, according to December data from Redfin Corp.
“Buyers should anticipate that they may not win a house until their sixth or seventh bid,” Candace Evans, a Redfin team manager in New York, said in a statement. “If you’re the type of person who falls in love with a house, this is not your market.”
Salt Lake City had the highest bidding-war rate of 37 U.S. metropolitan areas analyzed, with 74% of offers facing competition in December, the firm said. Tucson had a 73.1% bidding-war rate and followed by 71.1% for San Diego.
Prospective buyers are competing for homes as relatively cheap mortgage rates and a proliferation of remote-working opportunities in the wake of the Covid-19 pandemic boost demand for homes in smaller cities. The number of available homes in several of the hottest markets continue to shrink.
Nearly 60% of home offers written by Redfin agents across the U.S. faced competing bids in December, the firm said. It was the lowest rate in 12 months but an increase from 54% in December 2020 as pandemic-driven demand for housing remains strong.
Vacation homes, which are often pricey and have increased in popularity due to Covid-19, may have contributed to bidding wars in the high-end market, Redfin said. Townhouses had a bidding-war rate of 62% followed by 61.3% for single-family homes, the firm said.
Now its a race against the clock as potential home buyers try to beat Powell and the Gang as they raise mortgages rates.
Yes, Federal stimulus has made the top 1% increase their share of total net worth that includes $800,000+ homes.
If you look at the following chart, you can see multifamily (5+ unit) starts remain elevated (pink box) which is not surprising given that home prices at growing at 19.1% YoY nationally (orange circle) and REAL hourly earnings have declined (yellow triangle) thanks to reemergence of inflation after 40 years.
Then we have the humming dragon, rising mortgage rates, that will reduce housing affordability even further.


You must be logged in to post a comment.