Get Ready! Dash for $10 Trillion of Metals For Energy Transition Starts Now (Copper, Aluminum, Lithium, Silver, Rare Earths)

Get ready! The mad dash for metals is here!

  • Copper set to be most valuable opportunity in race to net zero
  • Electric vehicles and wind turbines are main demand drivers

Everything is a race when it comes to the energy transition. A race against time to reach net-zero emissions by the 2050 crunch point; a race to build enough wind turbines and replace gas-guzzling cars with electric vehicles; a race between superpowers to shore up domestic supply chains and capture the economic benefits of decarbonization.

There’s one common thread that runs through them all: the need for metals. A greener future is impossible without copper to expand the world’s electricity grids, lithium for batteries and aluminum for solar panel frames.

Companies are now hunting for more direct access to these essential raw materials as they recognize metals will form the backbone of the energy transition. General Motors Co., for example, announced at the end of last month that it will invest $650 million in Lithium Americas Corp. and help develop the Thacker Pass mine in Nevada. The automaker is also reportedly competing to buy a stake in the base metals unit of mining giant Vale SA, according to Bloomberg News.

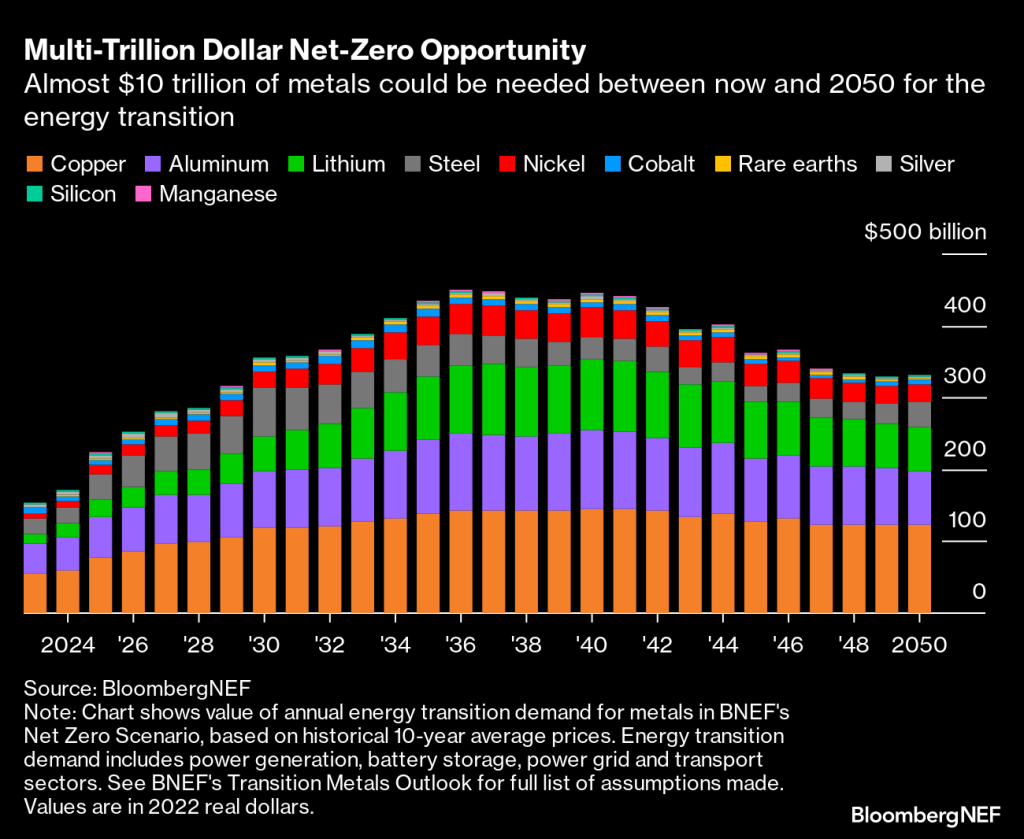
What exactly is driving this hunger for metals? Achieving a net-zero world will entail electrifying as much as possible. BNEF estimates the size of the global power grid will have to almost double to 152 million kilometers by 2050, requiring masses of steel, copper and aluminum. This means the expansion of grids will use the most copper out of all energy transition applications, coming in at 427 million tons between now and mid-century.

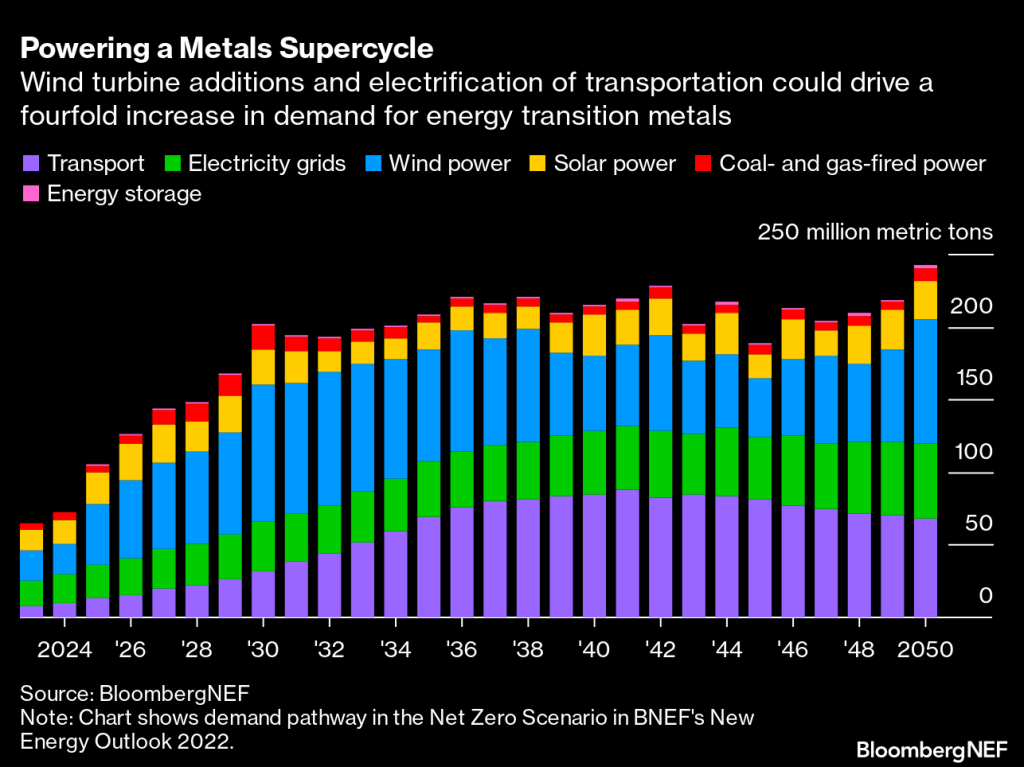
Clean electrons will need to flow through those grids, enabled by the scale-up of wind and solar power. Wind turbines are projected to consume the most metals overall by 2050 if the world gets on track for net-zero emissions. Today, steel accounts for nearly 90% of the materials used by weight in offshore wind and about 25% in onshore wind, although as turbines get bigger, they will use less steel on a per-megawatt basis. Consumption of rare earth metals such as neodymium will become more intense, however, as permanent magnet generators become more common in turbines.

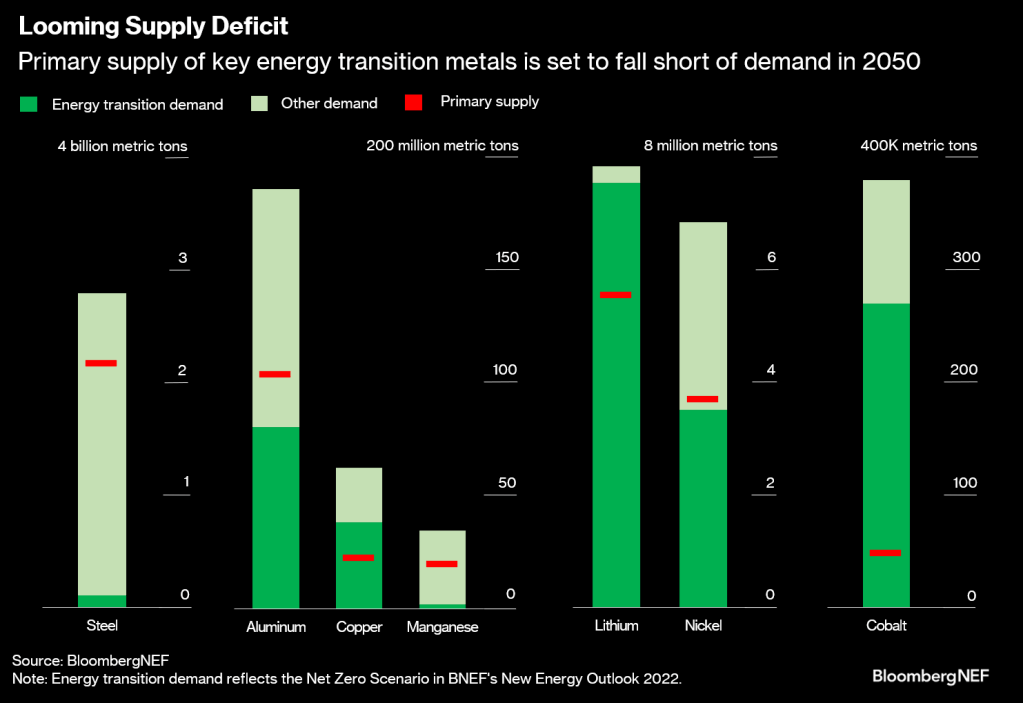
Rising demand for energy transition metals is essentially a given at this point. The real question is whether there will be enough supply. As things currently stand, lots of these metals, including copper and cobalt, are at risk of a shortfall in the coming decades unless current reserves can be supplemented with new geological discoveries and projects, and recycling of old material is stepped up.

Many countries have known resources of metals – in other words, natural occurrences of minerals in high concentrations and sufficient quantities. But not all of these resources have been turned into reserves that can be profitably mined yet. This requires time and investment to go through the exploration, discovery and feasibility stages, and these processes could be thwarted by policy.

Here are metals today.

So, people get ready! Whether you agree with green energy policies or not, it is where markets are headed. Personally, I am sticking to my gasoline guzzling cars until I am ordered not to drive them. Stated differently, if Joe Biden can drive a gas guzzling V-8 in a Chevy Corvette, why can’t I?

At least I didn’t leave classified documents in my garage.

Help US, McCarthy! Price of Insuring Against US Debt Default Remains Elevated As No End In Sight (Effective Rate Of Interest On US Mortgage Rate Rises)

Everyone seems to have amnesia about Joe Biden’s hatred of Social Security and Medicare. He has tried to cut Social Security, Medicare and Veteran’s benefits as a US Senator. In addition, it was Biden that led the charge to TAX Social Security benefits for seniors. Now Biden has pivoted and is claiming that Republicans are the ones that want to cut Social Security. Wow. Biden simply goes where the political winds blow.

Here is where we set today. The cost of insuring for a US debt default remains elevated as the US has hit its statutory debt limit. This is happening at the effective rate of interest on US mortgage debt is rising.

Help us McCarthy! Because Biden and Schumer don’t want to cut ANY spending.

We need somebody like Mr. Garvey from Key and Peele to lead the debt ceiling debate.

But never fear! Congress LOVES to spend your money, so will eventually raise the debt ceiling.

Just Like The Fed! Despite Cooling Inflation, Forecasts Of Fed Rate Hikes Increase To Peaking In July 2023

It’s just like The Fed to ignore what is going on and do something else.

The one statement that Biden made in his State of the Union Address that was factually accurate was that inflation is coming down. Of course, he then blew it by saying he inherited inflation from Trump which was not true. Headline inflation (CPI YoY) was only 1.4% when Biden was sworn-in as President and rose to 9.1% YoY by June 2021 before finally starting to decline.

But despite the cooling of inflation (and M2 Money growth), The Fed seems hell bent on increasing their target rate, now forecast by Fed Funds Futures to peak in July 2023 at 5.123% before pivoting.

The Fed’s themesong. Drinking with my low-companions, dancing with a woman that’s not my wife, laughing at a joke I’ve heard before, welcome to a night in their life.

US Treasury’s Disastrous 3-Year Auction! High Rate Rises To 4.073% As Allotment To Dealers And Brokers Collapses (Stop Through Yield Crashes To Lowest Level In Years)

After Jerome Powell raved about the strong US labor market and oddly ignored the staggering crowding-out of US interest payments on its massive debt, the US Treasury’s 3-year debt auction was … a Hinderburg moment.

First, the high yield at today’s auction of 3-year Treasury notes was 4.073%. This occured as the allotment to brokers and dealers collapsed along with M2 Money growth YoY.

Then we have this horrible chart of the 3Y auction stop through, crashing into uncharted waters. A stop-through indicates when the highest yield the Treasury sold in the auction is below the highest yield expected when the auction began – the “when issued” level.

Here is the rest of the auction story.

Strange Days! US Adds 517k Jobs In January While ADP Adds Only 106k Jobs (Avg Hourly Earnings At 4.4% YoY While Headline Inflation At 6.5%)

Strange days indeed!

Today’s jobs report from the Bureau of Labor Statists (BLS) was stunning. 517k jobs added! Very strange since the ADP jobs added report on Febuary 1st was only 106k. THAT is a huge discrepancy (probably a seasonal adjustment in the BLS reporting).

Average hourly earnings rose to 4.4% YoY. Too bad headline inflation is still roaring at 6.5%. So, the inflation tax is still overwhelming wage growth.

The spread between the January jobs report (BLS) and the ADP jobs added report (ADP) is similar to the infamous jobs report that the Philly Fed “corrected” (orange circle).

Here is the summary of the BLS numbers.

And on the strange jobs report, US Treasury 10-year yields are up 10+ basis points.

Where were the jobs added? How about “Hey Bartender!” since leisure and hospitality added 128k jobs in January.

  • Leisure and hospitality added 128,000 jobs in January compared with an average of 89,000 jobs per month in 2022. Over the month, food services and drinking places added 99,000 jobs, while employment continued to trend up in accommodation (+15,000).
  • In January, employment in professional and business services rose by 82,000, led by gains in professional, scientific, and technical services (+41,000). Job growth in professional and business services averaged 63,000 per month in 2022.
  • Government employment increased by 74,000 in January. Employment in state government education increased by 35,000, reflecting the return of university workers after a strike.
  • Health care added 58,000 jobs in January. Job growth occurred in ambulatory health care services (+30,000), nursing and residential care facilities (+17,000), and hospitals (+11,000).
  • Employment in retail trade rose by 30,000 in January, following little net growth in 2022 (an average of +7,000 per month). In January, job gains in general merchandise retailers (+16,000) and in furniture, home furnishings, electronics, and appliance retailers (+7,000) were partially offset by a decline in health and personal care retailers (-6,000).
  • Construction added 25,000 jobs in January, reflecting an employment gain in specialty trade contractors (+22,000). Employment in the construction industry grew by an average of 22,000 per month in 2022.
  • In January, transportation and warehousing added 23,000 jobs, the same as the industry’s average monthly gain in 2022. Over the month, employment in support activities for transportation increased by 7,000.
  • Employment in social assistance increased by 21,000 in January, little different from the 2022 average gain of 19,000 per month.
  • Manufacturing employment continued to trend up in January (+19,000). In 2022, manufacturing added an average of 33,000 jobs per month.
  • Employment showed little change over the month in other major industries, including mining, quarrying, and oil and gas extraction; wholesale trade; information; financial activities; and other services.

The source of the jobs miracle? Changes in how jobs are measured.

Changes to The Employment Situation Data |
| |
| Establishment survey data have been revised as a result of the annual benchmarking |
| process, the NAICS 2022 conversion, and the updating of seasonal adjustment factors. |
| Also, household survey data for January 2023 reflect updated population estimates. |
| See the notes at the end of this news release for more information.
|
|_________________________________________________________

Challenger Job Cuts Rise 440% In January As Fed Liquidity Shrinks (US Treasury 10Y Yield Down -3.5 BPS)

President Biden had better give his State of the Union Address before the economy worsens any more.

In January, the Challenger, Gray and Christmas jobs cuts index was a doozy. Jobs cuts rose 440%. This is happening as The Federal Reserve keeps its feet on the monetary brake pedal.

The Challenger report shows a big jump of 135.8 percent in layoff intentions to 102,943 in January, up from 43,651 in December and 440.0 percent higher than the 19,064 in January 2022. Many of the job cuts are in the tech sector, but job cuts are now spreading across the economy as a recession looms.

This morning, the US Treasury 10-year yield is down only -3.5 basis points, but it is Europe where the action is. UK is down -16.2 basis points and Italy is down -14.8 bps. UPDATE: US 10Y yield down -5.3 BPS, Italy 10Y down -29 bps.

Fed Slows Rate Increases, Raises Only 25 Basis Points, As Expected (Future Rate Hikes Projected To Slow As Inflation Slows)

The Federal Reserve slowed its drive to rein in inflation and said further interest-rate hikes are in store as officials debate when to end their most aggressive tightening of credit in four decades.

Policymakers lifted the Fed’s target for its benchmark rate by a quarter percentage point to a range of 4.5% to 4.75%. The smaller move followed a half-point increase in December and four jumbo-sized 75 basis-point hikes prior to that.

The unanimous decision by the Federal Open Market Committee was in line with financial market expectations.

Markets are forecasting a pivot after the June meeting in 2023.

The face of The Federal Reserve. Although Yellen is now Biden’s Secretary of Treasury.

US Mortgage Applications Drop 9% From One Week Earlier, Purchase Apps Up 7% From Previous Week But Down 41% From Same Week Last Year

The January mortgage applications book is closed. And we are off to another year of rising applications until May. Then the downhill slide.

Mortgage applications decreased 9.0 percent from one week earlier, according to data from the Mortgage Bankers Association’s (MBA) Weekly Mortgage Applications Survey for the week ending January 27, 2023.

The Refinance Index decreased 7 percent from the previous week and was 80 percent lower than the same week one year ago. The seasonally adjusted Purchase Index decreased 10 percent from one week earlier. The unadjusted Purchase Index increased 7 percent compared with the previous week and was 41 percent lower than the same week one year ago.

US mortgage rates have been steadily declining since November 2022.

Happenings Two Months Time Ago! US Case-Shiller National Home Price Growth Slows To 6.77% YoY In November As Fed Retreats (Down -0.54% Since October, 5th Straight Month Of MoM Price Declines)

The Case-Shiller index is out for November 2022. Too bad it is January 31, 2023. Call it “Happenings 2 Months Time Ago.”

On a year-over-year (YoY) basis, the Case-Shiller National home price index slowed to 6.77%. On a month-over-month (MoM) basis, the CS National index fell -0.54%. That is the 5th straight month of home price declines.

In REAL terms, the Case-Shiller National home price index is up only 0.58% YoY as REAL Weekly Earnings growth is negative at -3.1% YoY.

Only San Francisco fell on a YoY basis (down -1.6%). Five metro areas were above 10% and they are all in the South. Atlanta, Charlotte. Dallas, Miami and Tampa.

On MoM basis, every metro area in the Case-Shiller 20 index saw price declines from October to November.

Another sign of a crumbling market.

Fed Mission Accomplished? Fed Funds Target Rate Rises Above Inflation Rate As M2 Money Growth Sinks To -1.3% YoY (US Consumers Have Lost $4 Trillion In Real Disposable Income Under Biden)

The Federal Reserve’s Open Market Committee (FOMC) is meeting on Wednesday. What will they do?

First, The Fed Funds Target (upper bound) is above the Core US inflation rate YoY. Second, M2 Money growth YoY has slowed to -1.3%.

Of course, the members of the FOMC might decide that this is not enough and may keep raising rates and shrinking The Fed’s enormous balance sheet.

In the “Haven’t they suffered enough?” arena, US real disposable income has fallen by -21% since Biden was sworn-in as President.

On the other hand, the Taylor Rule is still pointing to a target rate of 10% (we aren’t even half way there at 4.50%).

Oh and the price of insuring against a US debt default remains elevated (since Biden and Schumer are baving like arrogant bullies) and are refusing to negotitate over spending cuts.

The 1Y CDS volatility cube indicates that it will all be over soon.