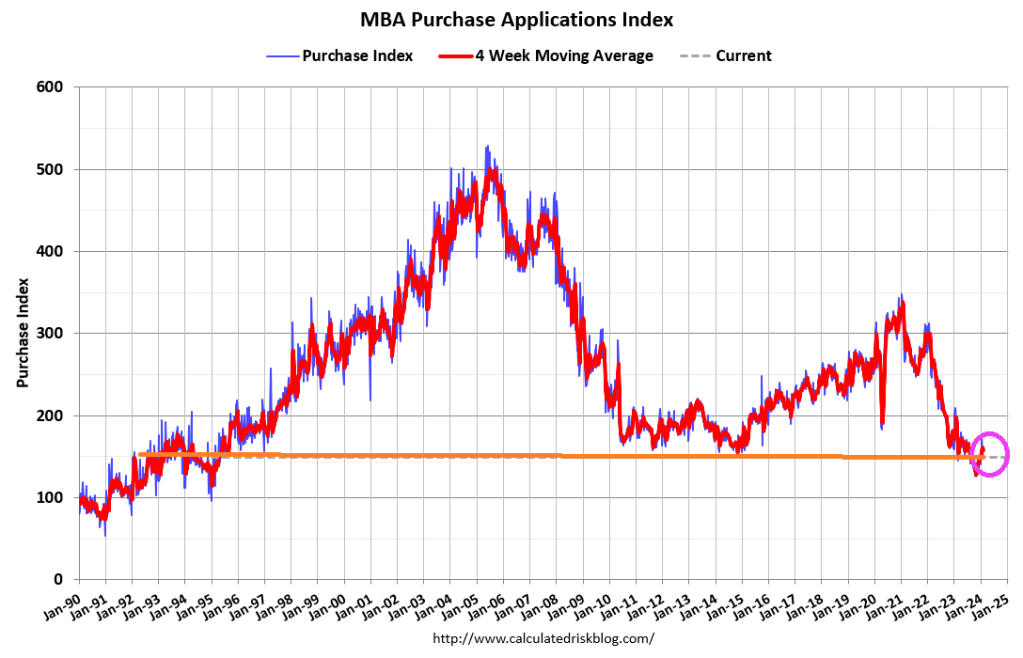
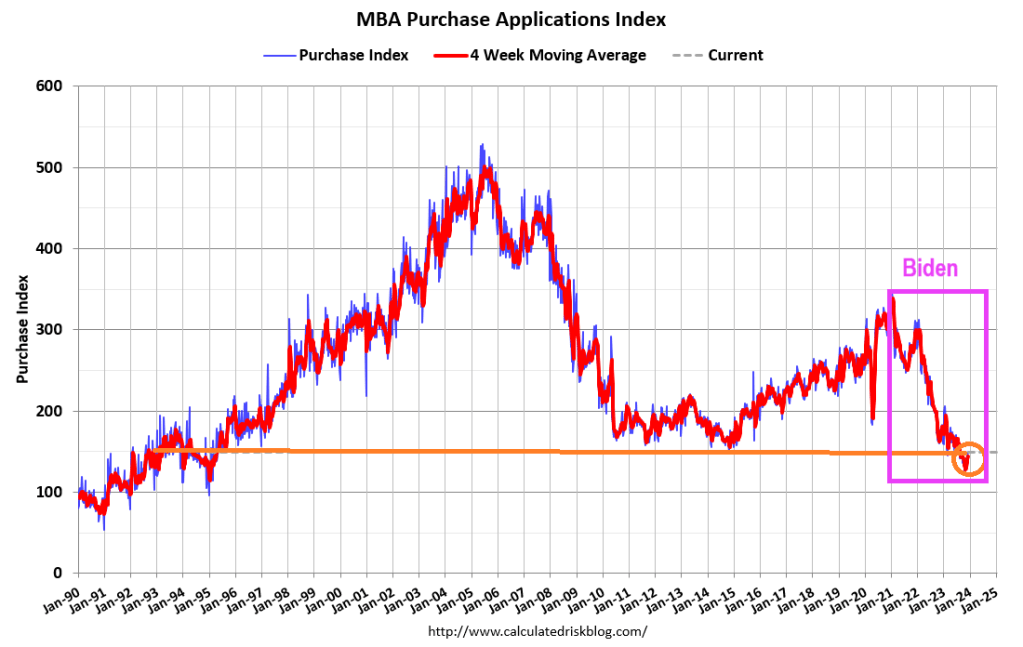
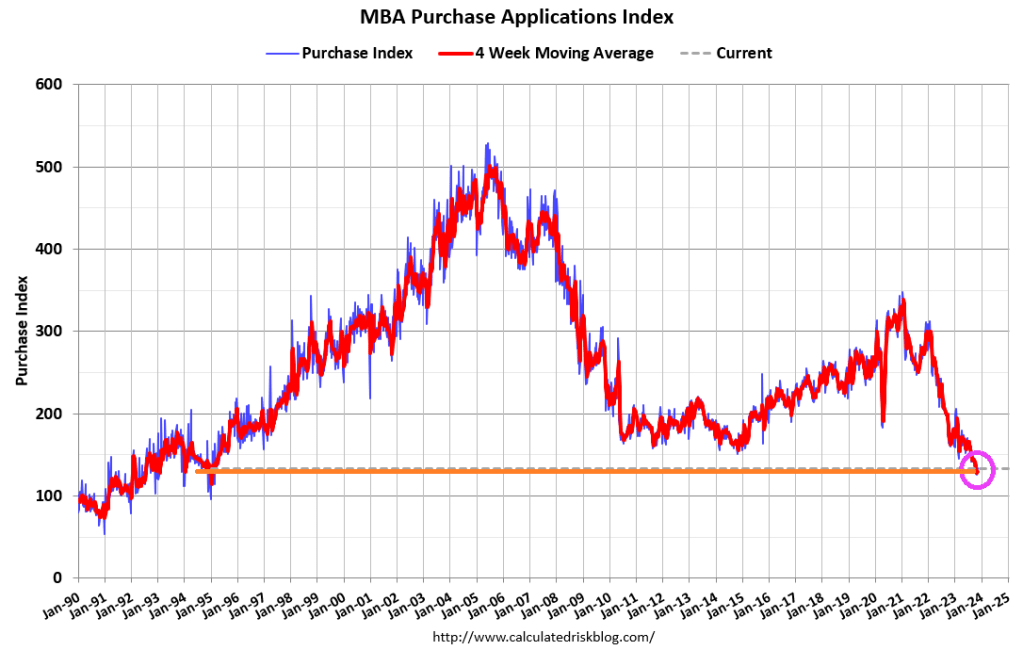
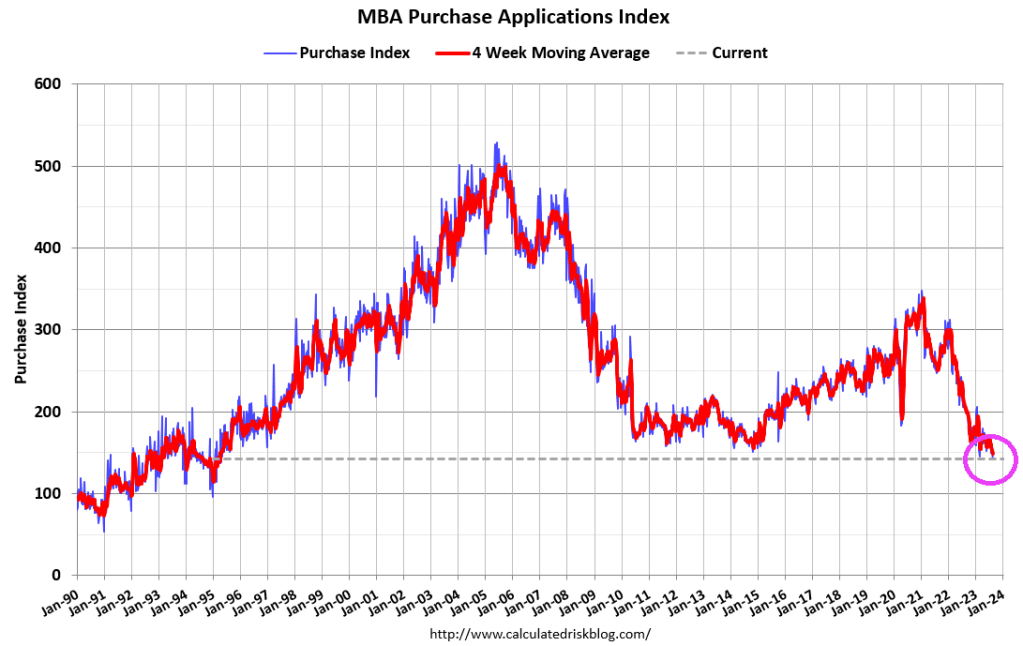
I would like to see Kamala Harris explain why mortgage purchase applications are down -60% under Biden/Harris Presidency. Other than a word salad answer. Or Cottage Cheese.
Mortgage applications decreased 17.0 percent from one week earlier, according to data from the Mortgage Bankers Association’s (MBA) Weekly Applications Survey for the week ending October 11, 2024.
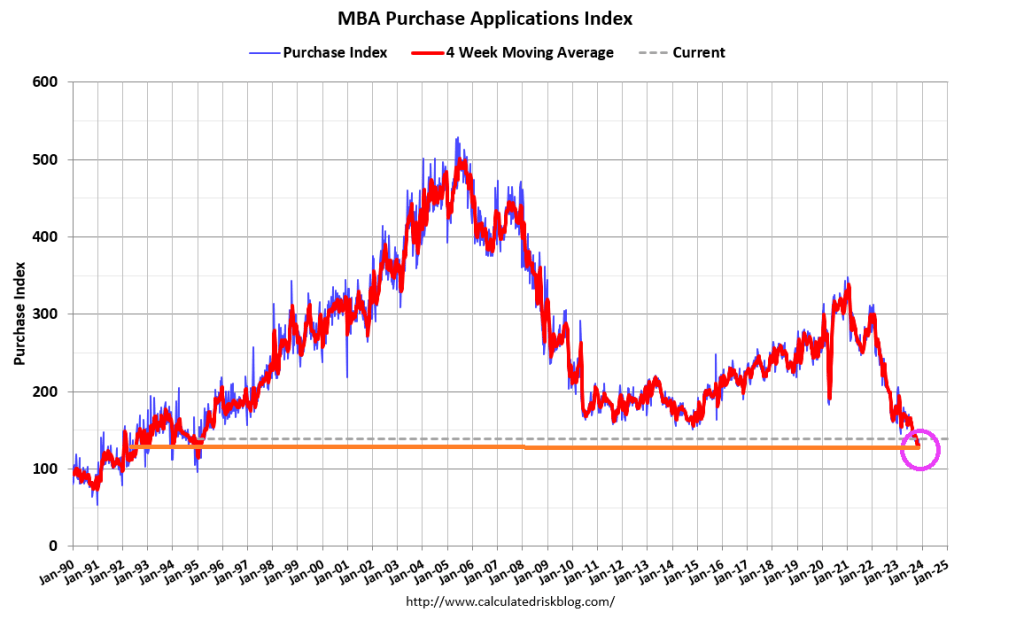
The Market Composite Index, a measure of mortgage loan application volume, decreased 17.0 percent on a seasonally adjusted basis from one week earlier. On an unadjusted basis, the Index decreased 17 percent compared with the previous week. The seasonally adjusted Purchase Index decreased 7 percent from one week earlier. The unadjusted Purchase Index decreased 7 percent compared with the previous week and was7 percent higher than the same week one year ago.
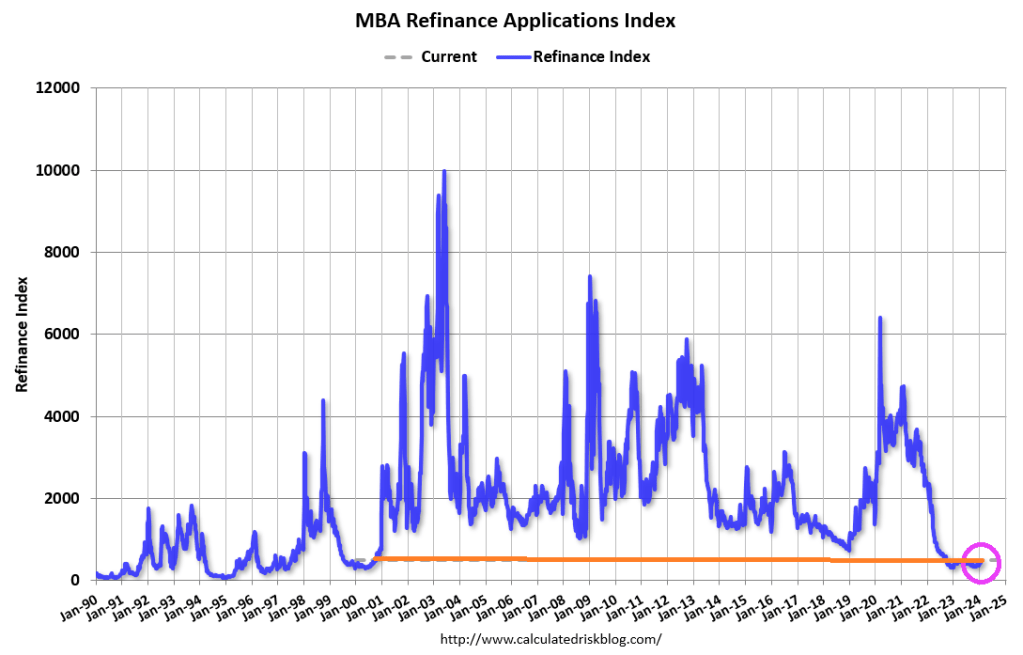
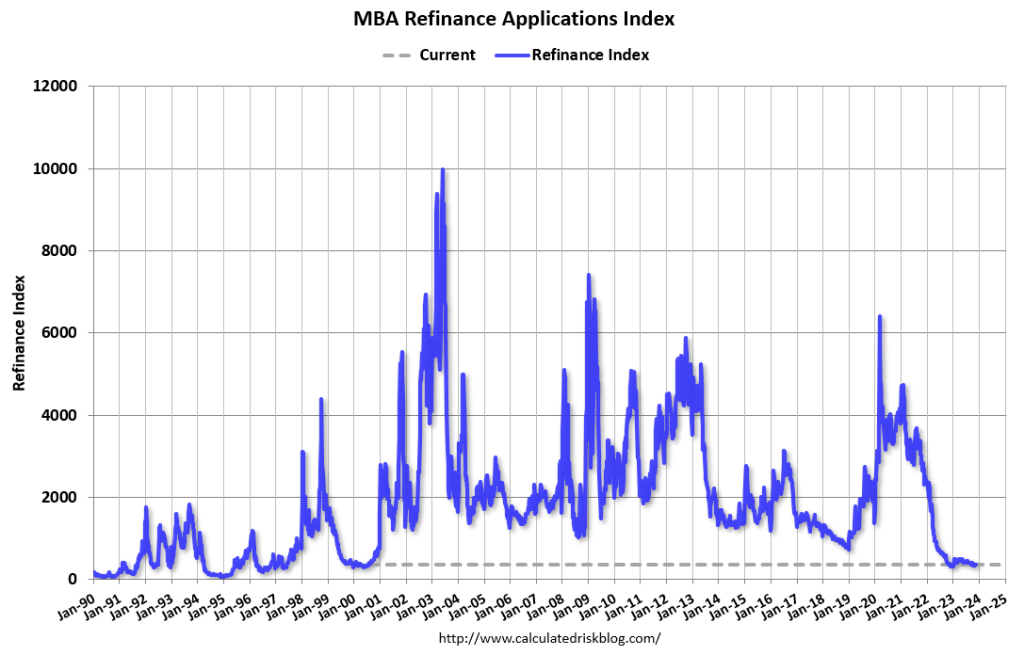
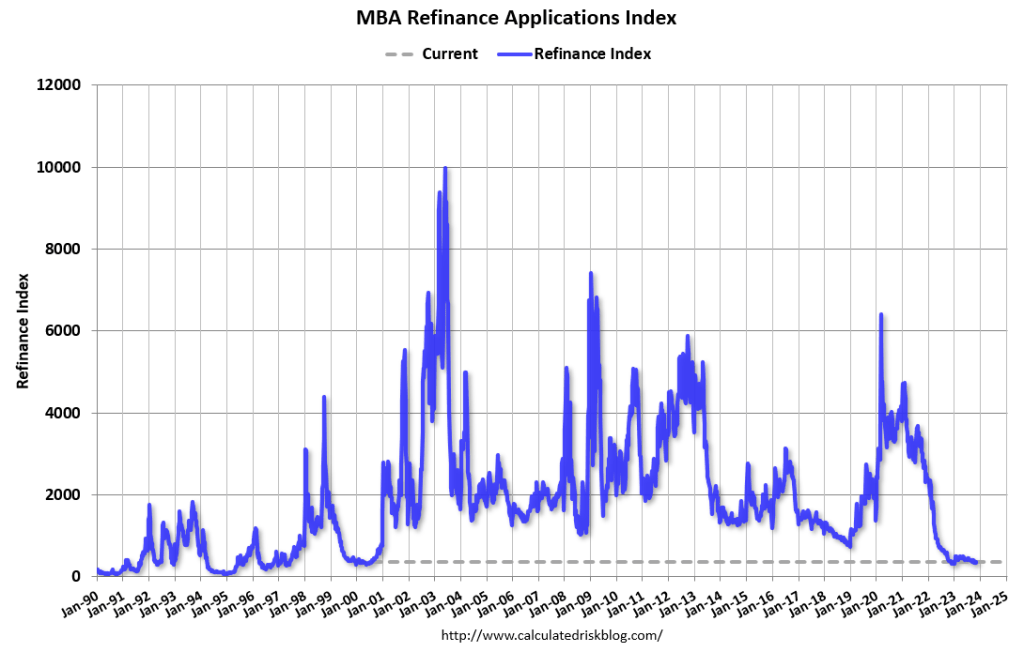
The Refinance Index decreased 26 percent from the previous week and was 111 percent higher than the same week one year ago.
Housing prices are up 34.2% under Biden/Harris while mortgage rates are up 138.6%.
Mortgage applications decreased 2.3 percent from one week earlier, according to data from the Mortgage Bankers Association’s (MBA) Weekly Mortgage Applications Survey for the week ending February 9, 2024.
The Market Composite Index, a measure of mortgage loan application volume, decreased 2.3 percent on a seasonally adjusted basis from one week earlier. On an unadjusted basis, the Index increased 2 percent compared with the previous week. The seasonally adjusted Purchase Index decreased 3 percent from one week earlier. The unadjusted Purchase Index increased 4 percent compared with the previous week and was 12 percent lower than the same week one year ago.
The Refinance Index decreased 2 percent from the previous week and was 12 percent higher than the same week one year ago.
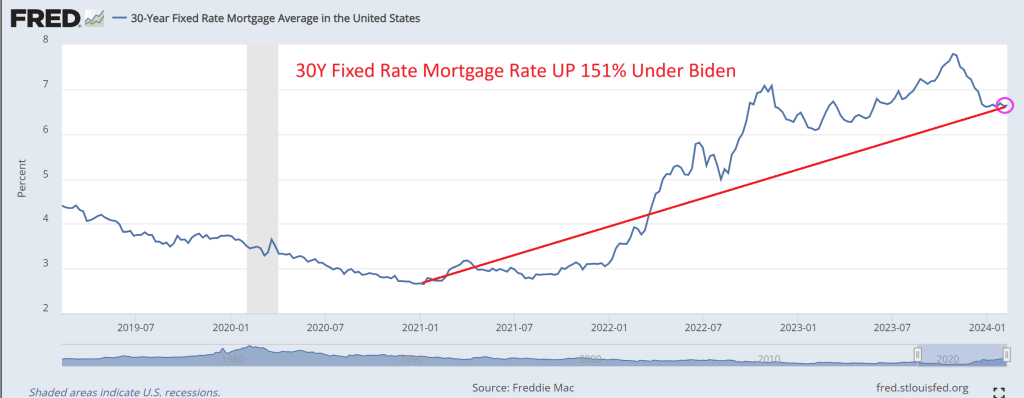
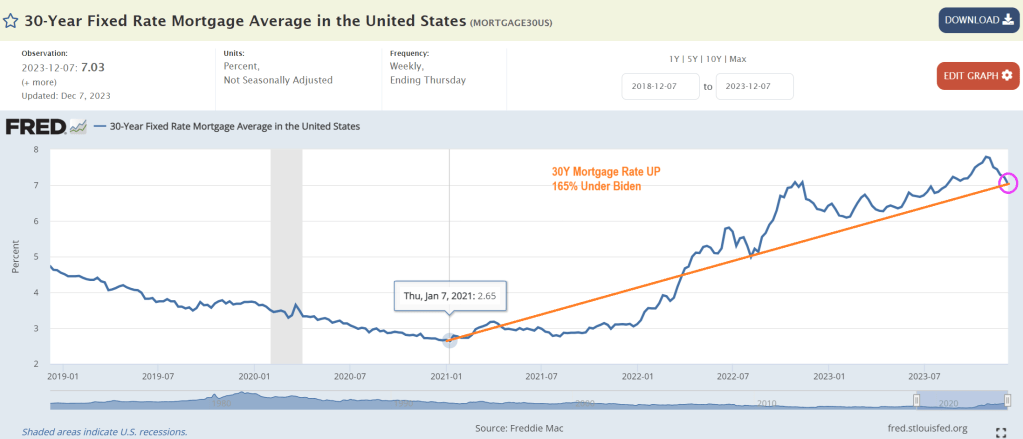
Mortgage rates (30Y fixed) are up 151% under Bidenomics.
Mortgage applications decreased 1.5 percent from one week earlier, according to data from the Mortgage Bankers Association’s (MBA) Weekly Mortgage Applications Survey for the week ending December 15, 2023.
The Market Composite Index, a measure of mortgage loan application volume, decreased 1.5 percent on a seasonally adjusted basis from one week earlier. On an unadjusted basis, the Index decreased 3 percent compared with the previous week. The seasonally adjusted Purchase Index decreased 1 percent from one week earlier. The unadjusted Purchase Index decreased 4 percent compared with the previous week and was 18 percent lower than the same week one year ago.
The Refinance Index decreased 2 percent from the previous week and was 18 percent higher than the same week one year ago.
The average contract interest rate for 30-year fixed-rate mortgages with conforming loan balances ($726,200 or less) decreased to 6.83 percent from 7.07 percent, with points increasing to 0.60 from 0.59 (including the origination fee) for 80 percent loan-to-value ratio (LTV) loans.
Mortgage applications increased 7.4 percent from one week earlier, according to data from the Mortgage Bankers Association’s (MBA) Weekly Mortgage Applications Survey for the week ending December 8, 2023.
The Market Composite Index, a measure of mortgage loan application volume, increased 7.4 percent on a seasonally adjusted basis from one week earlier. On an unadjusted basis, the Index increased 6 percent compared with the previous week. The seasonally adjusted Purchase Index increased 4 percent from one week earlier. The unadjusted Purchase Index decreased 1 percent compared with the previous week and was 18 percent lower than the same week one year ago.
The Refinance Index increased 19 percent from the previous week and was 27 percent higher than the same week one year ago.
The average contract interest rate for 30-year fixed-rate mortgages with conforming loan balances ($726,200 or less) decreased to 7.07 percent from 7.17 percent, with points decreasing to 0.59 from 0.60 (including the origination fee) for 80 percent loan-to-value ratio (LTV) loans.
And Freddie Mac’s 30-year mortgage rate is UP 165% under Biden.
Like WEF’s Klaus Schwab, Biden doesn’t want you to have a low rate mortgage for Christmas!
Biden’s economic Dance Macabre! Or Biden’s Mortgage Macabre! Mortgage purchase demand actually fell -1% from the previous week (WoW) and is down -20% from the previous year (YoY).
Mortgage applications increased 3.0 percent from one week earlier, according to data from the Mortgage Bankers Association’s (MBA) Weekly Mortgage Applications Survey for the week ending November 17, 2023.
The Market Composite Index, a measure of mortgage loan application volume, increased 3.0 percent on a seasonally adjusted basis from one week earlier. On an unadjusted basis, the Index decreased 0.1 percent compared with the previous week. The Refinance Index increased 2 percent from the previous week and was 4 percent lower than the same week one year ago. The seasonally adjusted Purchase Index increased 4 percent from one week earlier. The unadjusted Purchase Index decreased 1 percent compared with the previous week and was 20 percent lower than the same week one year ago.
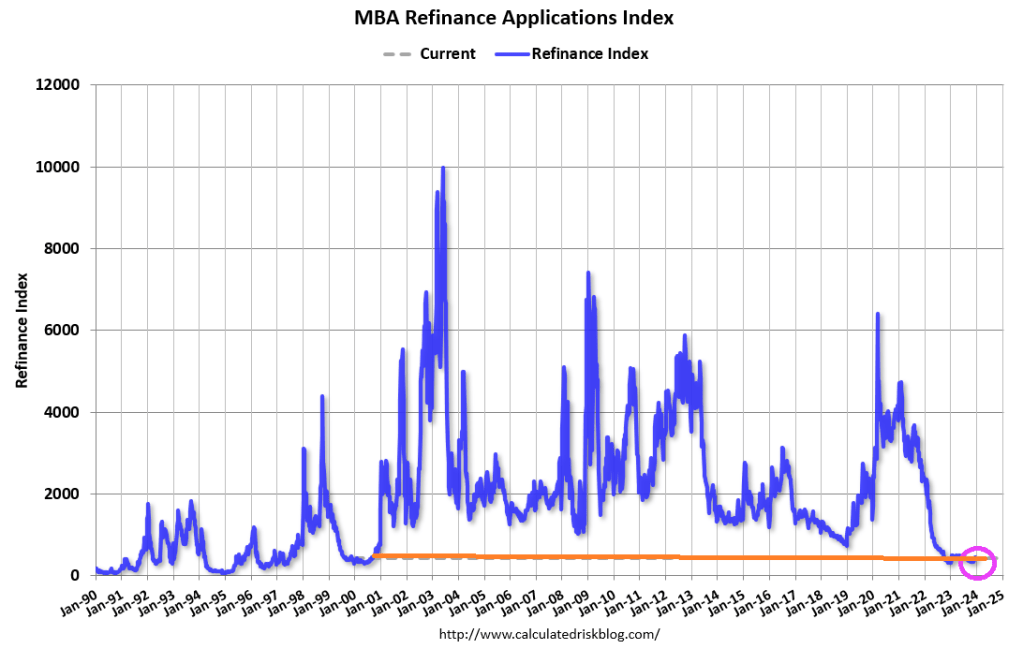
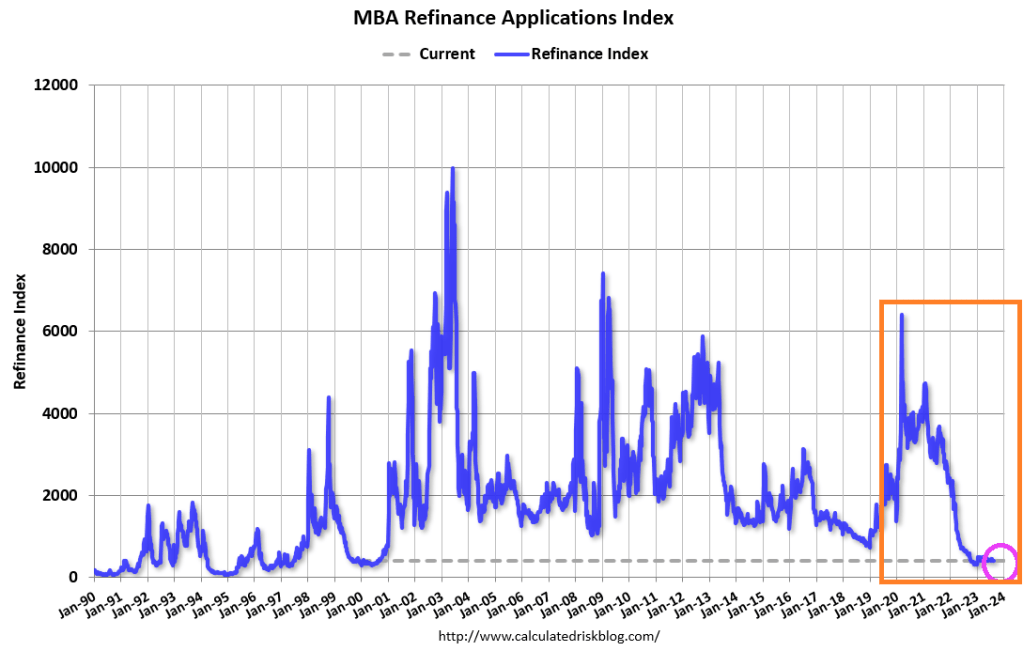
And MBA mortgage refis
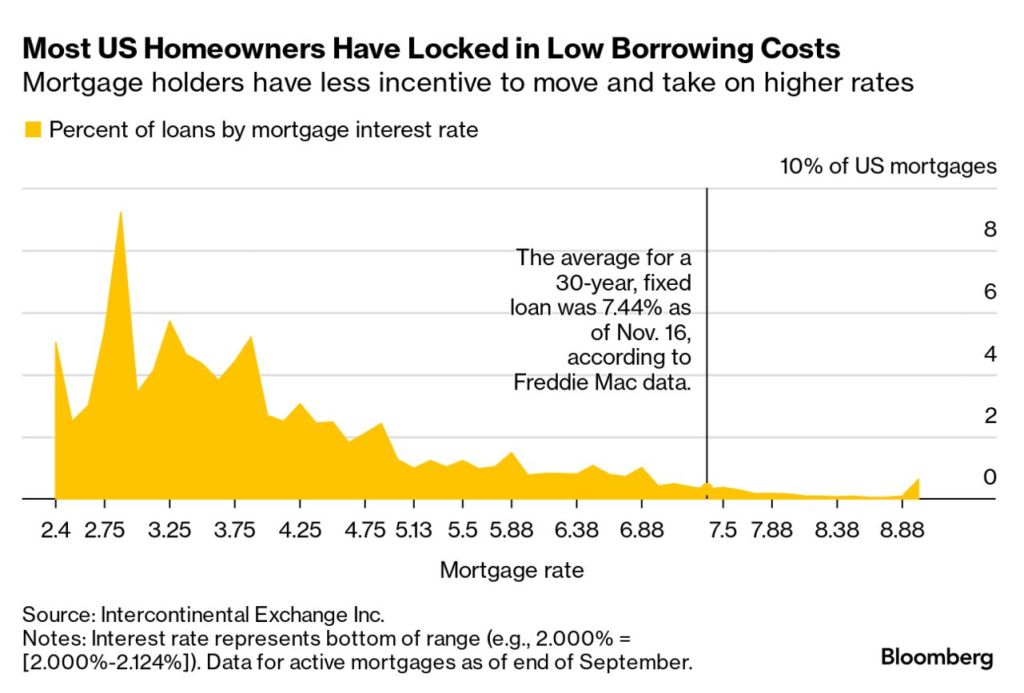
Not surprising since most homeowners have locked in low borrowing costs prior to the Biden/Congress Covid spendathon and the inflation that followed.
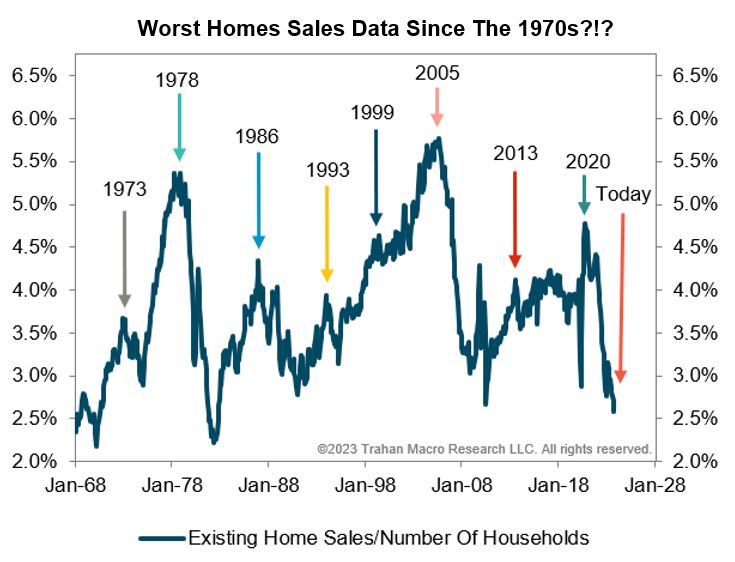
After all, we are seeing the worst home sales data since the 1970s.
Yes, even KJP is finding it difficult to sell Bidenomics to the public (only talking heads like The View and Morning Joe are still trumpeting the greatness of Bidenomics). And now KJP and the Administration are selling Biden’s age of 81 as a treasure trove of experience. Except that Biden’s record in the Senate is an embarrasment. And Biden keeps shuffling and falling and mumbling through his speeches. Watch Biden’s handlers make sure he doesn’t fall again before the election.
Biden says he wants 4 more years to finish the job. Like killing off the mortgage market completely, Joe?
Mortgage applications increased 2.8 percent from one week earlier, according to data from the Mortgage Bankers Association’s (MBA) Weekly Mortgage Applications Survey for the week ending November 10, 2023.
The Market Composite Index, a measure of mortgage loan application volume, increased 2.8 percent on a seasonally adjusted basis from one week earlier. On an unadjusted basis, the Index increased 0.4 percent compared with the previous week. The seasonally adjusted Purchase Index increased 3 percent from one week earlier. The unadjusted Purchase Index decreased 0.3 percent compared with the previous week and was12 percent lower than the same week one year ago.
The Refinance Index increased 2 percent from the previous week and was 7 percent higher than the same week one year ago.
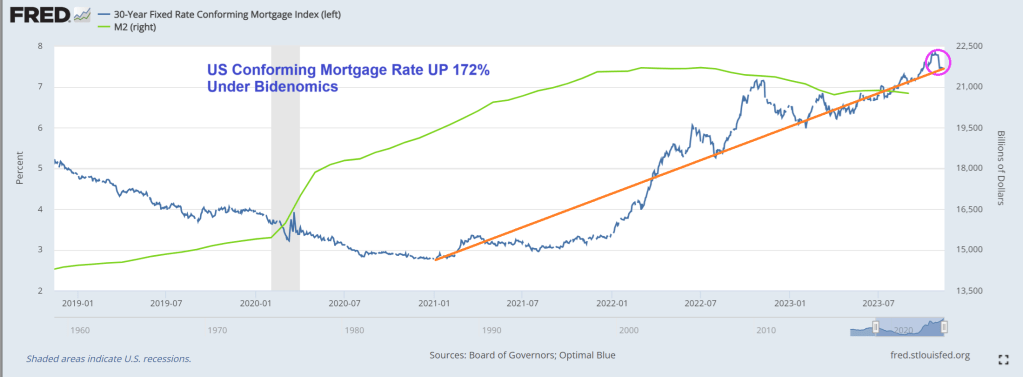
Of course, mortgage rates have been declining slightly over the past few weeks, but remain up 172% under Biden.
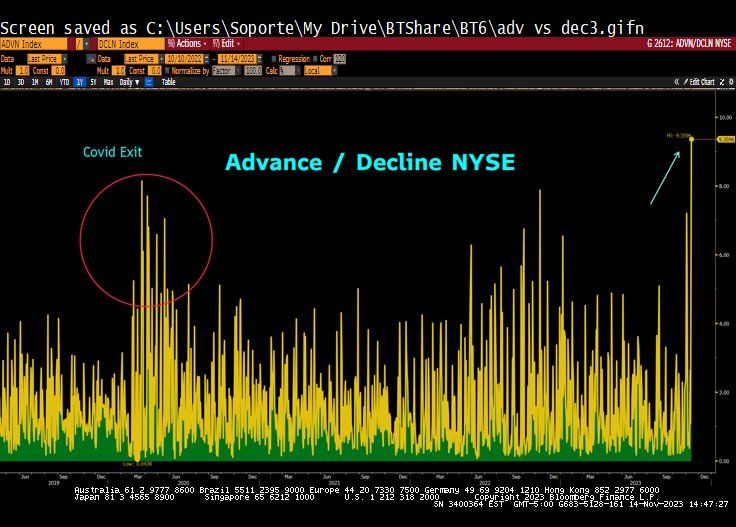
At least the stock market is booming after the inflation report signalled that The Fed is likely done with rate hikes.
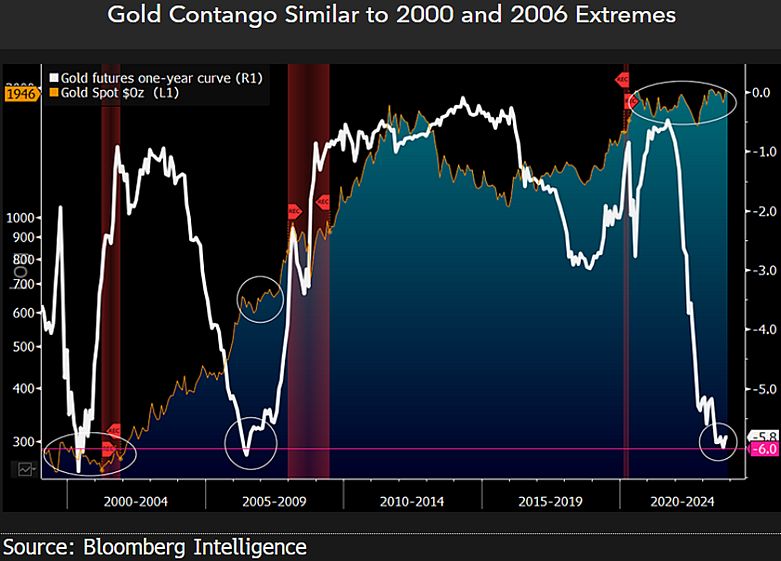
On the gold front, we are seeing evidence of contango.
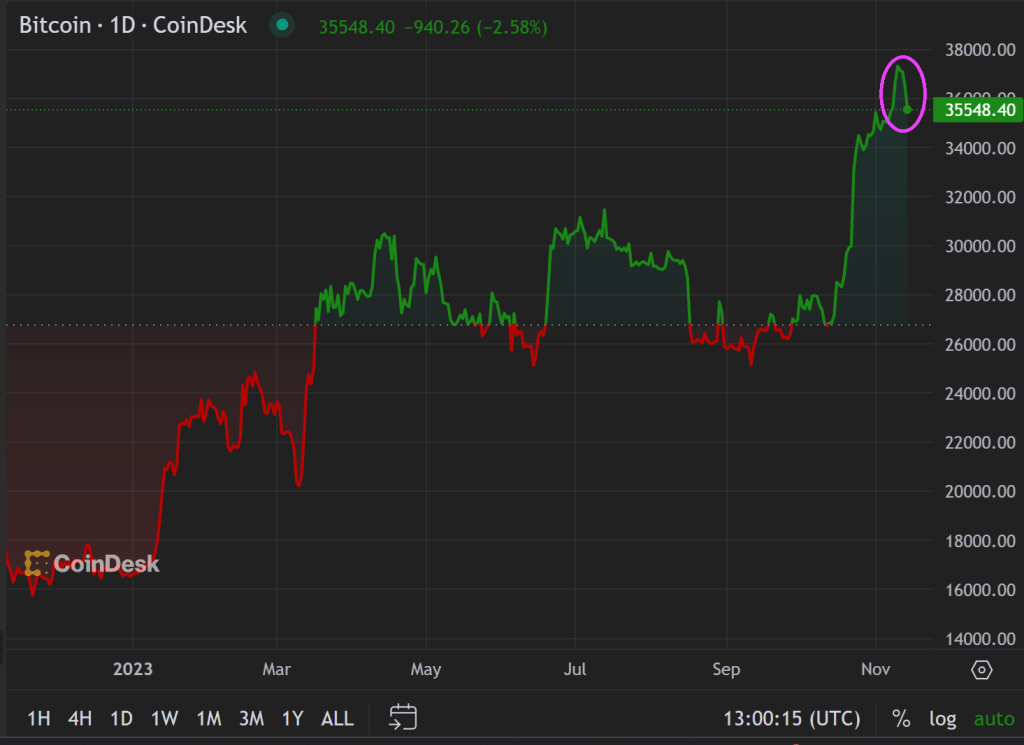
Bitcoin? Down a wee bit after a staggering rise in price over the past year.
Here is China’s Xi meeting with Biden’s likely replacement, “Greasy Gavin” Newsom and Newsom’s likely Treasury Secretary, Janet “Too Low For Too Long” Yellen. Newsom, Yellen and Xi all want havoc in America.
Bidenomics strikes … again. No, not his inane ramblings about Hamas being “the other team” or that Hamas has to learn to shoot straight. But his policies freezing effects on the economy. Like housing.
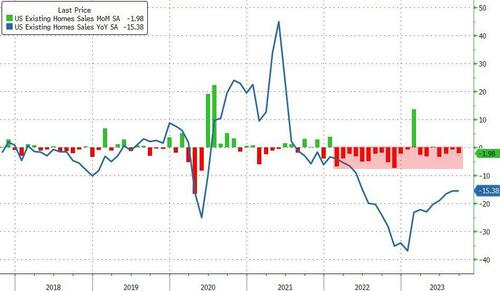
Existing-home sales faded in September, according to the National Association of REALTORS®. Among the four major U.S. regions, sales rose in the Northeast but receded in the Midwest, South and West. All four regions registered year-over-year sales declines.
Total existing-home sales – completed transactions that include single-family homes, townhomes, condominiums and co-ops – waned 2.0% from August to a seasonally adjusted annual rate of 3.96 million in September. Year-over-year, sales dropped 15.4% (down from 4.68 million in September 2022). … Total housing inventory registered at the end of September was 1.13 million units, up 2.7% from August but down 8.1% from one year ago (1.23 million). Unsold inventory sits at a 3.4-month supply at the current sales pace, up from 3.3 months in August and 3.2 months in September 2022.
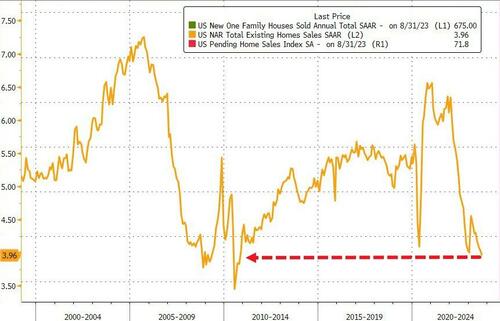
The total existing home sales SAAR dropped back below 4mm for the first time since October 2010 (during the foreclosure crisis)…
Source: Bloomberg
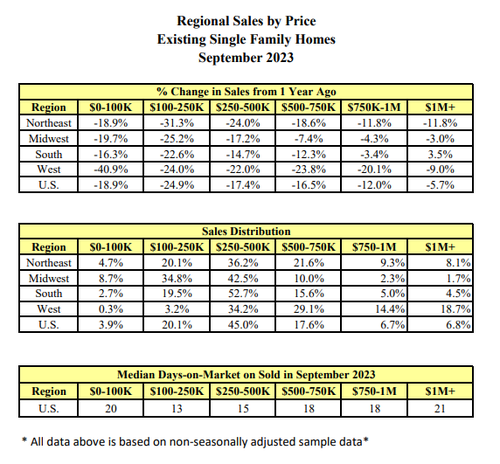
Sales fell in all regions except the Northeast in September… and in every price range…
Single-family home sales fell to an annualized 3.53 million pace, the lowest since 2010. Condominium and co-op sales also declined.
“As has been the case throughout this year, limited inventory and low housing affordability continue to hamper home sales,” said Lawrence Yun, NAR’s chief economist.
“The Federal Reserve simply cannot keep raising interest rates in light of softening inflation and weakening job gains.”
First-time buyers made up a historically low 27% of purchases, down from the prior month.
Cash sales represented 29% of total sales, matching the highest level in over a decade. Investors, who often purchase with cash and are therefore less sensitive to mortgage rates, made up 18% of the market.
“It would be very unusual to have higher cash compared to first time buyers,” Yun said on a call with reporters.
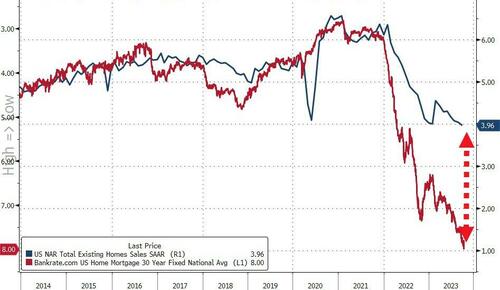
And, if mortgage rates (and thus affordability) are anything to go by, things are about to get real…
Source: Bloomberg
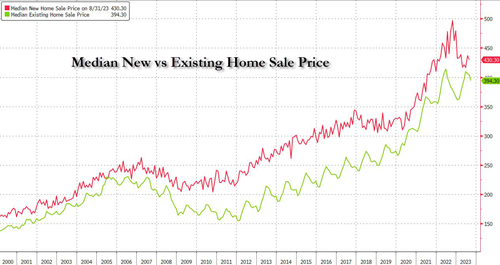
The median selling price rose 2.8% from a year earlier to $394,300, the highest September reading on record, pushing affordability even lower. But existing home prices are falling relative to new home prices (with the ratio near record lows)…
It looks like The House may elect a RINO as Speaker (Patrick McHenry, RINO-NC) to replace McCarthy. One RINO replacing another RINO … all so The House can continue its insane, inflation inducing spending.
Mortgage demand (applications) decreased 4.2 percent from one week earlier, according to data from the Mortgage Bankers Association’s (MBA) Weekly Mortgage Applications Survey for the week ending August 18, 2023.
The Market Composite Index, a measure of mortgage loan application volume, decreased 4.2 percent on a seasonally adjusted basis from one week earlier. On an unadjusted basis, the Index decreased 6 percent compared with the previous week. The Refinance Index decreased 3 percent from the previous week and was 35 percent lower than the same week one year ago. The seasonally adjusted Purchase Index decreased 5 percent from one week earlier. The unadjusted Purchase Index decreased 7 percent compared with the previous week and was 30 percent lower than the same week one year ago.
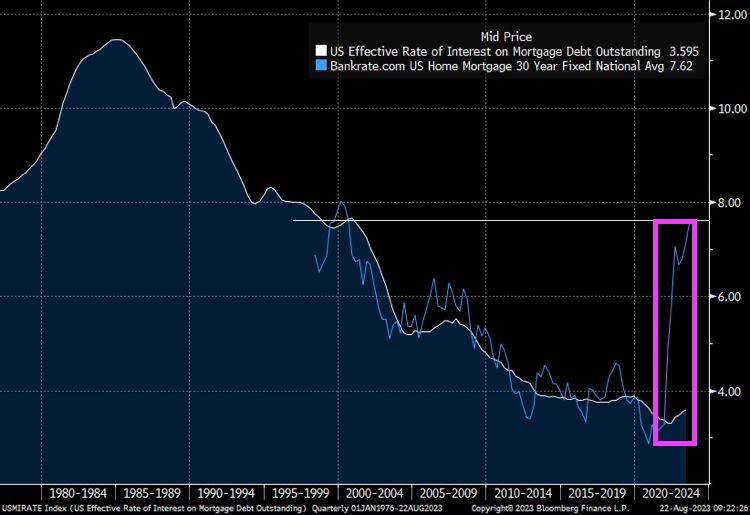
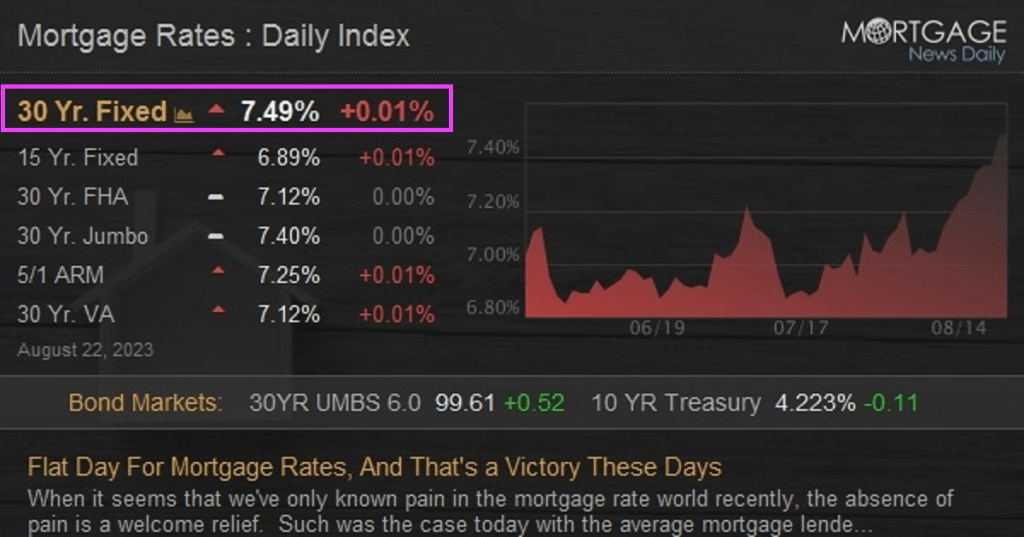
The spread betweenn Bankrate’s 30 year rate at 7.62% and the effective rate on mortgage debt outstanding at 3.595% has exploded as mortgage rates jump.
Today’s mortgage rates are up to 7.49%. OMG!
Bidenomics (code for making large donors wealthier and the middle class getting the boot) and catch-up for Yellenomics (rates too low for too long), and Powell are helping to burn down the housing market.
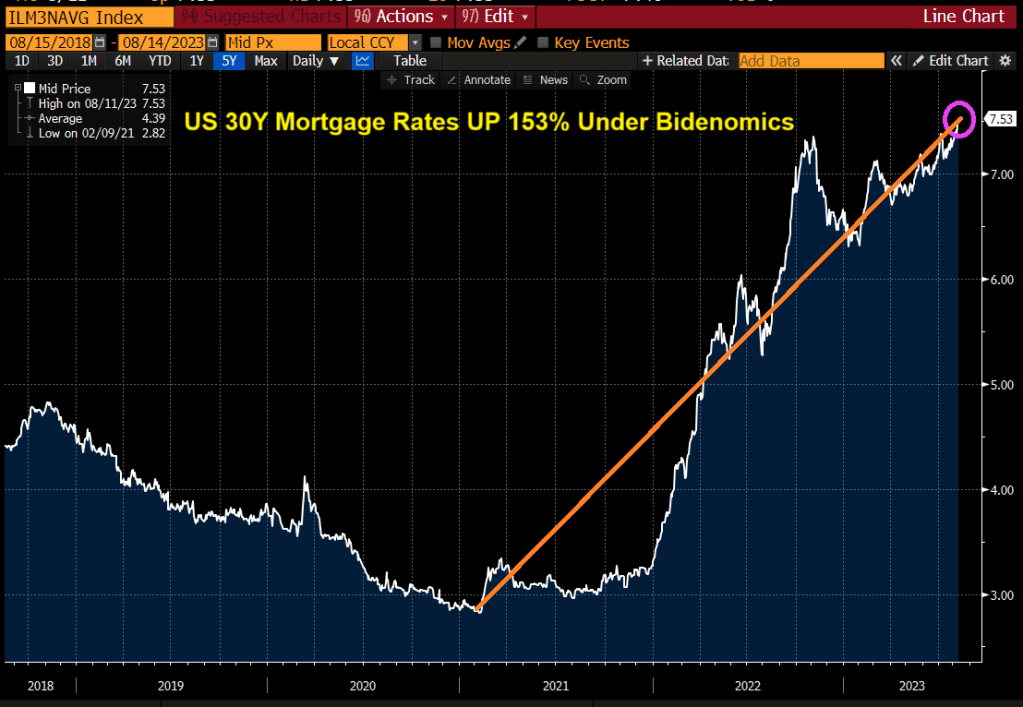
Rates on 30-year mortgages in the US are now the highest since 2000, at 7.53%. Mortgage rates are now up 153% under Bidenomics. Rates have gone from sub 3% to above 7.50% under Inflation Joe.
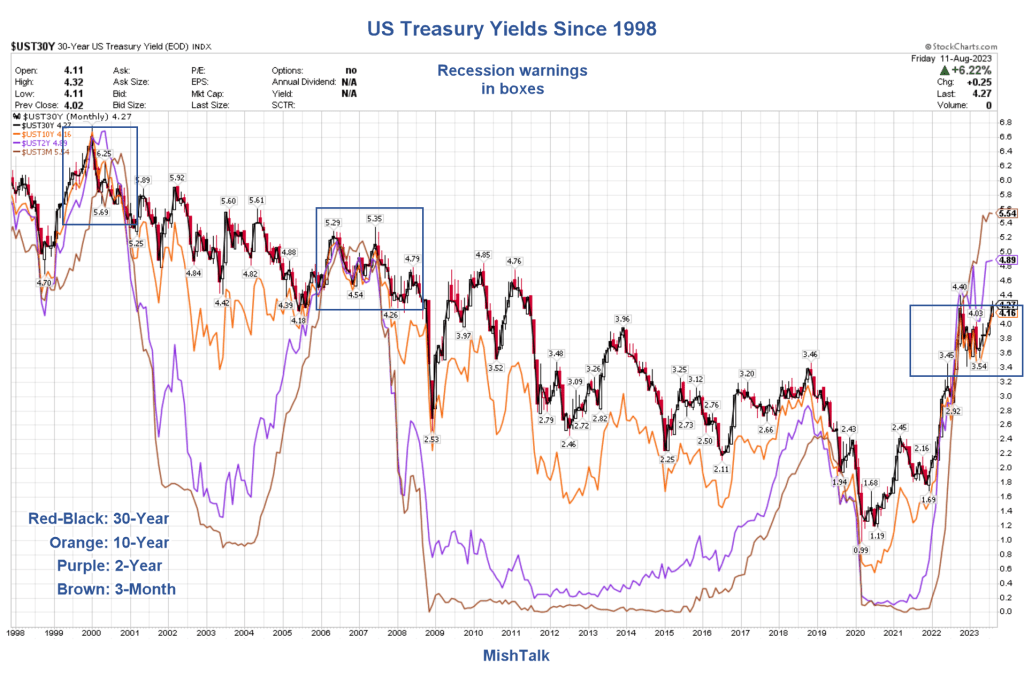
US Treasury yields are playing catch-up from Yellen’s “Too low for too long” monetary policies.
Yes, in part we are playing catch-up from Yellen’s Reign of Error as Fed Chair (keeping rates too low for too long). Only in Washington DC, does gross incompetance warrant a promtion to US Treasury Secretary. Career half-wit Mean Joe Biden is El Presidente and acting like a third world dictator.
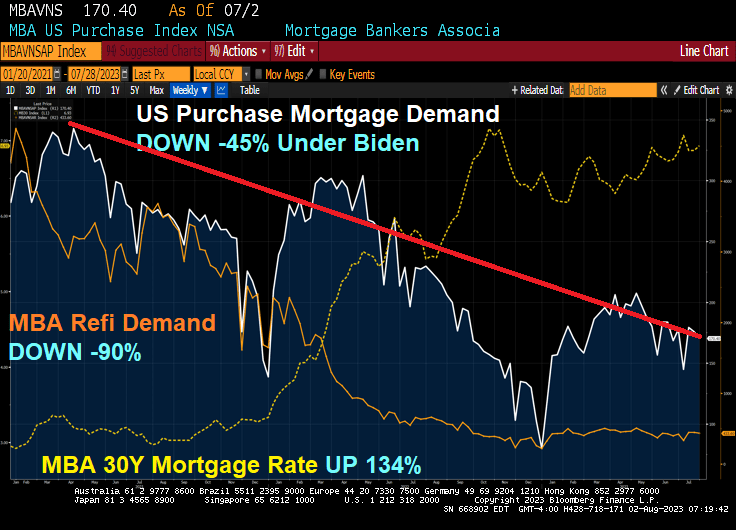
Inflation under Biden has been very painful for the US middle class and low wage workers. That inflation has resulted to surging mortgage rates thanks to The Fed’s counterattack.
The result? Mortgage rates are up 134% under Bidenomics, while mortgage purchase demand is down -45% since Biden was selected. And mortgage refinancing demand is down a staggering -90%!
Mortgage applications decreased 3.0 percent from one week earlier, according to data from the Mortgage Bankers Association’s (MBA) Weekly Mortgage Applications Survey for the week ending July 28, 2023.
The Market Composite Index, a measure of mortgage loan application volume, decreased 3.0 percent on a seasonally adjusted basis from one week earlier. On an unadjusted basis, the Index decreased 3 percent compared with the previous week. The Refinance Index decreased 3 percent from the previous week and was 32 percent lower than the same week one year ago. The seasonally adjusted Purchase Index decreased 3 percent from one week earlier. The unadjusted Purchase Index decreased 3 percent compared with the previous week and was 26 percent lower than the same week one year ago.
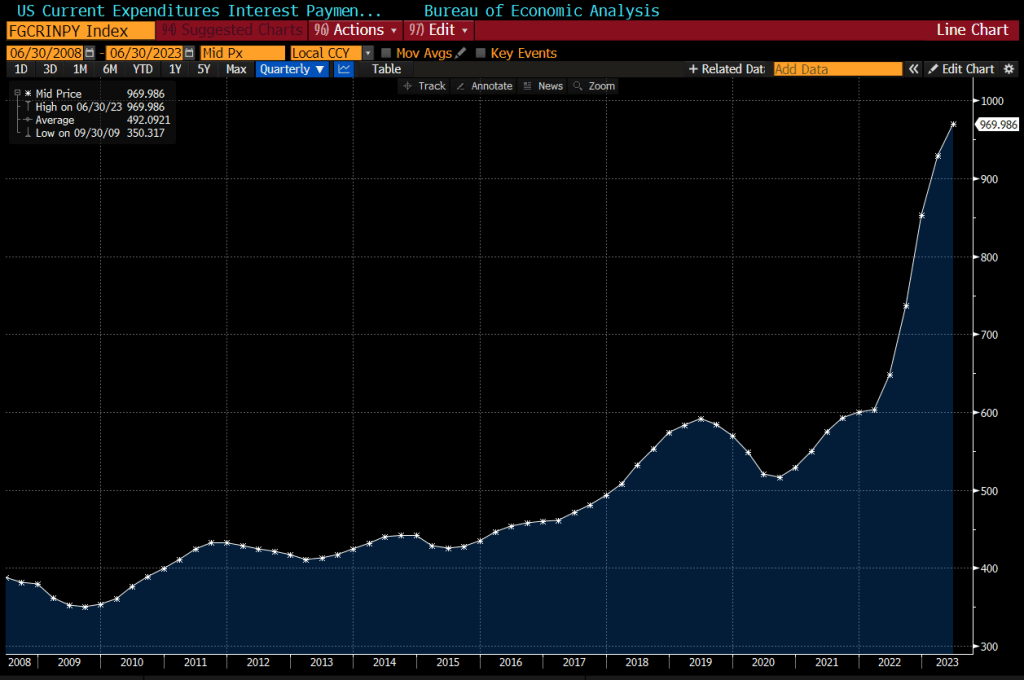
US interest expenses have surged by about 50% in the past year, to nearly $1 trillion on an annualized basis.
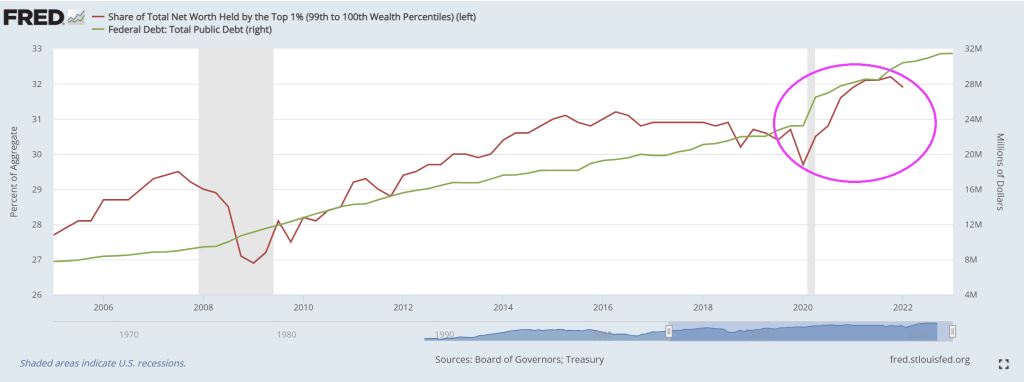
Look at the share of net worth by the top 1% as Treasury borrows more money.
Oddly, Biden is not talking about about putting US government policies up for sale to the highest bidders. But don’t worry. Biden is the King of Corruption in the District of Corruption (Washington DC).


You must be logged in to post a comment.