While much of the US is down from 2022 peaks in home price. but it is The West where home prices are down the most (just like 2008 where the Inland Empire of California, Phoenix and Las Vegas crashed in term of home prices).
Biden’s State of the Union address saw him bragging about his record job creation (actually, it was the private sector, not Biden than created jobs) and historic unemployment rate. What Biden didn’t mention (along with not discussing the porous Mexican border with fentanyl pouring across or why he failed to shoot down a Chinese spy balloon until after it has passed over numerous military reservation) is that the unemployment rate always hit a low point just prior to a recession.
So, here we sit at 3.4% unemployment. But we also see the US Treasury yield curves (10Y-3M and 10Y-2Y) remaining deeply inverted.
The US Treasury 10-year yield is up 5.5 basis points today.
And Bankrate’s 30-year mortgage survey rate is up slightly today.
Here is where we set today. The cost of insuring for a US debt default remains elevated as the US has hit its statutory debt limit. This is happening at the effective rate of interest on US mortgage debt is rising.
Help us McCarthy! Because Biden and Schumer don’t want to cut ANY spending.
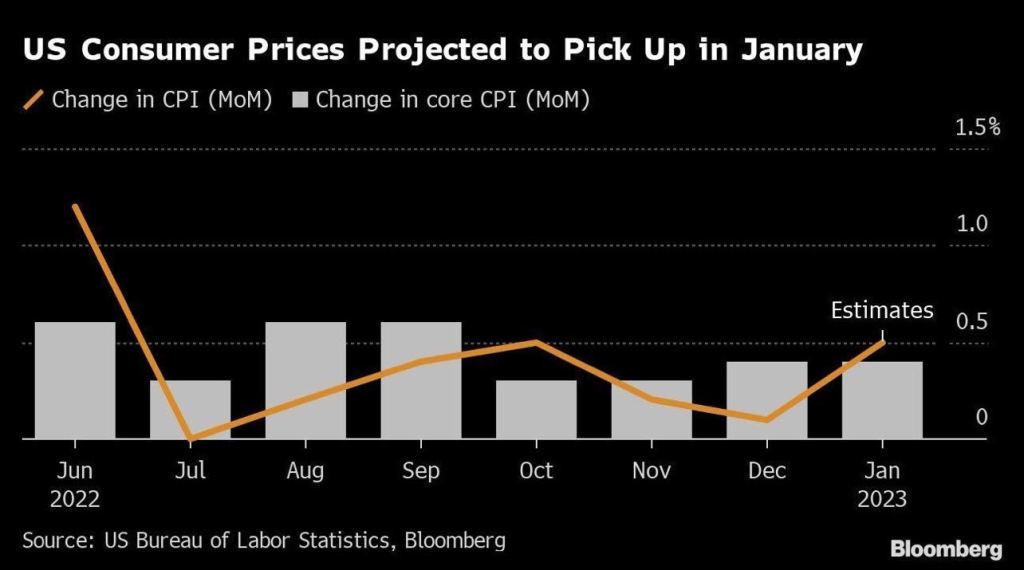
The one statement that Biden made in his State of the Union Address that was factually accurate was that inflation is coming down. Of course, he then blew it by saying he inherited inflation from Trump which was not true. Headline inflation (CPI YoY) was only 1.4% when Biden was sworn-in as President and rose to 9.1% YoY by June 2021 before finally starting to decline.
But despite the cooling of inflation (and M2 Money growth), The Fed seems hell bent on increasing their target rate, now forecast by Fed Funds Futures to peak in July 2023 at 5.123% before pivoting.
The Thrill Is Gone from the US housing market as M2 Money growth fells to 0%.
US Existing Home Sales fell -1.5% from November to December (MoM) to 4.02 SAAR units sold. That translates to a depressing -34% decline since December 2021 (YoY).
On the positive side, these numbers are better than expected (-3.4% MoM expected). Still, these numbers are pretty dismal.
Existing home sales MEDIAN PRICE fell to $366.9k as M2 Money growth vanishes. And inventory of existing homes for sale remains lower than pre-Covid levels.
Let’s see what Powell and the Gang (aka, The Federal Reserve Board of Governors) does with interest rates going forward.
Today, the 10-year Treasury yield is up 7.1 basis points, but the real action is in Europe where sovereign yields are up 11.5 bps in France, 9.8 bps in Germany and 18.6 bps in Italy.
US existing home sales in November collapsed by -38.6% YoY as M2 Money growth runs out of gas.
The above chart is similar to yesterday’s “Ski Slope” chart of US home prices YoY.
Unfortunately, pending home sales YoY are the worst in recorded history.
What will President Biden do about this dire situation? Our “Vacationer in Chief” is off on yet another vacation to St. Croix in the US Virgin Islands, so probably nothing. Now that Biden is sunbathing, what will his Treasury Secretary Janet Yellen do?
A classic good news, bad news story. The good news? US new home sales rose 5.8% in November, better that the expected -5.1%, The bad news? On a year-over-year basis, US new home sales FELL
Sales of new US homes unexpectedly rose in November, suggesting some stabilization in demand as mortgage rates eased late in the month from their highs.
Purchases of new single-family homes increased 5.8% to an annualized 640,000 pace last month after rising in October, government data showed Friday.
A mid-month retreat in 30-year mortgage rates back below 7% along with an increase in builder incentives may have helped support demand. Still, the sales data are volatile from month to month. With home prices remaining elevated and the Federal Reserve poised to raise interest rates further, headwinds for the housing market will persist into 2023.
The increase in sales last month was concentrated in the West and Midwest.
The report, produced by the Census Bureau and the Department of Housing and Urban Development, showed the median sales price of a new home was up 9.5% from a year earlier to $471,200.
There were 461,000 new homes for sale as of the end of last month, though the grand majority remain under construction or not yet started. The number of homes sold in November and awaiting the start of construction — a measure of backlogs — rose to the highest since the beginning of the year.
But for all the cheerleading, new home sales were DOWN -15.3% on a year-over-year basis. The ninth straight month of negative new home sales growth.
At least the median price of new home sales was down -2.79% from October to November.
One of the big problems with Federal goverment and Federal Reserve monetary stimulus is … it wears out. Just look at M2 Money growth.
US existing homes sales fell -7.70% in November to 4.09 million units SAAR. And since the same month last year, existing home sales are down -35.4% YoY.
Existing home sales were the lowest in November since 2010.
The good news? The median price of existing homes fell to 3.21% YoY. The bad news? The ark is really bad pointing to a bad December. Inventory for sale (orange line) remains below pre-Covid shutdown levels.
US mortgage rates fell for a fourth week in a row, the longest such stretch of declines since May 2019.
The contract rate on a 30-year fixed mortgage eased 8 basis points to 6.41% in the week ended Dec. 2, still the lowest since mid-September, according to Mortgage Bankers Association data released Wednesday.
Rates have retreated for the past month as the Federal Reserve has signaled it will soon slow down the pace of interest-rate hikes, likely at next week’s policy meeting.
Even so, MBA’s mortgage purchase index fell 3%, the first drop in five weeks, underscoring how demand remains fickle and driving a decline in the overall measure of mortgage applications. On the other hand, refinancing activity rose last week, but remains near the lowest level in two decades.
Here is a chart of mortgage applications from the Mortgage Bankers Association showing the decline in US mortgage rates, and increases in mortgage purchases and refi applications. The Refinance Index increased 5 percent from the previous week and was 86 percent lower than the same week one year ago. The unadjusted Purchase Index increased 31 percent compared with the previous week and was 40 percent lower than the same week one year ago.
The MBA survey, which has been conducted weekly since 1990, uses responses from mortgage bankers, commercial banks and thrifts. The data cover more than 75% of all retail residential mortgage applications in the US.
The Federal Reserve continues to remove the monetary punch bowl despite the global yield curve inverting and The Fed fighting Bidenflation.
On the mortgage front, mortgage applications decreased 0.8 percent from one week earlier, according to data from the Mortgage Bankers Association’s (MBA) Weekly Mortgage Applications Survey for the week ending November 25, 2022. This week’s results include an adjustment for the observance of the Thanksgiving holiday.
The Refinance Index decreased 13 percent from the previous week and was 86 percent lower than the same week one year ago. The unadjusted Purchase Index decreased 31 percent compared with the previous week and was 41 percent lower than the same week one year ago.
On the housing front, US pending home sales fell for a fifth month in October as demand continued to sag under the weight of high mortgage rates.
The National Association of Realtors index of contract signings to purchase previously owned homes decreased 4.6% last month, according to data released Wednesday. And fell -36.7% YoY.
All together now. Look at pending home sales YoY and mortgage purchase applications SA compared with M2 Money YoY.


You must be logged in to post a comment.