There was a hilarious film with Hillary Swank and Aaron Ekhart called “The Core” where earth’s core stops spinning and the earth gets cooked by the Sun’s rediation. Now we learn that the Earth’s inne core has actually stop spinning. This time, however, all that has happened is that Joe Biden is President which is almost as bad,
But also related to “The Core” is that the important Personal Consumption Expenditures (PCE) are out for December along with PCE price deflator numbers. In short, personal income was up 0.2% month-over-month (MoM) in December while personal spending was down -0.2%. REAL personal spending was down -0.3% MoM.
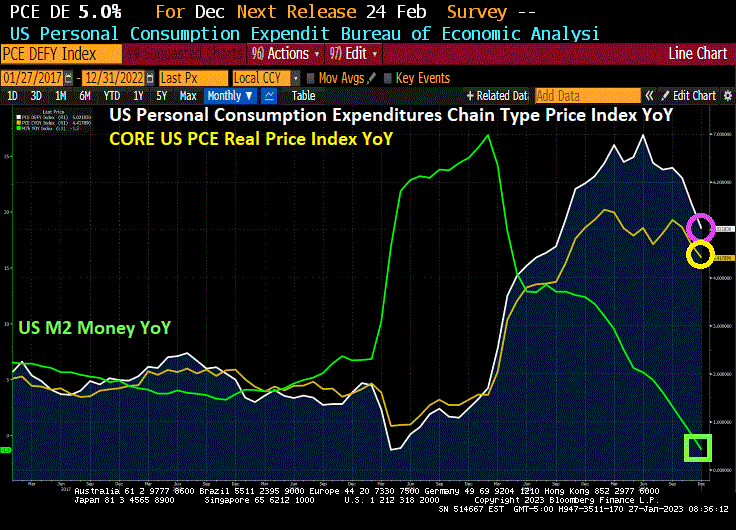
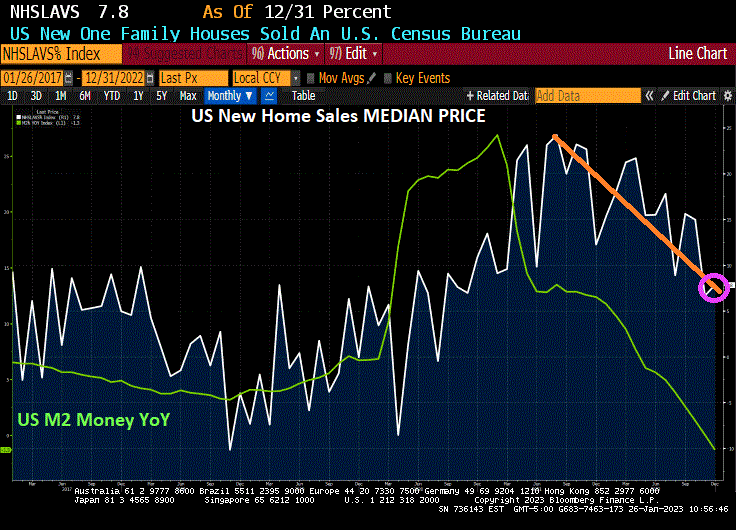
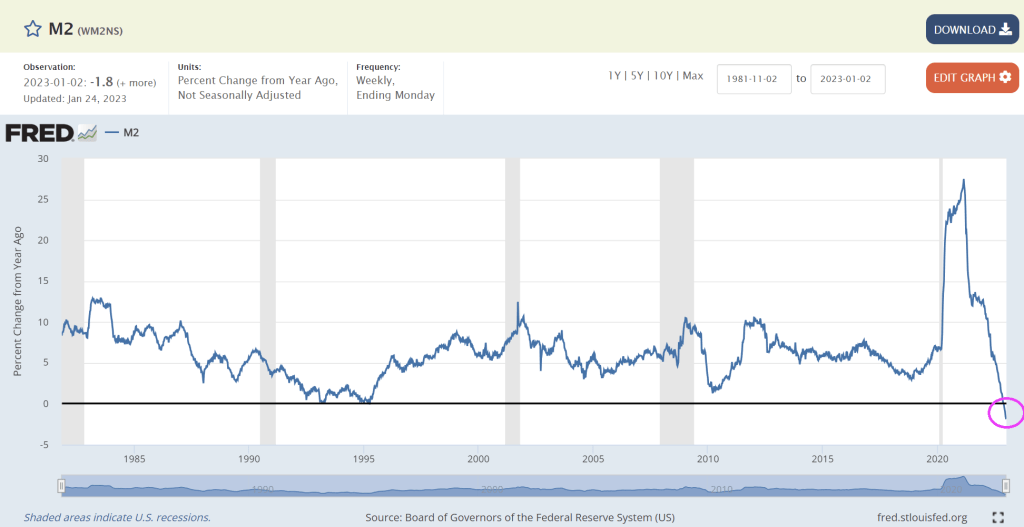
But the all important PCE deflators numbers were down all well. The REAL PCE price index (or deflator) was down to 5.0% YoY in Decmember while REAL CORE price index was down to 4.40%. All this is happening as M2 Money growth has stop spinning (down to -1.3% YoY in December).
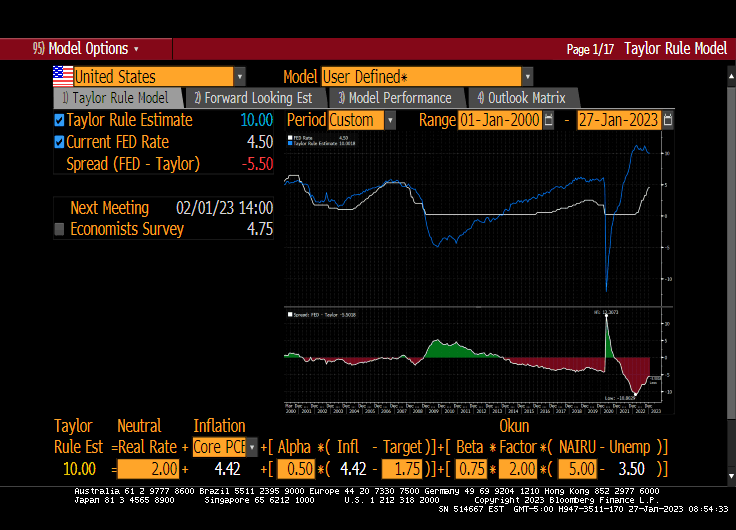
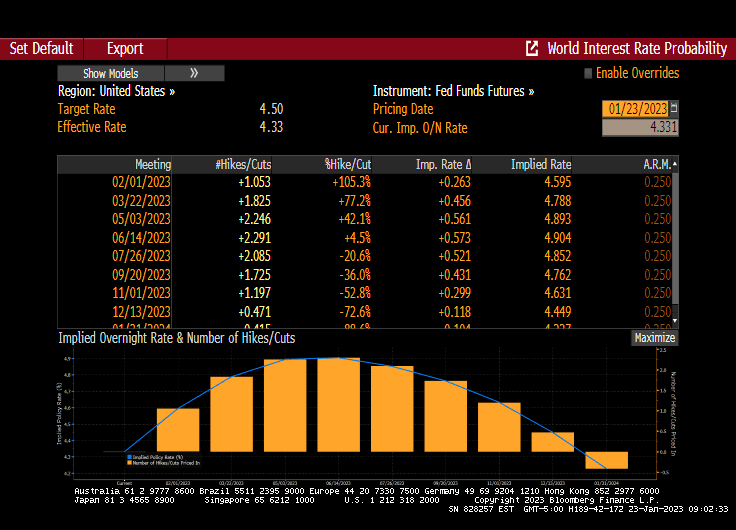
Based on a CORE PCE YoY of 4.40%, the Taylor Rules suggest that The Fed Fund Target rate should be … 10%. However, the current Fed Funds Target rate is only 4.50%, so The Fed is not even half way there.
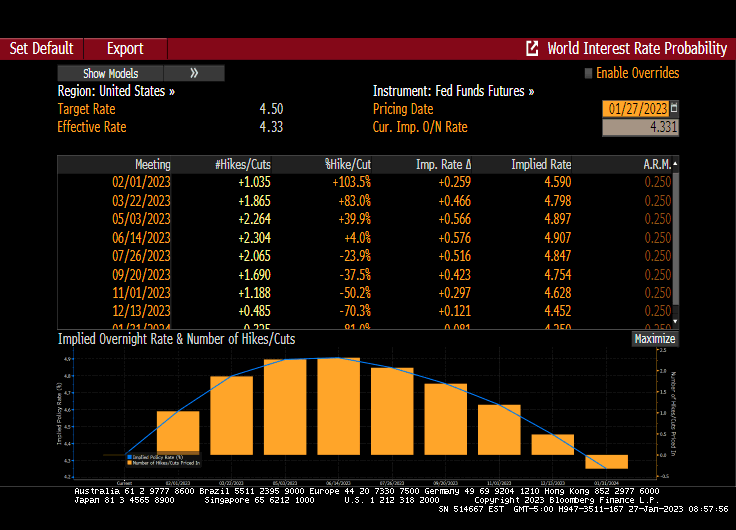
Fed Funds Futures are pointing to a peak rate of 4.90% by the June ’23 FOMC meeting, then a pivot (despite denials from Fed talking heads).
Of course, The Fed doesn’t follow the Taylor Rule or any other transparent rule for rate management. Rather, Fed Chair Powell like former Chair (and current Treasury Secretary Janet Yellen) follow a more seat-of-the-pants approach.
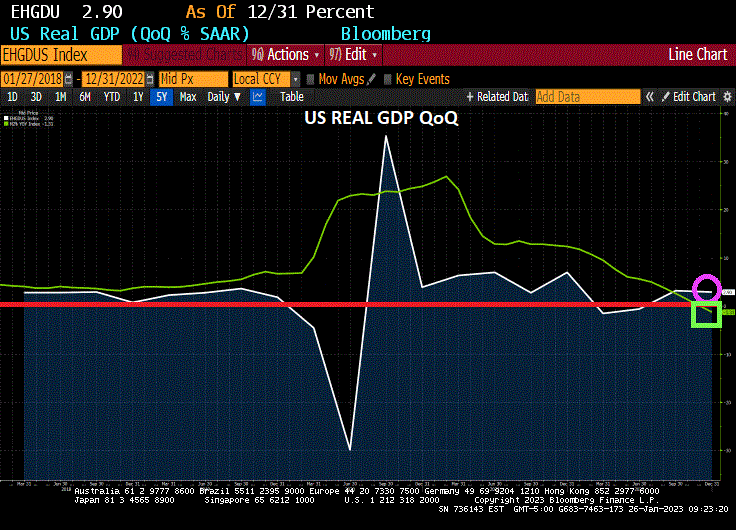
Today’s GDP report from the BEA reminds me of the Peggy Lee song “Is That All There Is?” Between the massive Fed monetary stimulus since late 2008 (and particularly since Covid in 2020) and all the Federal spending (Covid relief, Inflation reduction, Omnipork spending bill, etc.), US real GDP rose by only 2.9% in Q4 from Q3.
But signs of slowing underlying demand mounted as the steepest interest-rate hikes in decades threaten growth this year.
Gross domestic product increased at a 2.9% annualized rate in final three months of 2022 after a 3.2% gain in the third quarter, the Commerce Department’s initial estimate showed Thursday.
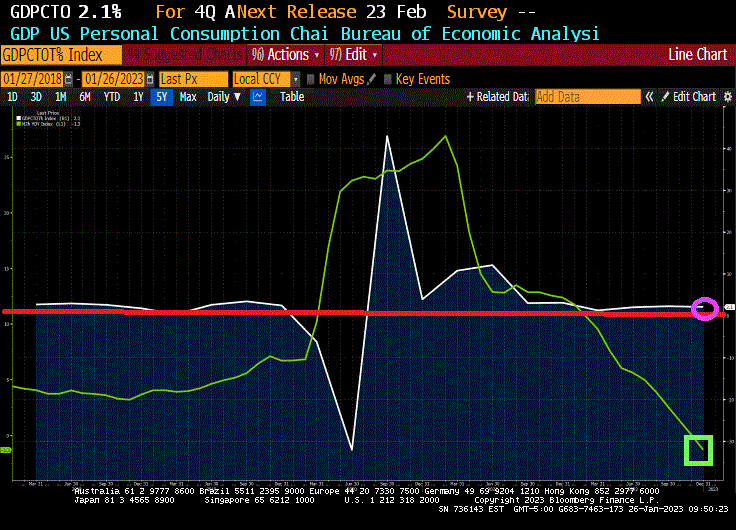
Personal consumption, the biggest part of the economy, climbed at a below-forecast 2.1% pace (forecast was for 2.9%). Again,
The report also showed some signs of stress for American consumers whose wages have failed to keep up with inflation and continued to encourage them to draw down savings accumulated from government pandemic-relief programs. The burden of elevated prices and higher borrowing costs is mounting, pointing to a tenuous outlook for the economy.
A key gauge of underlying demand that strips out the trade and inventories components — inflation-adjusted final sales to domestic purchasers — rose an annualized 0.8% in the fourth quarter after a 1.5% gain.
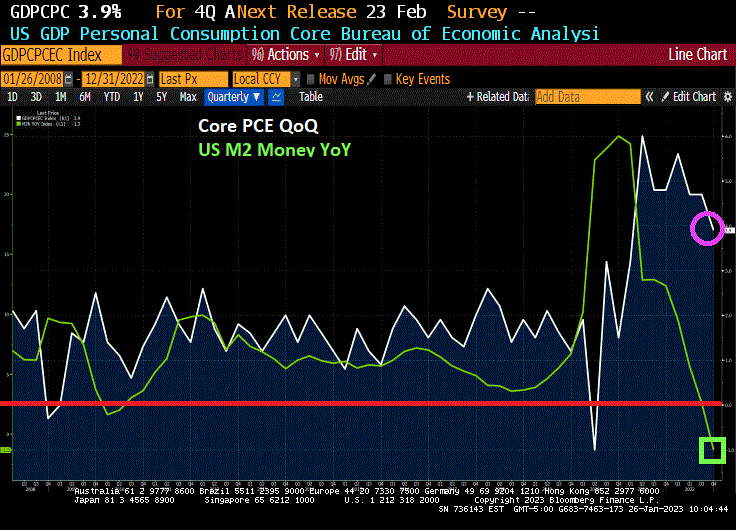
Core PCE growth grew at 3.9%, but is slowing already as M2 Money growth dies.
Stock-index futures and Treasury yields remained higher and the dollar was little changed after the GDP report and better-than-expected weekly jobless claims. Applications for unemployment insurance dropped to 186,000 last week, the lowest since April.
Recent data show cracks are developing more broadly. Retail and motor vehicle sales data showed households are starting to retrench, the housing market continues to weaken and some businesses are reconsidering capital spending plans.
As the Federal Reserve continues to hike interest rates to ensure inflation is extinguished, housing and manufacturing have deteriorated quickly while industries including banking and technology are carrying out mass layoffs.
The GDP report showed the personal consumption expenditures price index, a key inflation metric for the Fed, rose at an annualized 3.2% rate in the fourth quarter, down from a 4.3% pace in the prior three months. The core index that excludes food and energy climbed at a 3.9% rate compared with 4.7% paces in the prior two quarters. Monthly data for December will be released Friday.
The moderation in price pressures is consistent with forecasts that the Fed will further scale back its tightening campaign next week, when it’s expected to raise rates by 25 basis points. Policymakers boosted the benchmark rate by 50 points in December after 75 basis-point hikes at their previous four meetings.
The world’s largest economy expanded 2.1% last year. In 2021, when demand snapped back from pandemic-related shutdowns, the economy grew 5.9% — the best performance since 1984.
The GDP data showed services spending increased at 2.6% annualized rate in the October-December period, the slowest since last year’s first quarter. Outlays on goods rose at a 1.1% pace, the first advance since 2021.
Business investment slowed sharply after a third-quarter surge. Spending on equipment declined an annualized 3.7%, the most since the second quarter of 2020. Outlays for structures rose at a 0.4% pace.
Let’s hope the BEA isn’t padding the numbers like the BLS was caught doing in the first half of 2022.
Lastly, US Real GDP growth YoY FELL to only 0.95925% as M2 Money growth disappears.
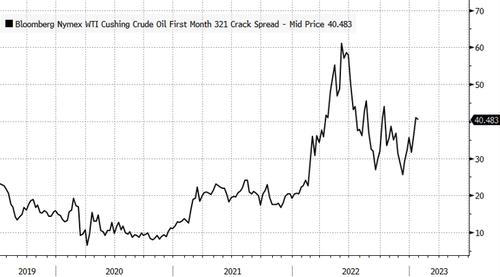
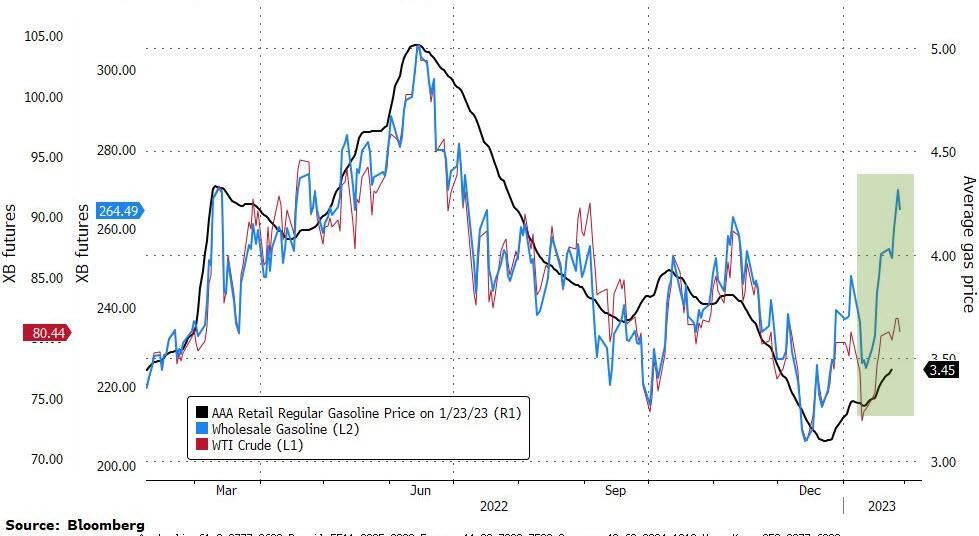
The 3-2-1 crack spread is a great indicator to gauge fuel product tightness. High spreads indicate gasoline, diesel, jet fuel, and other petroleum products are in short supply, while low spreads mean an abundance of supply. Spread direction is also important — if rising, it would mean fuel inventories are declining.
The simple calculation of refining margins is for every three barrels of crude oil the refinery processes — it makes two barrels of gasoline and one barrel of distillates like diesel and jet fuel.
On Tuesday, the crack spread hit a three-month high of $42 a barrel. For some context, the five-year January average is $15.56.
Reuters pointed out that refinery outages exacerbate fuel supply tightness.
A diesel producing unit at PBF Energy’s (PBF.N) Chalmette, Louisiana, refinery was shut following a fire on Saturday. It could be out for at least a month. Exxon Mobil (XOM.N) said Monday it will perform planned maintenance on several units at its Baytown, Texas, petrochemical complex.
The ongoing refinery maintenance season could be much lengthier than usual, with many U.S. Gulf Coast refineries still running below capacity after Winter Storm Elliott knocked out some 1.5 million barrels per day of refining capacity in December. A Suncor refinery in Commerce City, Colorado, has remained offline since the storm.
Also, the number of refinery overhauls is double the amount this spring. Many of these overhauls were postponed due to the pandemic. Some are due to record-high margins driving increased profitability for oil companies.
There are at least 15 oil refineries plan maintenance ranging from two to 11 weeks through May, tallies by Reuters and refining intelligence firm IIR Energy show. By mid-February, U.S. refiners will drop some 1.4 million barrels per day of processing capacity, double the five-year average.
“A lot of plants didn’t want to shut down last year when margins were strong, but they have to get this work done,” said John Auers, refining analyst with Refined Fuels Analytics.
Nine U.S. refineries operated by Marathon Petroleum, Valero Energy, Exxon Mobil, Phillips 66, and BP will shutter some of their fuel-producing units this spring, according to IIR and Reuters sources.
All of the outages and planned overhauls are going to make it difficult for refiners to catch up with demand as inventories are relative to historical levels.
“If we aren’t hearing the alarm bells, it’s because we’re deaf after refining margins reached eye-watering levels in 2022, when the 3-2-1 crack spread briefly surged above $60. But from a historical perspective, current margins are sky-high, as well,” Bloomberg Opinion’s Javier Blas said.
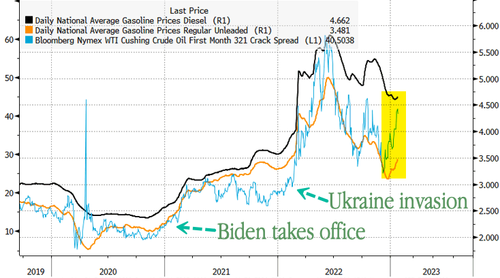
According to AAA data, gasoline and diesel prices at the pump are starting to move higher after months of declines following the rise in the 3:2:1 crack spread.
And the ‘raw materials’ for the refining process are rising rapidly…
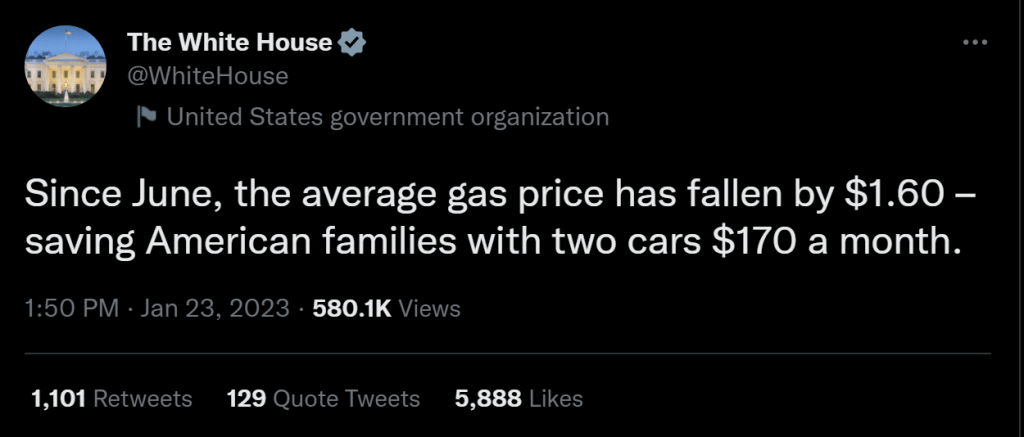
Perhaps the victory lap was a little premature?
Mission Accomplished 2.0?
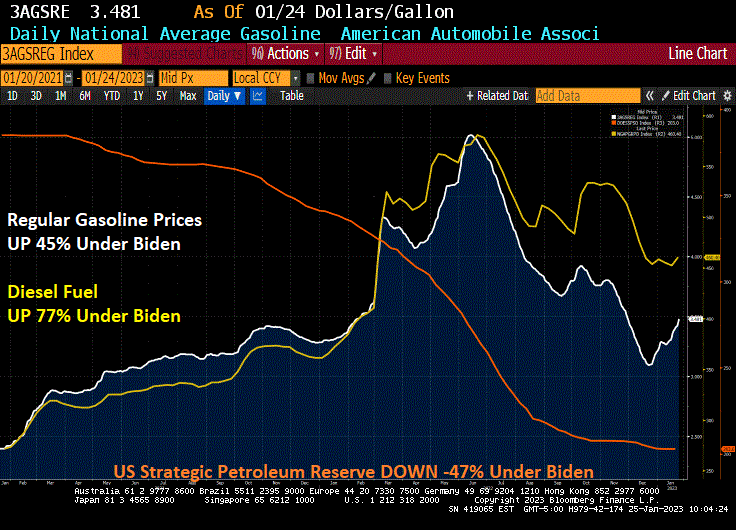
Not really. US gasoline prices are UP 45% under Biden, diesel prices (the lifeblood of the shipping industry) are UP 77 under Clueless Joe and the Strategic Petroleum Reserve is DOWN -47% under China Joe.
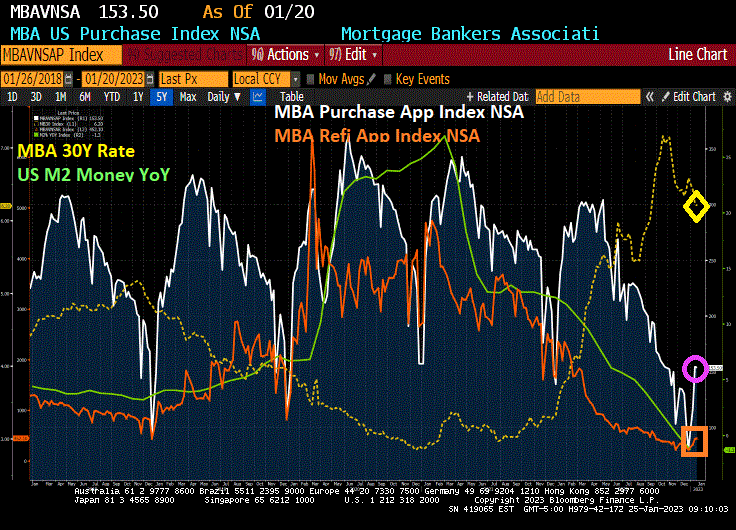
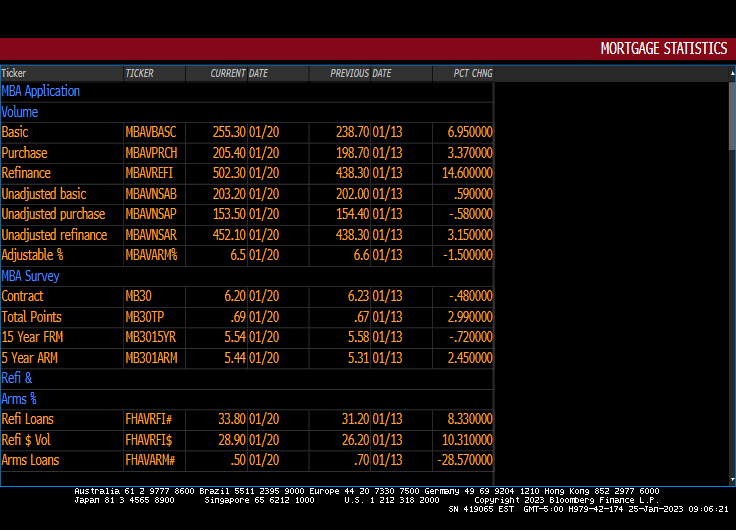
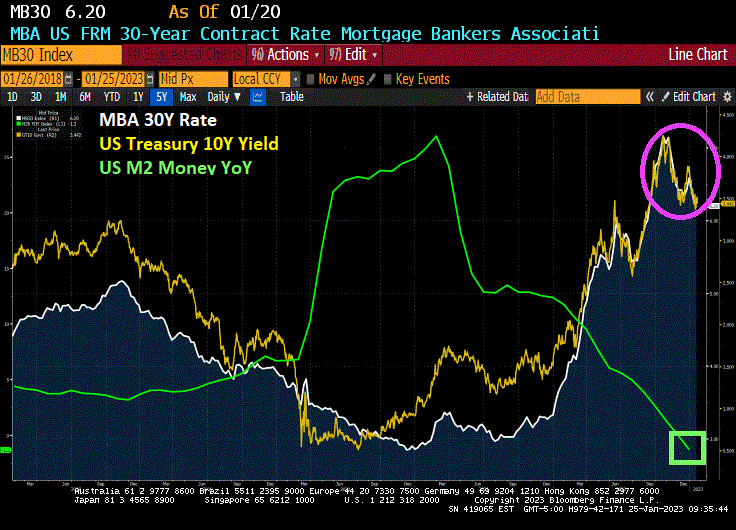
Falling mortgage rates are having a predictible effect on mortgage refinancing applications, but not so much for mortgage purchase applications.
Mortgage applications increased 7.0 percent from one week earlier, according to data from the Mortgage Bankers Association’s (MBA) Weekly Mortgage Applications Survey for the week ending January 20, 2023. This week’s results include an adjustment for the observance of Martin Luther King, Jr. Day.
The Refinance Index increased 3.15 percent from the previous week and was 77 percent lower than the same week one year ago.The unadjusted Purchase Index decreased 1 percent compared with the previous week and was 39 percent lower than the same week one year ago.
Generally speaking, declining mortgage rates are due to declining 10-year Treasury yields. And 10-year Treasury yields decline as the economy weakens. Of course, M2 Money growth YoY is now 0% as The Fed tightens.
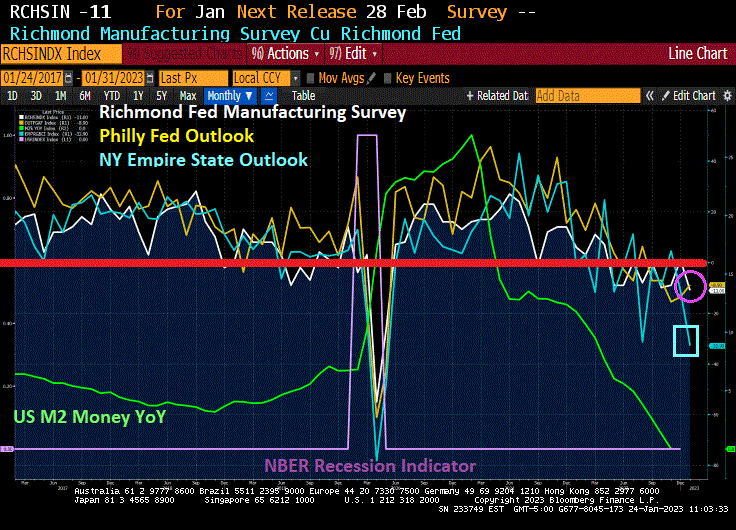
Three regional Fed reports I like to watch are New York’s Empire State Outlook, Philly Fed’s Outlook and Richmond Fed’s outlook. Today, The Richmond Fed released their manufacturing outlook and … it declined to -11.
So the big three are all down (Philly down to -8.9 while NY’s Empire State outlook is down to -32.9.
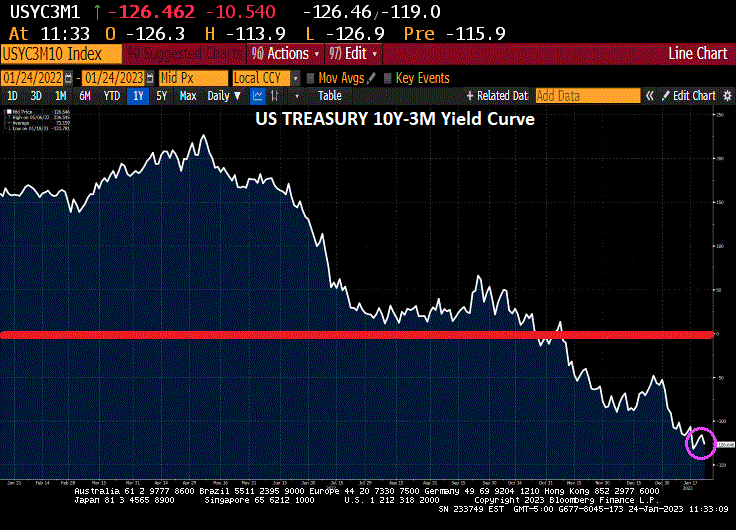
On the Treasury front, the US 10Y-3M yield curve inverted further (a signal of impending recession) just tanked to -126.462 basis points.
While the children in Congress and the Administration argue about cutting the Fedcral budget (as if there isn’t trillions of dollars of wasteful spending in the budget), we saw an even dumber suggestion from Pramila Jayapal (WA-D), Adam (Shifty) Schiff (CA-D) and Sheila Jackson Lee (TX-D): a bill to eliminate the debt ceiling altogether to allow unlimited Federal spending. That reminds me of the Tom Arnold/Julie Ford film “The Stupids.” Yet these clowns keep getting re-elected.
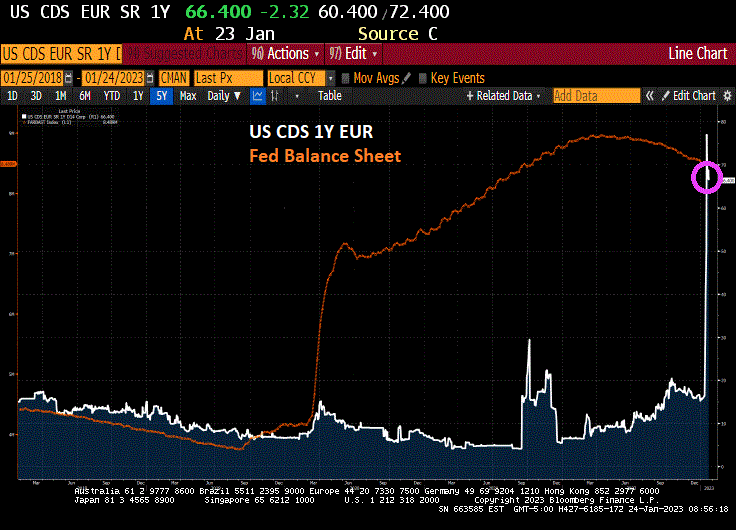
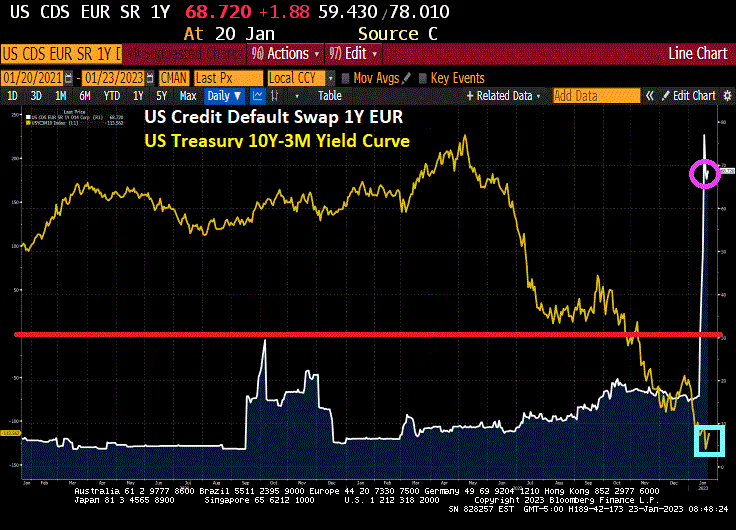
In any case, The Federal Reserve’s quantitative-tightening program risks being propelled toward an early end as US politicians bicker in Washington over raising the national debt limit, according to some economists and bond-market participants. As of this morning, the US credit default swap (1-year CDS) remains elevated signaling a positive probability of a US debt default. (CDS represents the price of insuring against a default).
But notice that The Fed still has $8.5 TRILLION in assets (largely Treasuries and Agency MBS) on their balance sheet. But The Fed’s plans to continue shrinking their balance sheet will be put on hold (and if fact will be reversed) if Democrats and President (10% for the big guy) Biden don’t budget on cutting some of the enormous fat from the Federal budget.
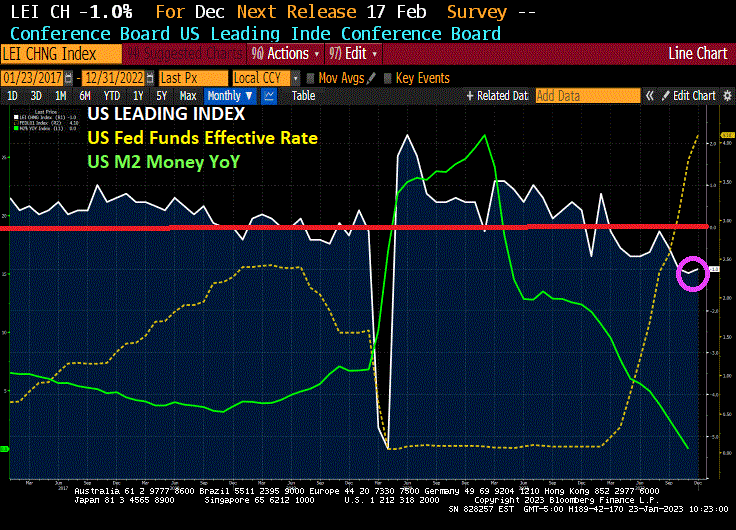
The Conference Board’s Leading Indicator should be called The Bleeding Indicator given that the leading index has declined to 10 straight months. This is happening as The Fed tightens monetary policy to combat inflation.
Leading indicators include economic variables that tend to move before changes in the overall economy. These indicators give a sense of the future state of an economy.
Ah, the start of a new week with Treasury Secretary Janet Yellen arguing (with a straight face) that there is no room in the Federal budget for cuts. Apparenly, Yellen never read any of the massive, pork-laden spending bills signed by Biden (no one else did in Congress either, nor did Biden).
Let’s start with the US credit default swap (1 year). It remains high at 68.72 (the price of insuring against a US default). And the US Treasury yield curve (10Y-3M)? It remains deeply inverted at -114 basis points this morning signaling an impending US recession.
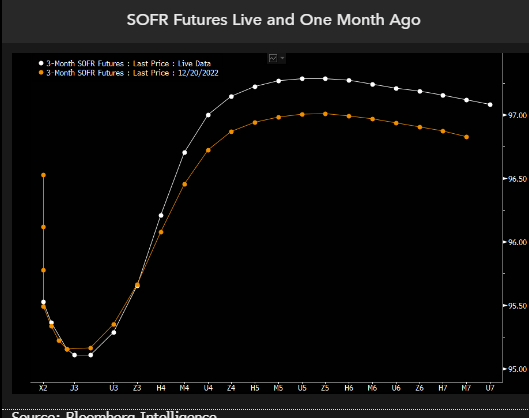
Then we have SOFR (Secured Overnight Financing Rate). SOFR futures are pricing for the Federal Reserve to hike rates a few more times and to start cutting before the end of this year. The pricing for the 2023 rate path is little changed from a month ago, but this year the market has priced in deeper cuts in 2024, with SOFR now seen below 3% by early 2025 before stabilizing. The implication is that hedging recession and significant rate cuts in 2024 now seems to be fully priced in, yet there’s a risk that the Fed cuts even deeper than the market is factoring in.
We think the market is partially preparing for the risk of even deeper rate cuts than linear instruments are pricing. To see how dramatic those are, we can look at options on SOFR futures and model what’s being priced by the volatility surface.
We are seeing the same story if we look at Fed Funds Futures data. Fed rate hikes until June, then rate cuts to follow.
How did Biden’s lawyers and now the DOJ figure out that Biden has classified documents all over the place? Probably from reading “The Hardy Boys.” Except that Biden didn’t cleverly hide classifed documents. Rather, he carelessly left them lying around at The Penn Biden Center and his home in Wilmington Delaware that he shared with his son, Hunter. And probably on the Amtrak train he would take from Wilmington to Union Station in DC. And probably at Chinatown Garden, a short walk from The White House.


You must be logged in to post a comment.