How Fed Tightening Of Rates, Not Balance Sheet, Impacts Mortgage Rates (NAHB Traffic Tanks In August)

The US housing market is sensitive to Fed “catch-up” monetary tightening. For example, the NAHB’s traffic of prospective homebuyers declined rather dramatically in August as The Fed tightened rates and the 30yr mortgage rate rose. That is what I call a “Nestea Plunge.”

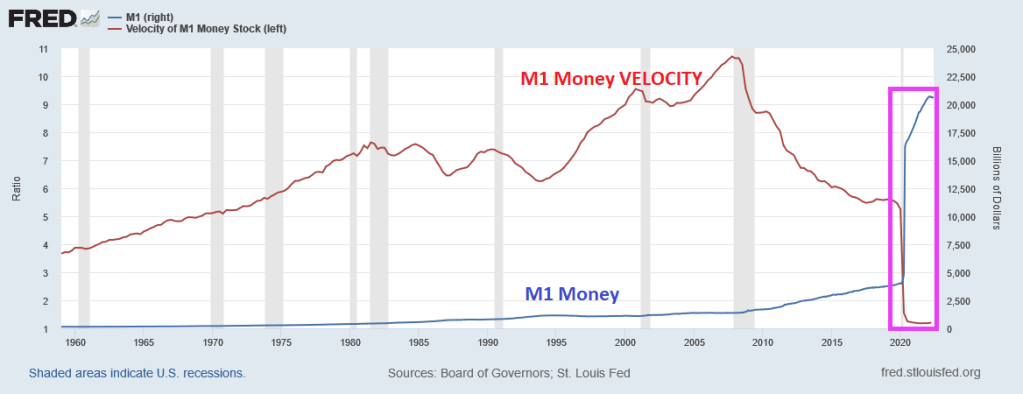
How are mortgage rates impacted by Fed monetary policy? While The Fed began really “sloshing” markets with excess stimulus (QE in late 2008), the latest round of QE (or asset purchases) came with the US Covid shutdowns (what genius thought of that??) and that stimulus has NOT been withdrawn yet. Only the Fed Funds Target rate has tightened.

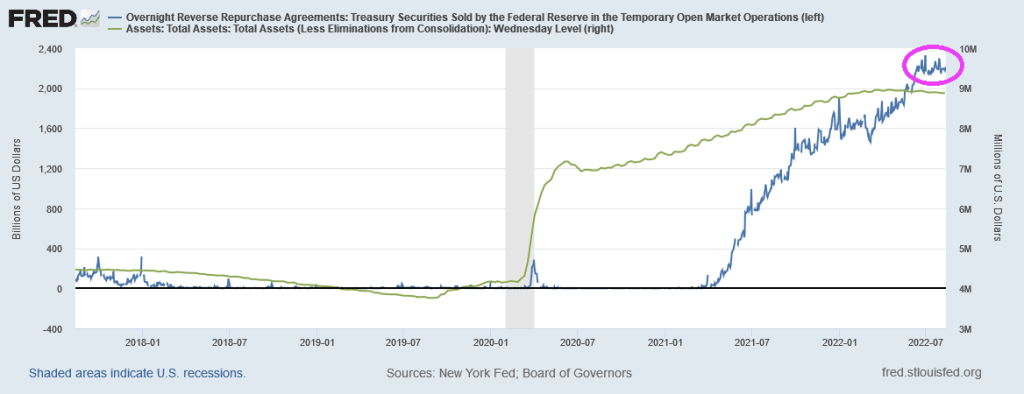
The 30yr mortgage rate rose with Fed rate tightening, but the Fed’s System Open Market Holdings (SOMH) of Treasury Notes and Treasury Bonds has come down a bit. But not the pare-down The Fed has hinted at. The 30yr mortgage rate is cooling as the prospect of future Fed rate hikes declines.

As of this morning, The Fed Funds Futures market points to rates rising until March 2023 … then easing again.

One reason The Fed has been slow to sell assets off its balance sheet is that a large chunk of T-Notes and T-Bonds are maturing shortly. It will be a matter of whether The Fed reinvests the proceeds or lets the balance sheet wind-down.

The Magic Formula For REIT Investing (What Will The Fed Do?) Powellburg Omen??

Real estate investment trusts (REITs) are an interesting asset class, allowing investors to purchase shares in large-ticket assets like multi-family properties or shopping centers. But given the changing landscape due to online shopping (aka, the Amazon effect), Covid economic shutdowns, etc., REITs should be having a hard time. But aren’t. How come?

Covid economic shutdowns definitely took its toll on retail shopping centers, as an example. And you can see the plunge in the NAREIT All equity index in early 2020. But the NAREIT All-equity index rallied … until The Federal Reserve started tightening their loose monetary policy. Note that as the implied O/N rate rose (orange line), REIT shares declined.

But as the WIRP implied O/N rate settled (pink box), the NAREIT index began to climb again. It is clear that REITs, like other equities, benefit from Fed easing. But how long will The Fed continue tightening?

As of this morning, The Federal Reserve is anticipated to raise their O/N rate to 3.738% by March 22, 2023. Then begin lowering their target rate … again.

Sadly, REITs, like other equity investments such as the S&P 500 index, are sensitive to The Fed’s easing/tightening. Look for REITs to struggle as The Fed tightens, then rally as The Fed eases again.

Here is the (in)famous Hindenburg Omen. Notice how the Hindenburg Omen alarm bells (yellow and red dots) have been silenced by The Fed. But as The Fed tightens (at least until March ’22), we may see the Hindenburg Omen flashing again. Call it the Powellburg Omen.

The NCREIF property index had a decline in the Covid-outbreak era (early 2020) and you can see a slight slowdown in the NCREIF index as The Fed started tightening to fight inflation.

MBA Mortgage Purchase Applications Down 2% WoW, Down 18% YoY (Refi Apps Down 5% WoW, Down 82% WoW)

Mortgage banking in today’s environment reminds me of downhill skiing. Lots of danger lurking ahead.

Mortgage applications decreased 2.3 percent from one week earlier, according to data from the Mortgage Bankers Association’s (MBA) Weekly Mortgage Applications Survey for the week ending August 12, 2022.

The seasonally adjusted Purchase Index decreased 1 percent from one week earlier. The unadjusted Purchase Index decreased 2 percent compared with the previous week and was 18 percent lower than the same week one year ago.

The Refinance Index decreased 5 percent from the previous week and was 82 percent lower than the same week one year ago. 

Please bear in mind that we are in the “dog days” of mortgage applications. Purchase applications usually peak in April/May, then it is all down hill until the end of the year.

Meet Me At The Bottom? US Housing Starts (1-Unit) Tank -18.5% YoY In July (Down -10.11% MoM, Apartment Starts Down -10% MoM)

Meet Me At The Bottom … of the housing market?

As The Federal Reserve fights inflation (caused by too much Fed stimulus for too long) and Federal energy policies, we are seeing mortgage rates rising and the housing market decaying.

1-unit (single family detached) housing starts dropped -18.5% YoY in July as mortgage rates rose in 2022. Note the impact of the Covid stimulus (green line) and the resulting surge in housing starts in April 2021, but housing starts have decayed as M2 Money growth slows.

5+ unit (apartment) starts were down -10% MoM in July, but at least permits for apartments rose +2.51% MoM.

Well, we at least know why the NAHB Homebuilder index sucked wind so badly yesterday.

Perhaps the housing market needs a little spoonful of QE.

Jay’s Famous Chili! M1 And M2 Money Velocity Crushed By Covid “Relief” As US Treasury Yield Curve (10Y-2Y) Remains Inverted

The 2020 Covid outbreak led to a massive (and generally awful) reaction. There were economic shutdowns that caused extensive damage (particularly to small firms), but it was the massive overreaction by The Federal government in terms of Covid relief and The Federal Reserve’s expansion of the money supply that caused considerable damage.

One truly horrific chart is that of M1 Money and M1 Money Velocity (M1/GDP). M1 Money surged with Covid driving M1 Money Velocity down to levels never seem before.

The broader measure of money, M2, isn’t as dramatic, but we also see that M2 Money VELOCITY has plunged to levels never seen before.

What does low money velocity indicate? Simply put, The Fed is printing trillions of dollars, but GDP isn’t moving much. But that won’t stop Congress from spending (and using The Fed to buy its debt).

So, here we sit. This morning, the US Treasury yield curve (10Y-2Y) remains inverted. This AM, the curve inverted another -.591 basis points to -42.725, a sign of impending recession.

Yes, we are living through Jay Powell’s famous chili episode where money velocity is near historic lows and we have an inverted yield curve.

BTW, congratulations to Will Zalatoris (aka, Happy Gilmore’s caddy) for his first PGA Tour victory at the FedEx St. Jude Championship!

Inflation: The Little People Tax (Food UP 10.91% YoY, Home Prices Up 20% YoY, Fed’s Reverse Repos Remains Over $2 TRILLION)

Only in today’s Kafkaesque (having a nightmarishly complex, bizarre, or illogical quality) Federal government would Biden, Schumer and Pelosi cheer about passing a bill hilariously called “The Inflation Reduction Act” that not only will NOT reduce inflation, but also raises taxes on most Americans.

In terms of the inflation tax on the middle class and low-wage workers, we see that FOOD inflation was 10.91% YoY in July and the BLS’s low-ball estimate of “rent” at 5.76% YoY. Odd, since home price growth is 19.75% YoY.

The Fed’s monstrous balance sheet is still near $9 TRILLION (over stimulus) and The Fed’s Overnight Repo Facility remains near $2 TRILLION.

Industrial electricity costs (to be passed on to consumers in the form of higher prices) is up 24.4% YoY. Residential electricity cost is up “only” 7.4% YoY. (Source: Mish GEA)

I loved the Arizona Senator Kyrsten Sinema photo-op at the drought-plagued Lake Mead, where she bragged about $4 billion for drought mitigation. I really do hope that it works, but I fear that it will like Obama’s spending on green energy debacle like Solyndra. That is, billions spent and nothing improves.

Here is a painting of me standing at the Social Security office.

Winter Is Coming! Mortgage Rates, Gasoline Prices, Food Price Growth Slowing As Money Printing Slows (Just Wait For Winter!)

Politicians like to (falsely) take credit for things, such as Biden bragging about gasoline prices declining. Bear in mind that regular gasoline prices were $2.88 when Biden was inaugurated as President, rose to over $5 a gallon in June and now have declined to $3.98 for which Biden is taking credit. So, regular gasoline prices are still up 34% under Biden. Ouch!

But other rates and prices are dropping too. Bankrate’s 30yr mortgage rate started at , broke the 6% plane on June 21, 2022 only to drop to 5.53% on Friday. CRB’s foodstuffs price index started at 370.58 on Biden’s inauguration as President, rose to 606.71 on May 17, 2022 then retreated to 561.32 on Friday, August 13th. Even headline inflation (CPI YoY) is cooling … slightly.

You can see the recent declines in mortgage rates, gasoline and food prices (pink box) that corresponds to a shrinking of the US M2 Money stock growth. M2 Money is still growing at torrid pace (8.5% YoY) almost back to pre-Covid stimulypto levels of 6.8% YoY. So shrinking M2 Money growth is helping reduce mortgage rates and inflation, food/gasoline prices.

Instead of trying to remove Fed stimulus even more, Biden and Congress passed the “Inflation Reduction Act” which will barely scratch inflation and raises taxes across the board (despite Biden’s promise that no one making under $400,000 will see a cent of increase taxes). And Biden’s preposterous promise ignores the inflation tax which has been severe and still growing at 8.5% YoY. Not 0% as Biden and Harris claimed.

But wait for winter as food, gasoline and heating prices start to soar again.

My favorite dim-witted explanation of inflation belongs to Democrat Representative Pramila Jayapal who recently claimed that “inflation is a theoretical word that economists use.” Like the brilliant Milton Friedman???

University Of Michigan Consumer Sentiment Index Improves From Disastrous To Horrible (Buying Conditions For Houses Remains Horrible)

The University of Michigan consumer survey is out for August and the results show improvement … from disastrous to just plain horrible.

The University of Michigan Buying Conditions for Houses remained depressed and didn’t improve.

Bear in mind that today’s consumer sentiment reading in the lowest since 1970, lower than during any recession.

The Conference Board’s leading economic indicator plunged in June despite nearly $8 trillion in Fed stimulus still outstanding.

The good news? President Biden and his son Hunter boarded Air Force One for a carbon-spewing plane trip to South Carolina for a one-week vacation. At least he can do less damage to the US while on vacation.

US Producer Price Index Cools To 9.8% YoY In July As M2 Money Growth Cools And Recession Probability Increases

Somehow I doubt if Biden, Harris and Jean-Pierre (Biden’s Press Secretary) will go on the talk show circuit talking about the Producer Price Index Final Demand at 9.8% YoY, meaning that inflation is still raging.

But the curious thing about the PPI Final Demand numbers. While lower than June’s reading of 11.3% YoY, it also coincides with declining gasoline prices and declining growth in M2 Money stock. Which is still growing at 5.9% YoY. The probability of recession is rising (even though technically the US is in recession after 2 consecutive quarters of negative GDP growth.

Here is the more striking chart.

So is the US “improving” on prices because of brilliant Biden strategies (I just laughed at my own “bon mot”)? Or are prices (PPI, gasoline) slowing because of declining demand as the US slips into recession?

Lawrence Summers was once again in the news saying that the way to cool inflation is to raises taxes (and cool demand). Only a true Statist would say something like that. Larry, how about Biden and Congress stop spending so much money that is helping to fuel inflation?

One Washington DC types would rest their hopes on cooling inflation by having the US slip into recession AND raises taxes.

Biden looking for a way out.

Jurassic MBS Market! Agency MBS Prices Swoon With Implied Fed Hikes (Duration Risk Increases Too)

Agency mortgage-backed securities (MBS) prices started to degrade as The Federal Reserve started to try to combat inflation caused by Biden’s energy policies and rampant Federal spending. That is, under June when the implied Fed O/N rate (red line) cooled and the 30-year mortgage rate (blue line) has come down a little.

In terms of duration risk, the FNCL 3% MBS duration has risen with anticipated Fed tightening.

So, further Fed tightening will result in greater MBS losses AND rising duration risk.

Hold on to your butts!