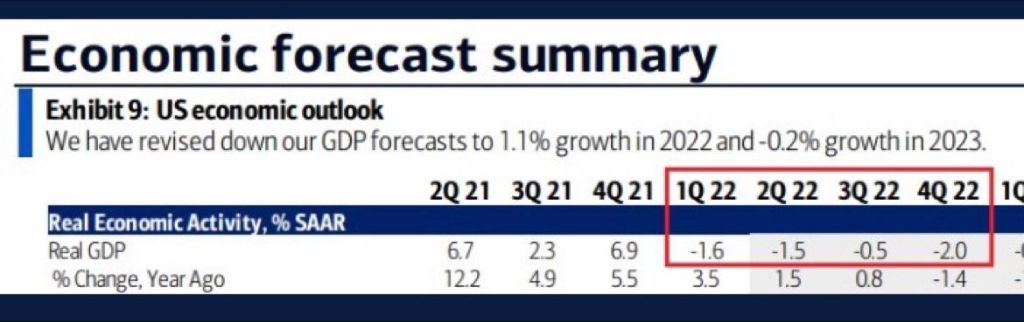
Bank of America is predicting 4 straight quarters of negative real GDP growth.
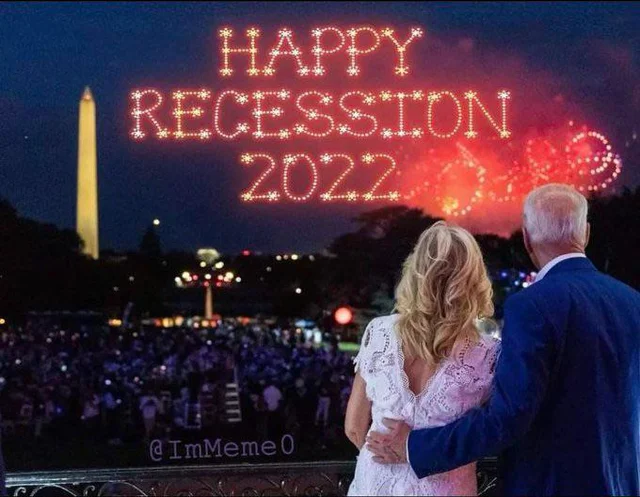
2022 is shaping up for a bad year.

Confounded Interest – Anthony B. Sanders
Financial Markets And Real Estate
Bank of America is predicting 4 straight quarters of negative real GDP growth.
2022 is shaping up for a bad year.
In case you are wondering why Biden’s approval ratings are so terrible, check out this chart.
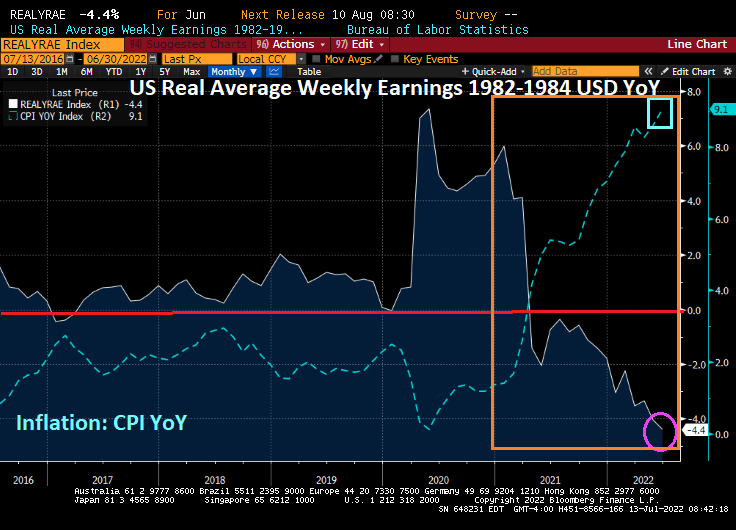
Under Biden’s Reign of Error, inflation has soared to 9.1% YoY and the NFIB Small Business Optimism Index has crashed.

REAL Avg Weekly Earnings plunged To -4.4% YoY.
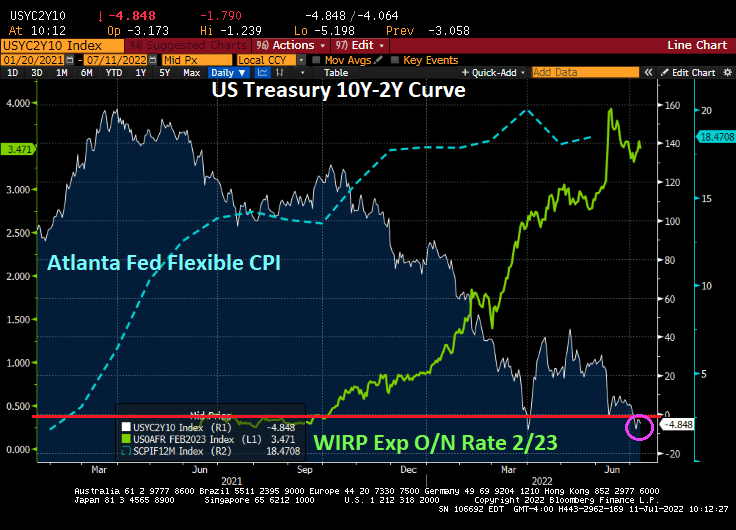
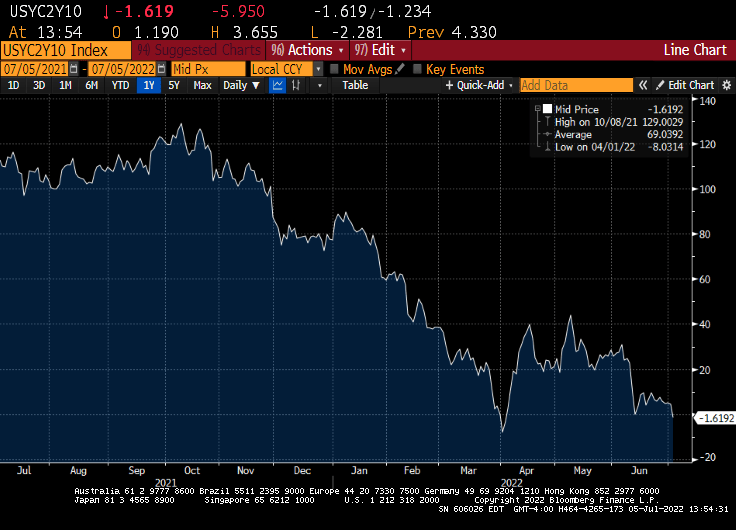
With the hot inflation numbers, the US Treasury 10Y-2Y yield curve inverted to -17.6 basis points.

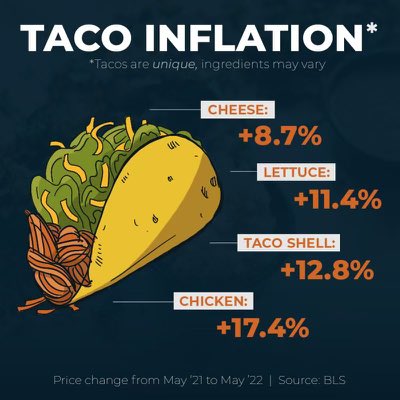
And in honor of US First Lady Jill Biden’s idiotic comments about Hispanic culture, we see that inflation is hitting tacos hard.
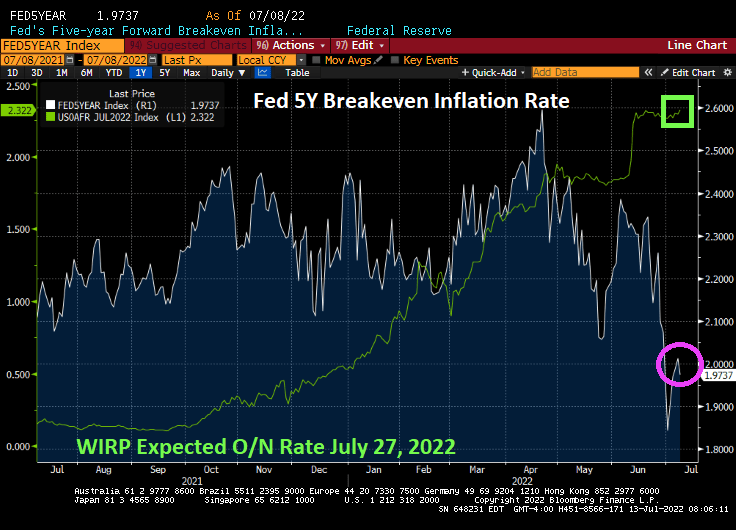
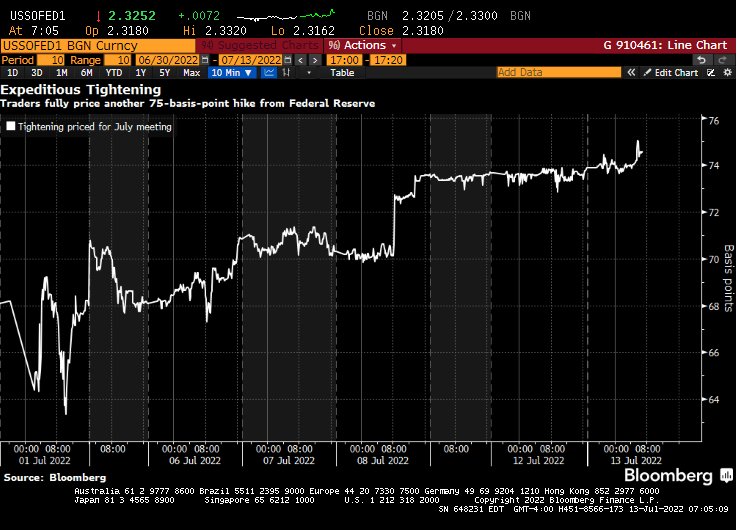
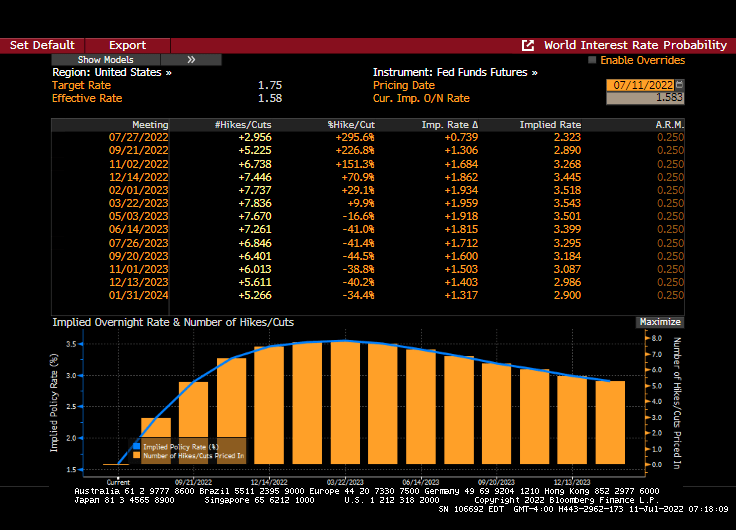
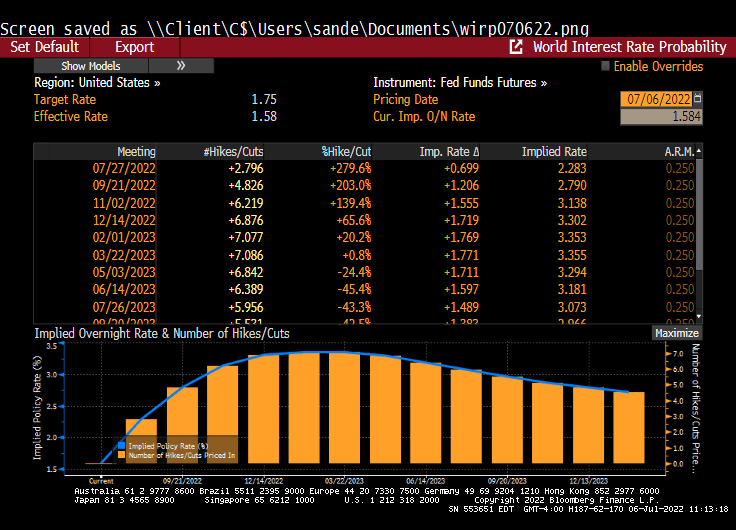
Here we go loop de loop! Traders are pricing in a 75 basis point rate increase at the July FOMC meeting despite collapsing Fed 5-year inflation breakeven rates.
Money markets are betting on a three quarter-percentage point hike by Federal Reserve officials later this month, wagering the US will need to ramp up the pace of monetary tightening to tame inflation.
The repricing comes ahead of a key inflation report due Wednesday. The headline figure for June is set to accelerate to 8.8% year over year, the highest since 1981.
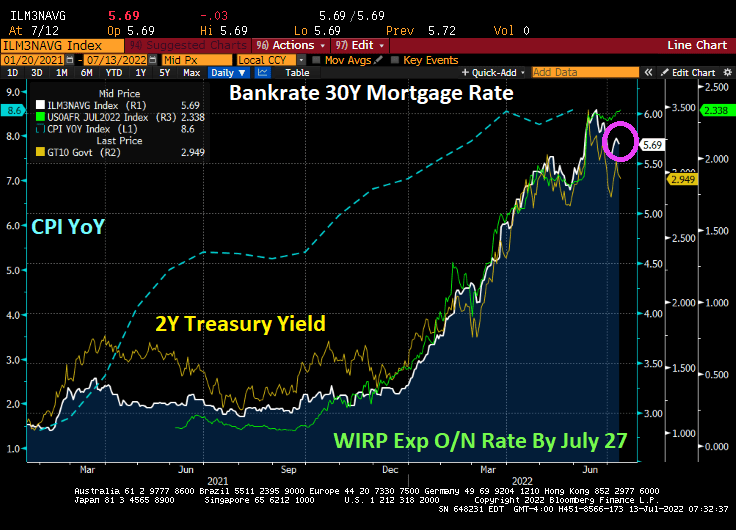
Bankrate’s 30Y mortgage rate fell slightly ahead of today’s inflation report with the expectation of The Fed hiking their target rate by 75 basis points to 2.338% at the July 27th Fed Open Market Committee meeting.
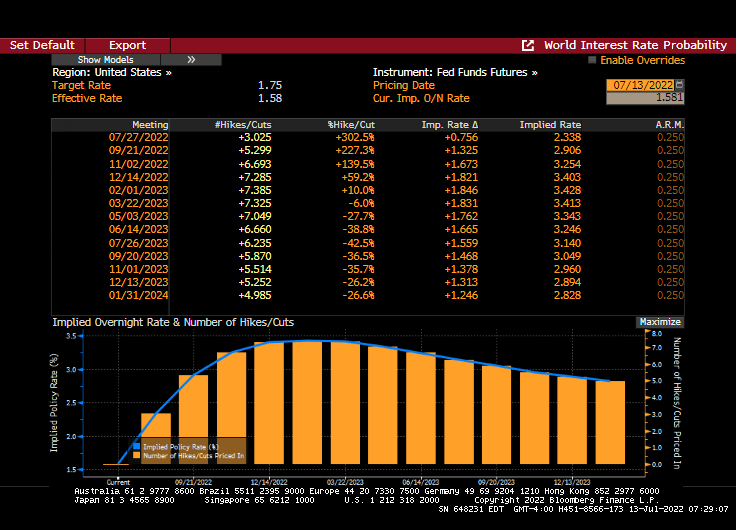
Trader expectations from Fed Funds Futures data:
Last night I watched “The Shallows” on Peacock TV. I thought from the title that it was going to be a biography of The Federal Reserve, but it was a film about a surfer being attacked by a shark.

We are across the great divide! In terms of house prices and affordability.
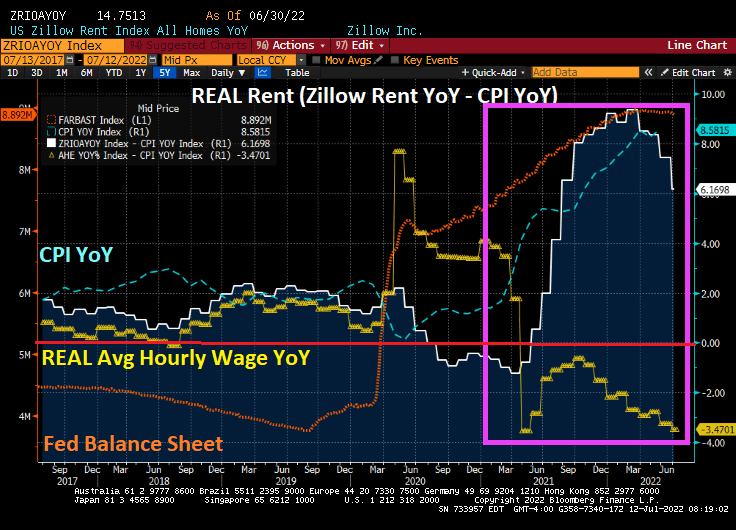
We are all aware that inflation is soaring, since the Covid outbreak in 2020 and the massive overaction by The Federal Reserve and Federal government in terms of stimulus spending and economic lockdowns.
Things were “normal” before Covid in that REAL housing rent (white line) and REAL average hourly earnings YoY (yellow line) moved together. But after Covid shutdowns and Federal stimulus “relief” (orange line), we see that inflation (blue line) took off along with the growth in housing rent. The problem, of course, is that REAL average hourly earnings YoY has been declining. I call this “The Great Divide in housing affordability”.
The question, of course, is whether The Federal Reserve will continue their “war on inflation” with a 75 basis point rate increase.
Inflation is at its fastest pace in 40 years, and is expected to increase even higher in tomorrow’s inflation report.
Gasoline prices have been dropping recently, but remain above $4.50 per gallon (regular gas price was $2.40 per gallon on Biden’s inauguration day. And no, it wasn’t the Biden Administration selling nearly 1 million barrels of crude oil from the strategic petroleum reserve to the Chinese government-owned Sinopec that Biden’s son Hunter is an investor (so, The Big Guy aka Joe Biden gets a 10% piece of the action). It is a slowing global economy that is helping to lower gasoline prices.

Between soaring gasoline prices and soaring home rents, it is little wonder that there is a serious homeless problem in places like New York and California.
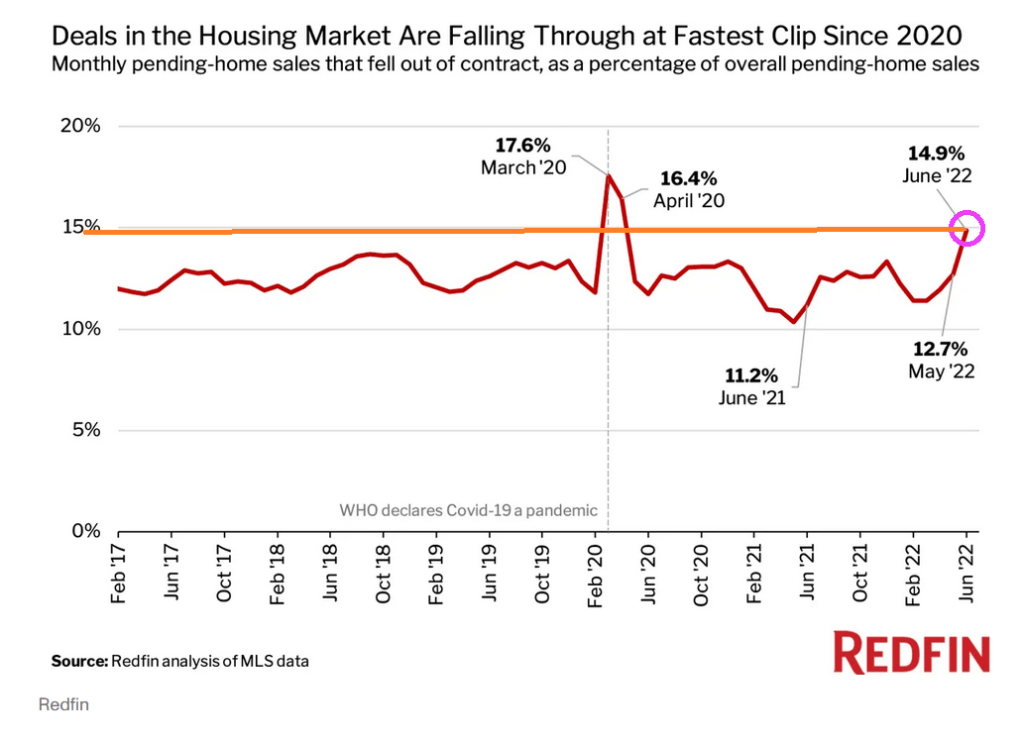
With rising mortgage rates, we are seeing a surge in pending home sales cancellations.
Atlanta Fed’s Raphael Bostic thinks that the US economy is so strong that it can easily handle a 75 basis point increase at the next FOMC meeting. Fortunately, he is not a voting member.

I wonder if Joe Biden sings “Carry On My Wayward Son” to Hunter?

The US economy is slippin’ into darkness.
The US Treasury 10Y-2Y yield curve steepened after Biden’s inauguration as President, a sign of economic optimism. Then reality began to dawn when inflation began to surge (blue line). Then The Fed stepped in to combat inflation by signaling an increase in their target rate (green line). The result? The 10Y-2Y Treasury curve is inverted at -4.85 BPS, generally an indicator of an impending recession.
But never fear! The Feral Reserve is expected to reverse its rate increases by March 2023.
So, it looks like The Fed will be returning to its “low rider” rate policies in early 2023.
In other words, hold on, The Fed is coming. Again.
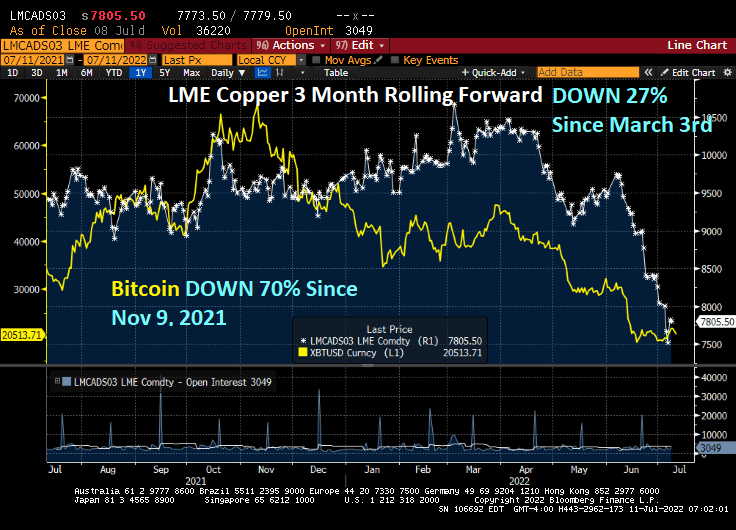
In the court of The Copper King!
Copper, one of the economic measures of a growing economy, is down -27% since March 3, 2022 as recession looks more likely.

Let’s compare copper with another famous asset, Bitcoin. Bitcoin, a cryptocurrency, is down 70% since November 9, 2021.
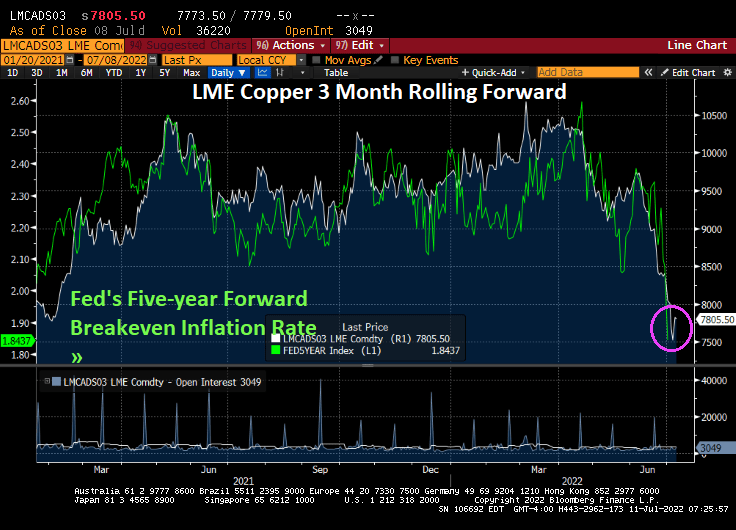
As I discussed yesterday, The Fed’s five-year forward breakeven inflation rate has plunged to its lowest levels under Biden as the global economy is slowing.

Notice that copper prices fit pretty well with The Fed’s 5-year breakeven inflation rate.
It looks like The Fed is killing-off the economy in their quest to tame inflation.
The Biden economy doesn’t hurt so good. It hurts bad!
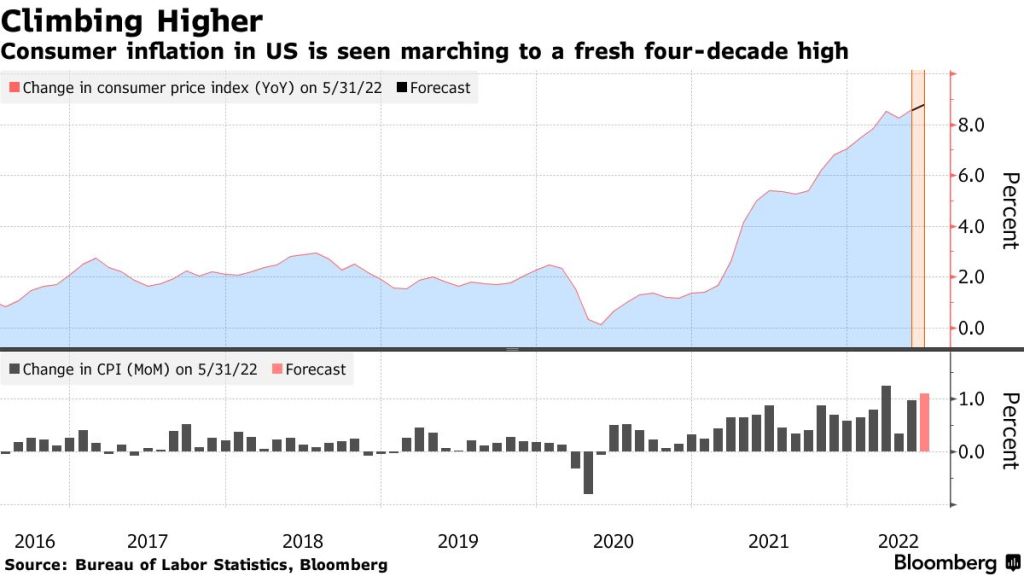
US inflation is the highest in 40 years, yet inflation may be slowing as 1) The Fed cranks up interest rates and 2) the global economy is slowing.
US inflation data in the coming week may stiffen the resolve of Federal Reserve policy makers to proceed with another big boost in interest rates later this month.
The closely watched consumer price index probably rose nearly 9% in June from a year earlier, a fresh four-decade high. Compared with May, the CPI is seen rising 1.1%, marking the third month in four with an increase of at least 1%.
While persistently high and broad-based inflation is seen persuading Fed officials to raise their benchmark rate 75 basis points for a second consecutive meeting on July 27, recession concerns are mounting. There are signs, though, that price pressures at the producer level are stabilizing as commodities costs — including energy — retreat.
But the expectations of inflation, as measured by The Fed’s 5-year forward breakeven inflation rate, just crashed to 1.8437%.

The breakeven inflation rate is a market-based measure of expected inflation. It is the difference between the yield of a nominal bond and an inflation-linked bond of the same maturity.
The USD Inflation Swap Forward 5Y5Y is also falling like a rock as The Fed hikes their target rate (green line).

Could it be that inflation is cooling with Fed rate hikes (but not the shrinking of their $8 trillion balance sheet)?

Currently, Fed Funds Futures are pointing to a Fed target rate of 3.552% by February 2023. And with that, Bankrate’s 30-year mortgage rate rose to 5.75%. Once again, like velociraptors from Jurassic Park, The Fed’s balance sheet is still out in force.

Fed Chair Jerome Powell and Atlanta Fed President Raphael Bostic are keeping The Fed’s balance sheet at near $9 trillion as they hunt assets to inflate.

The Federal Reserve’s policies remind me of the Cabaret tune “Money.” There is still almost $9 trillion in monetary stimulus outstanding.
For all the economic cheerleaders out there like CNBC about the June job report, they generally ignore what is driving the jobs report: The Federal Reserve!
Take the US U-3 unemployment rate. The Biden Administration is proud of the unemployment rate of 3.6%. But if you look at the chart of unemployment relative to The Fed’s balance sheet expansion due to Covid lockdowns, there is still almost $9 trillion of Fed stimulus outstanding.
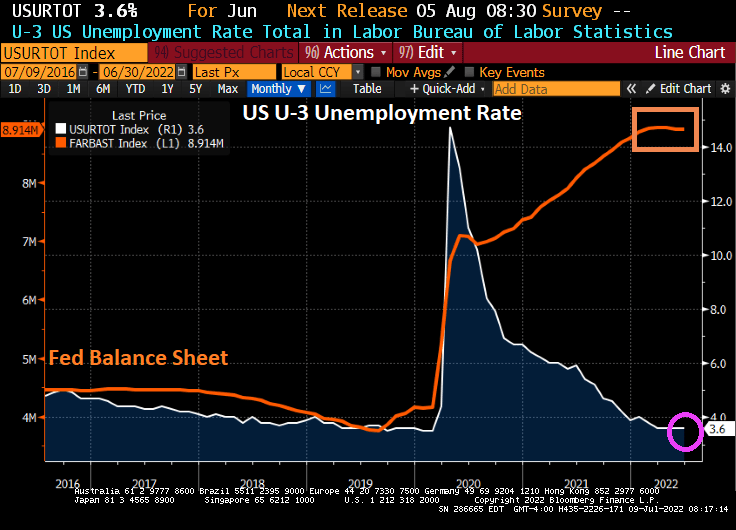
Of course, the lockdowns were pure economy killers, so opening the economies again led to the unemployment rate falling to 3.6% which is still higher than before the Covid outbreak. But The Federal Reserve has been painfully slow at shrinking its balance sheet, leaving almost $9 trillion in monetary stimulus outstanding.
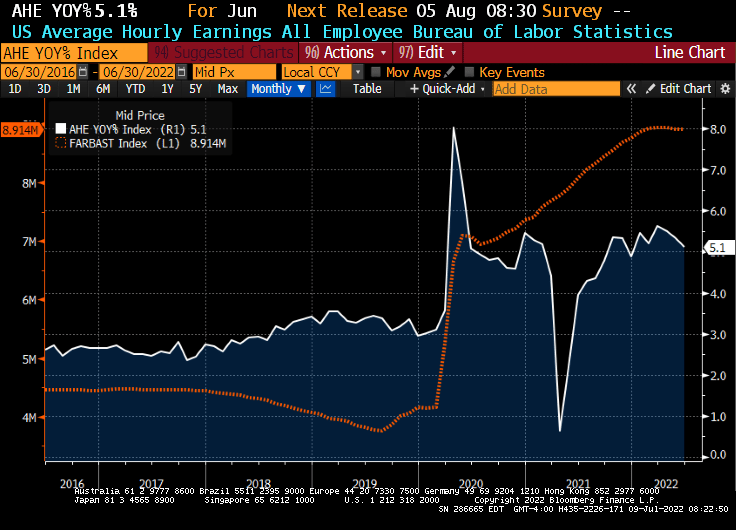
Take average hourly earnings growth. The media is all smiles as US wage growth declined to 5.1%, much higher than pre-Covid.
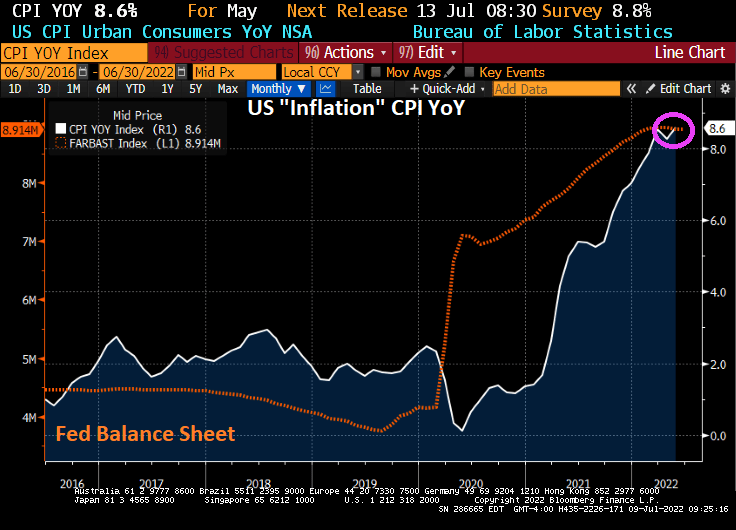
Then we have inflation, at 40-years highs thanks to massive Fed stimulus (and Federal spending).
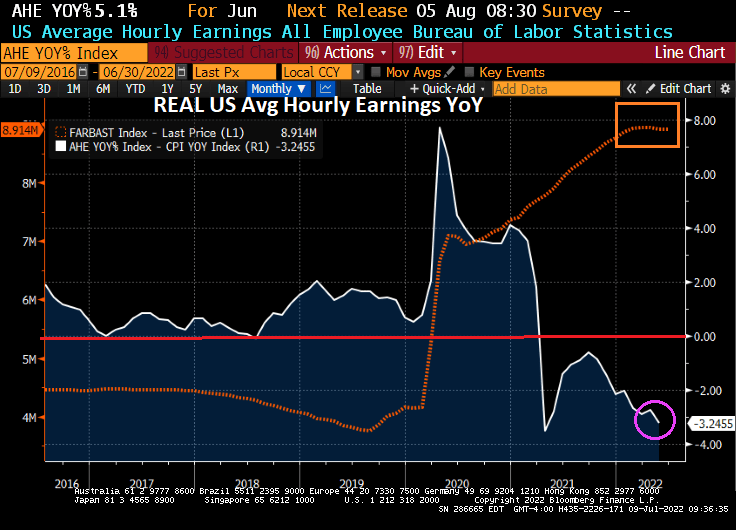
And if we deduct inflation from average hourly wage growth, we see REAL wage growth declining at a -3.25% YoY clip.
Lastly, we have the US Dollar. Nothing has been the same since the financial crisis of 2008 and the entrance of The Federal Reserve distorting the economy and prices. Not to mention the US Dollar.

The Fed leaving its monetary stimulus out in force for so long is a major policy error. So what happens when The Fed actually gets serious about withdrawing the monetary stimulus (likely after the midterm elections)?
Generally speaking, The Federal Reserve cuts rates as a recession approaches. But not this time!
The Federal Reserve is expected to raise their target rate by 75 basis points at the next FOMC meeting.
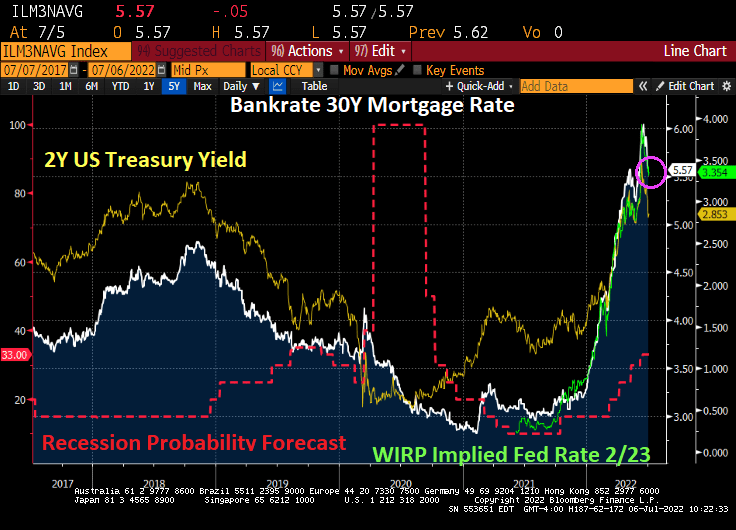
We are already seeing Fed rate hikes being priced into the mortgage markets, as Bankrate’s 30-year mortgage rate fell to 5.57% after rising above 6% in June. The reason? Recession fears have caused Treasury yields to fall.
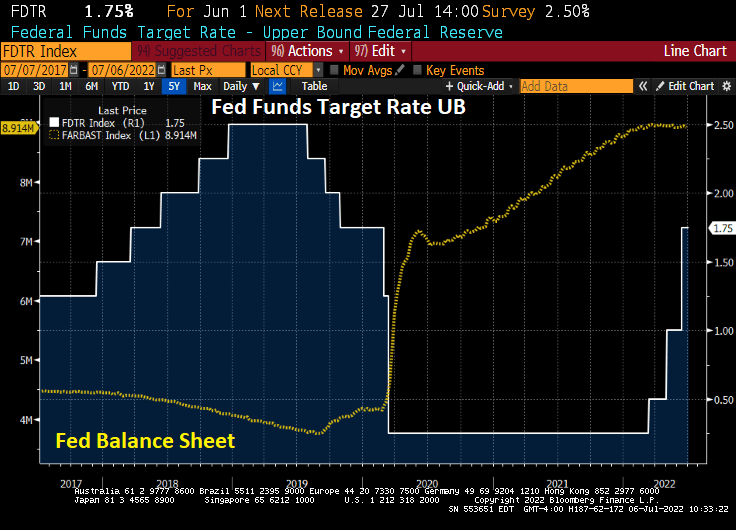
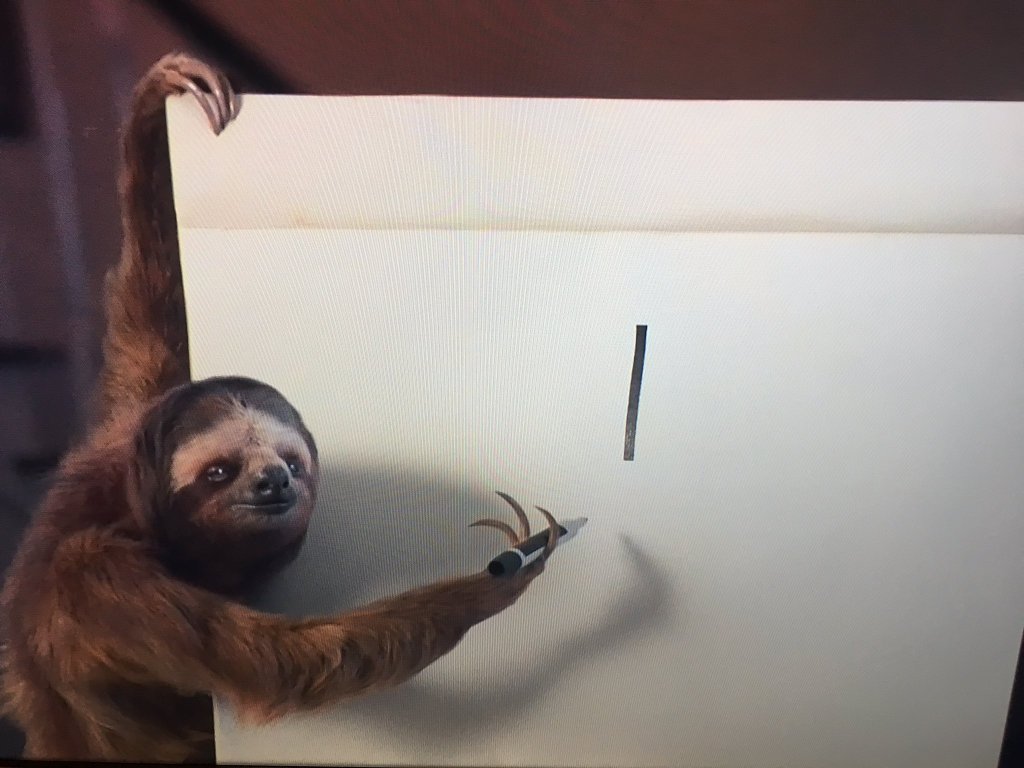
The Fed is hiking their target rate, but has been sloth-slow in unwinding their balance sheet.
Yes, The Fed has been sloth-slow in removing the Covid-related stimulus. But is The Fed trying to pull a “Volcker” by raising rate to choke off inflation EVEN IF THE ECONOMY ENTERS RECESSION? Fed Funds Futures data is pointing to a reversal of Fed rate hikes by Feb 2023.
Here is Fed Chair Jerome Powell showing the amount of Covid-related stimulus removed recently.
Inflation has been a disaster for millions of Americans. As inflation grows (highest in 40 years), fears of recession are jolting markets.
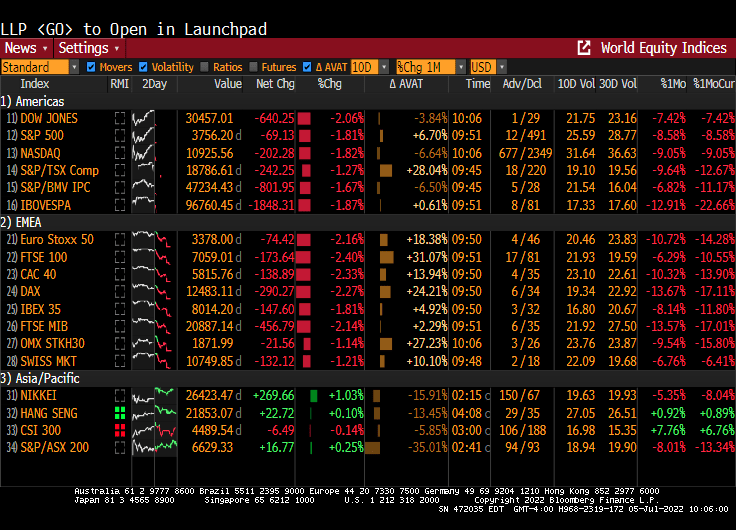
The Dow today is down 2%.

Then again, Europe is down even more.
My favorite chart for explaining the surge in inflation is M1 Money Stock around the Covid outbreak in early 2020. Which has NOT been removed.

The US Treasury 10Y-2Y yield curve just inverted.
No, this is not a real ECB currency, but it might as well be.


You must be logged in to post a comment.