Joe Biden, who has always been a compulsive liar but at least sounded cognicent, is now babbling and whispering that Bidenomics works. But for who?
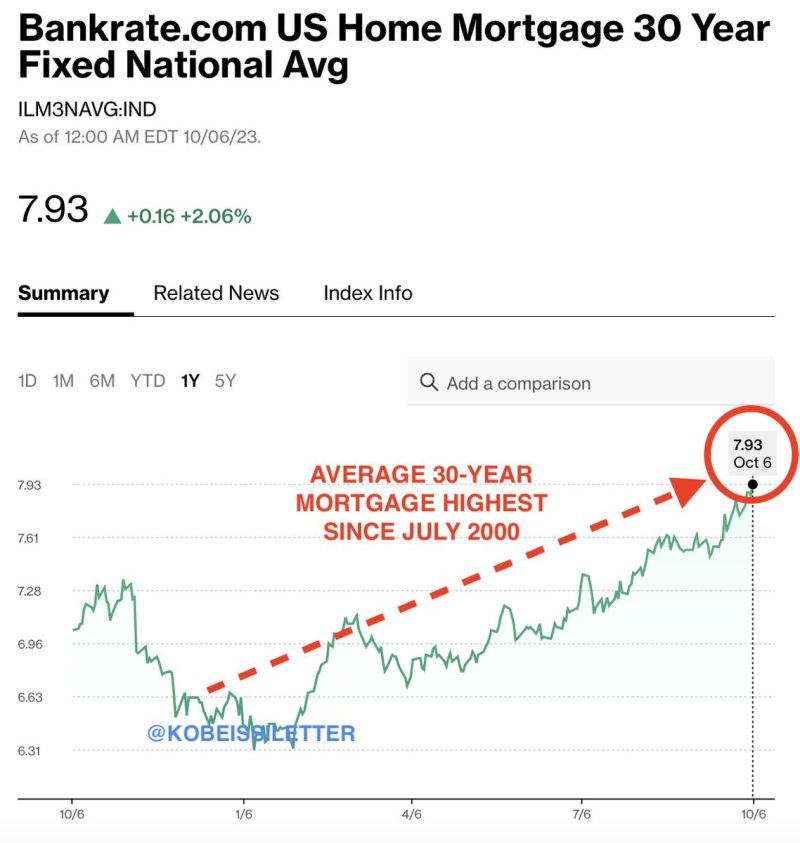
Clearly not for first time homebuyers or people looking to move. Bankrate’s 30-year mortgage rate is up to almost 8%, the highest since July 2000 and Willy Slick Clinton. That is a 176% increase in mortgage rates under the most inept “Economic Sheriff” in history.
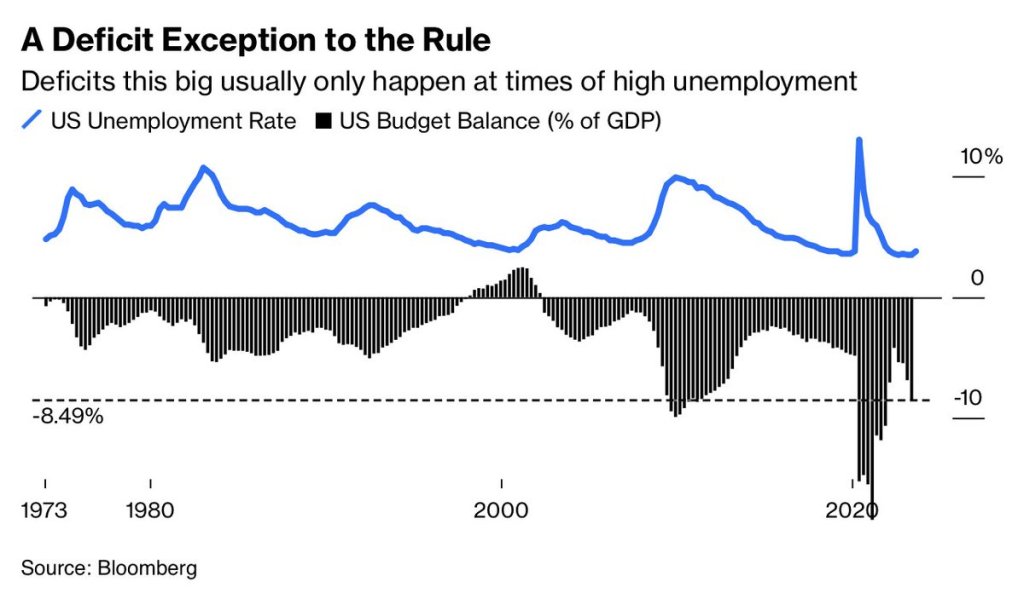
Deficits? Deficits (which Biden makes outlandish claims) are usually only this big at times of HIGH unemployment and recessions. So, are the staggering deficits under Biden a precursor to a hard landing (recession)? Don’t listen to what Biden or KJP say!!!
Biden’s outlandish claims that he single handedly reduced the deficit by the most in history is, well, typical Biden bloviating. Actually, tax receipts soared after Covid lockdowns ended. Period. Now that stimulus is wearing out, deficits are climbing again.
The Market Composite Index, a measure of mortgage loan application volume, decreased 6.0 percent on a seasonally adjusted basis from one week earlier. On an unadjusted basis, the Index decreased 6 percent compared with the previous week. The Refinance Index decreased 7 percent from the previous week and was 11 percent lower than the same week one year ago. The seasonally adjusted Purchase Index decreased 6 percent from one week earlier. The unadjusted Purchase Index decreased 6 percent compared with the previous week and was 22 percent lower than the same week one year ago.
The purchase market slowed to the lowest level of activity since 1995, as the rapid rise in rates pushed an increasing number of potential homebuyers out of the market. ARM loan applications picked up over the week and the ARM share increased to 8 percent, as some borrowers searched for ways to lower their payments.
The US 30-Year Mortgage Rate Tops 7.5% for First Time Since 2000.
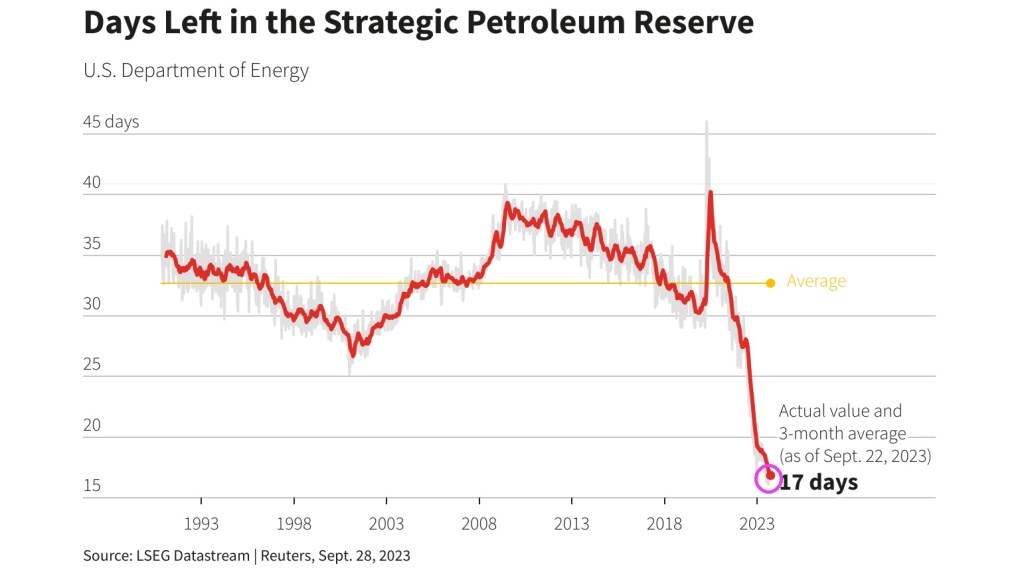
On the energy front, where we are represented by former Michigan governnor Jennifer Granholm and former South Bend Indiana mayor Pete Buttigieg, we see that the Strategic Petroleum Reserve is down to only 17 days left.
Fear the talking Fed! Various Fed Presidents are talking this week and when they do. WATCH OUT!
The latest fear mongering will be … inflation is persistent and they might have to keeep raising rates.
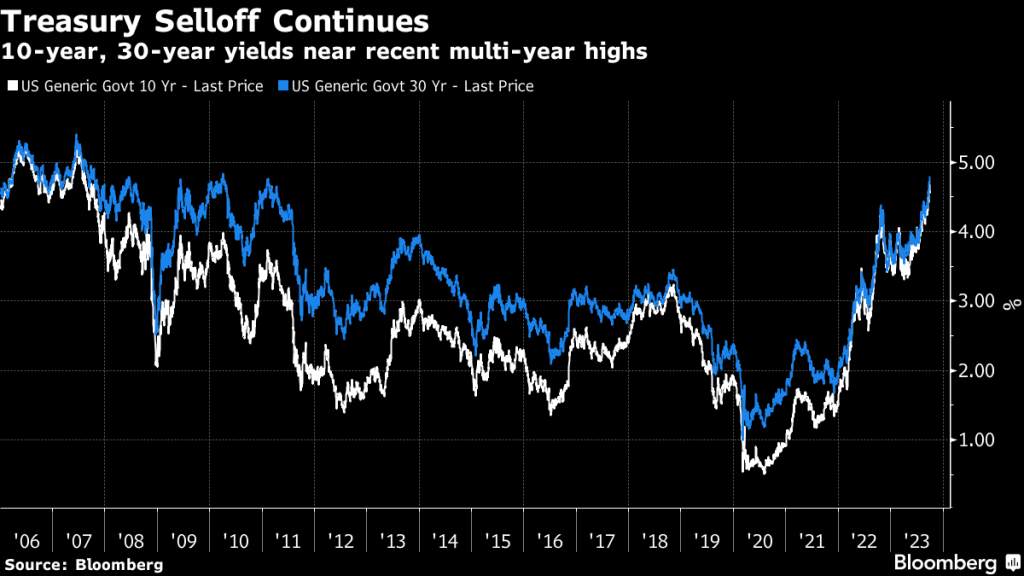
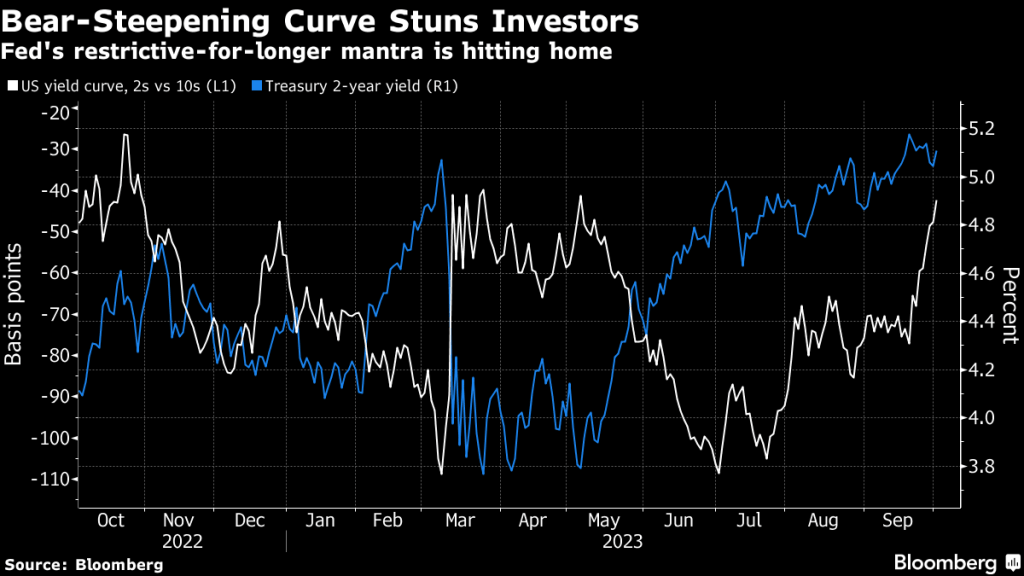
The two-year Treasury remains above 5% and the 10Y-2Y T-Curve remains inverted.
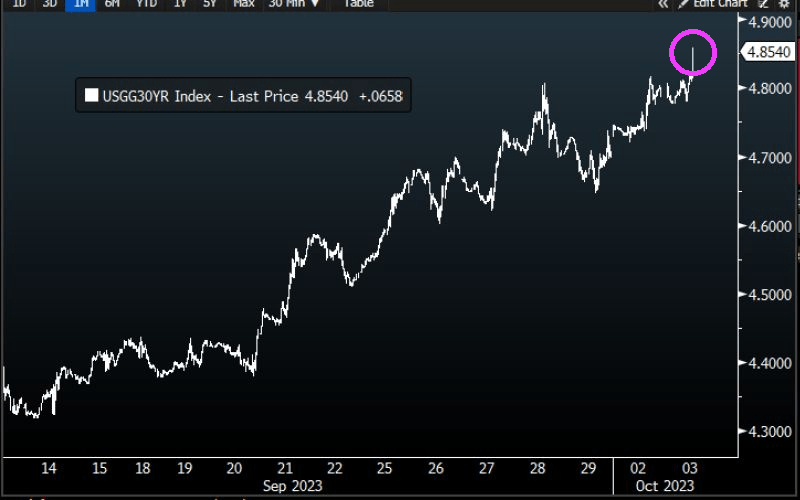
Treasury 30-year yield rose to 4.856%, HIGHEST SINCE 2007.
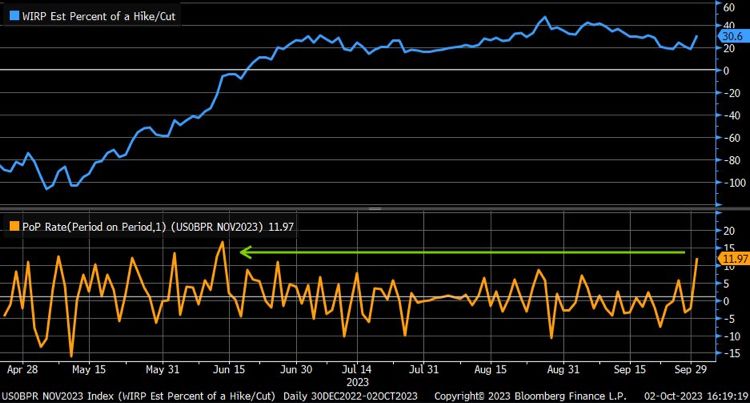
The likelhood of another Fed rate hike is growing.
While inflation is cooling (but still elevated), The Fed could choose to rate hikes again.
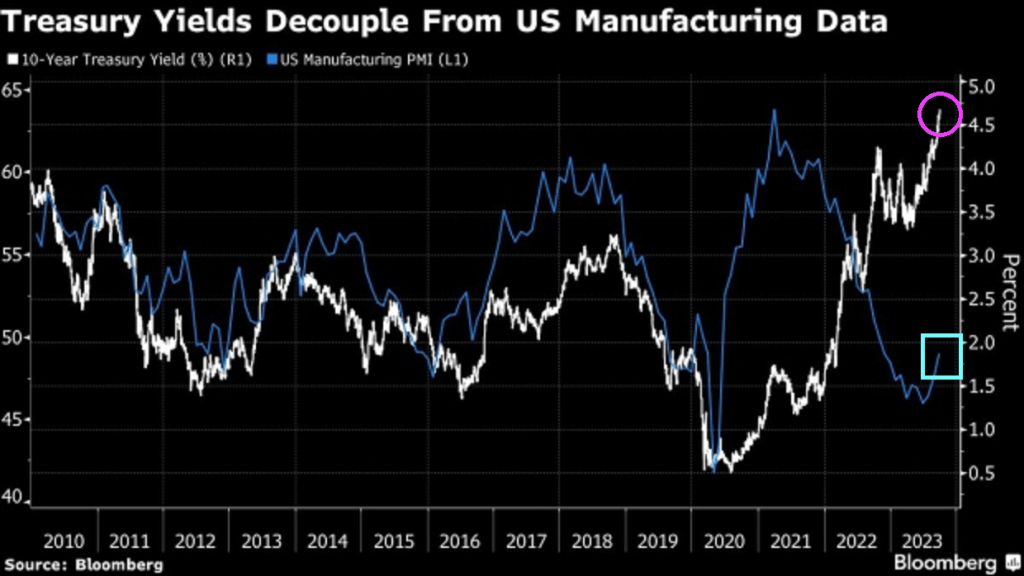
Treaury yields have decoupled from US manufacturing data.
Best picture of Lael Brainard, Director of the National Economic Council of the United States and former Federal Reserve member and talking head. Or screaming head.
The most recent report on US exisiting home sales showed that sales decreased in 17 of the last 19 months as The Fed tightens monetary policy to combat inflation caused by … 1) The Fed and 2) Bidenomics spending on green energy.
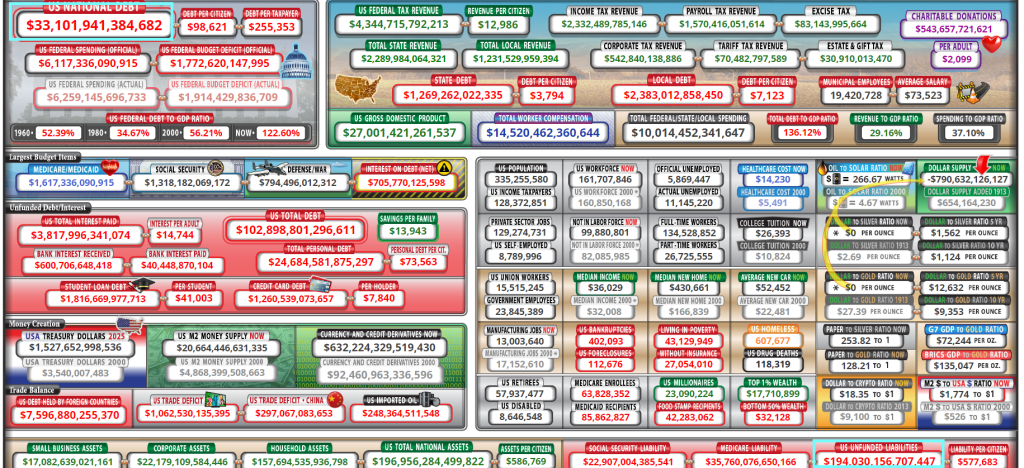
The US housing market will be “back in black” once Biden and Congress stop their reckless spending and borrowing. Biden has added $5,352,202 to the national debt since being selected (not by me!). That is a 19% increase in The Federal debt in just 33 months!
Not to mention the ludicrous $194 TRILLION in unfunded liabilities that the geezers in the Biden Administration (Biden is 80 and slipping into dementia) and the Geriatric wing of Congress (the US Senate) is home to fossils like Mitch McConnell (not looking well) and Diane Feinstein (90 and looking poorly). I didn’t forget about Nancy Pelosi (Communist-California) who is 83 and running for re-election. Younger doesn’t necessarily mean better since Pelosi’s nephew California governor Gavin Newsom is 55 years old and helped destroy California’s economy. Of course, the DNC will probably selected Newsom to replace scandal-ridden Biden as the Democrat in order to finish the job Obama started.
Existing-home sales slipped again in August as rising mortgage rates make housing prices the least affordable ever. Despite denials in many corners, a crash is underway.
Existing-home sales retreated 0.7% in August to a seasonally adjusted annual rate of 4.04 million.
Sales dropped 15.3% from one year ago.
The median existing-home sales price climbed 3.9% from one year ago to $407,100, an increase of 3.9% from August 2022 ($391,700). It’s the third consecutive month the median sales price surpassed $400,000.
The inventory of unsold existing homes dipped 0.9% from the prior month to 1.1 million at the end of August, or the equivalent of 3.3 months’ supply at the current monthly sales pace.
First-time buyers were responsible for 29% of sales in August, down from 30% in July and identical to August 2022.
All-cash sales accounted for 27% of transactions in August, up from 26% in July and 24% in August 2022.
And mortgage rates are now up to 23 year highs!
If Biden bows out and Newsom runs for President … and loses, Newsom always has a career in Hollywood in vampire movies. “I will suck your (economic) blood!” – Count Newsom.
What a mess Biden and his Progressive backers have made. And we are forced to suffer the consequeinces of his policies. Or follies!
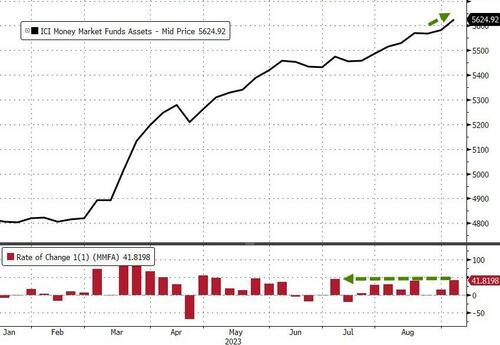
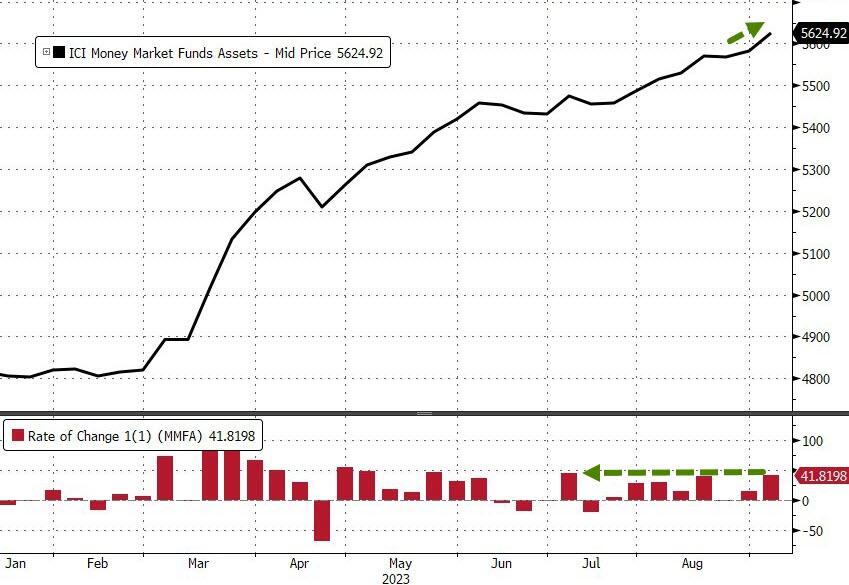
Money-market funds saw inflows for the 7th week of the last 8 with a $42BN jump (the most in 2 months) to a new record high of $5.625TN…
Source: Bloomberg
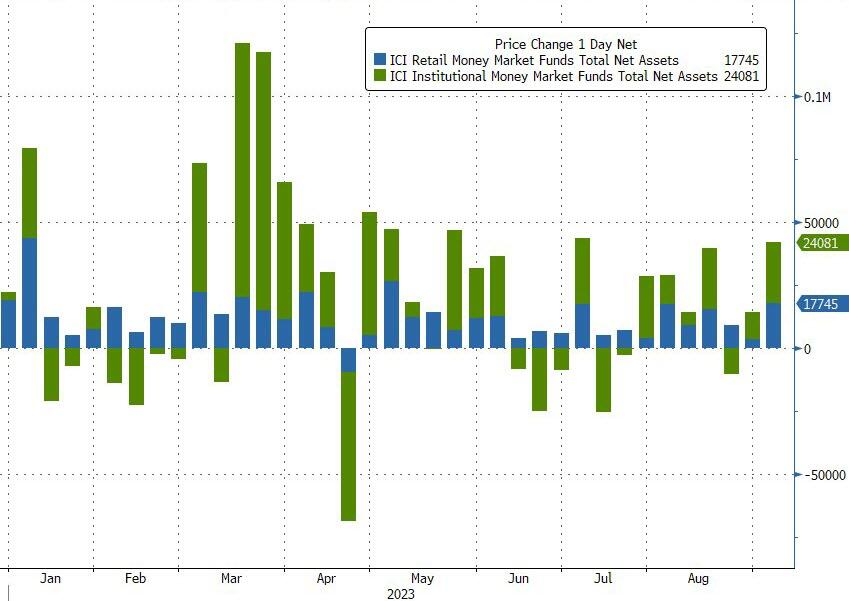
The inflow was dominated by a $24BN increase in Institutional fund assets while Retail also saw a sizable $17.7BN increase…
Source: Bloomberg
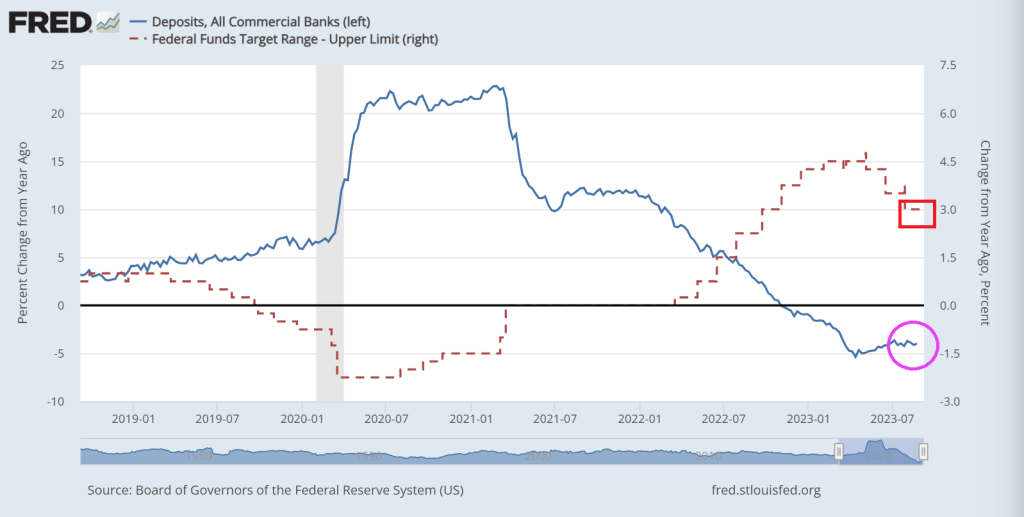
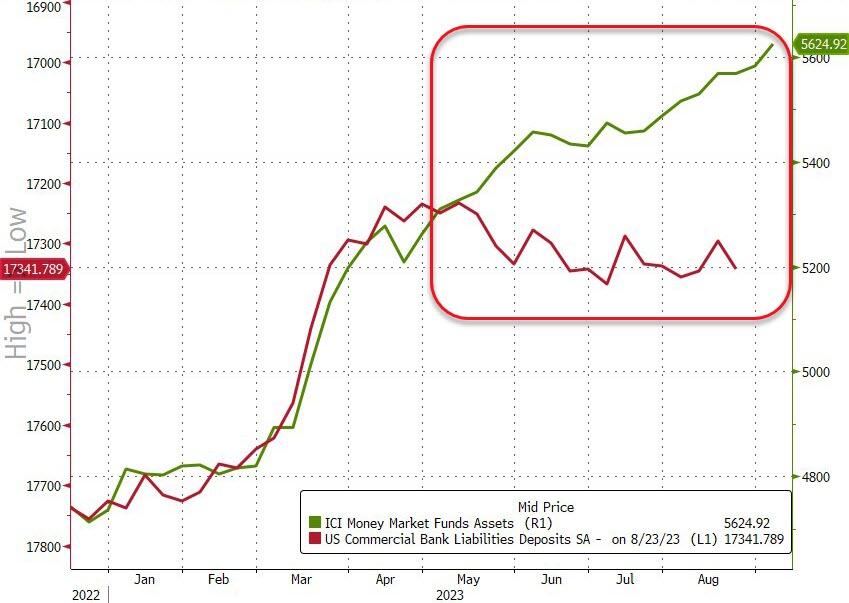
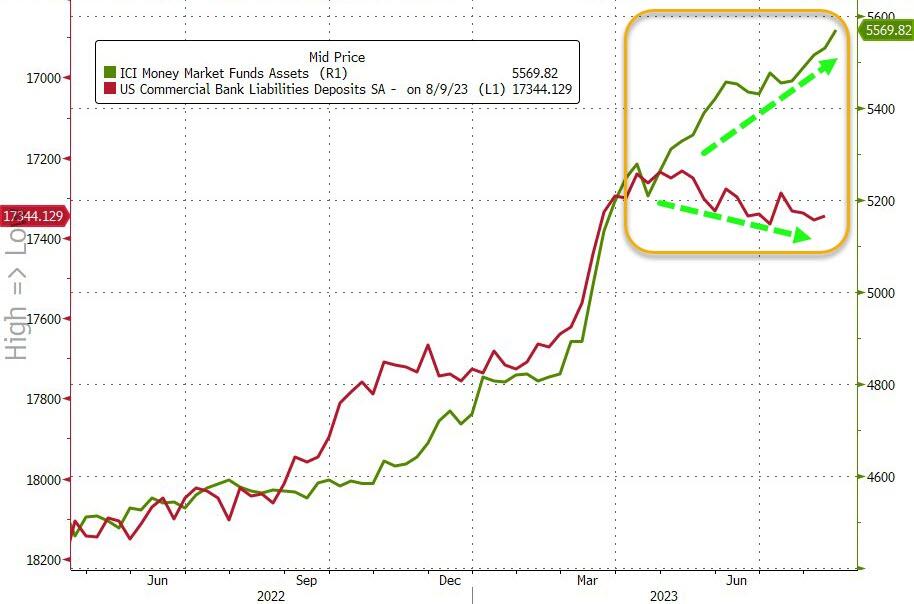
And the divergence between money-market fund assets and bank deposits continues to grow…
Source: Bloomberg
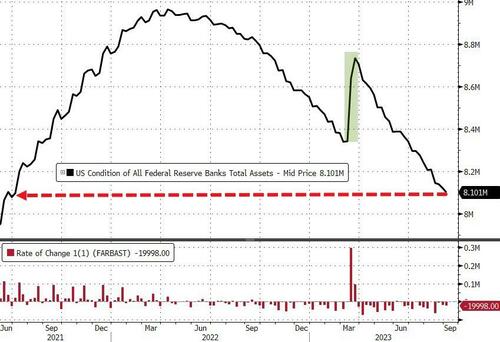
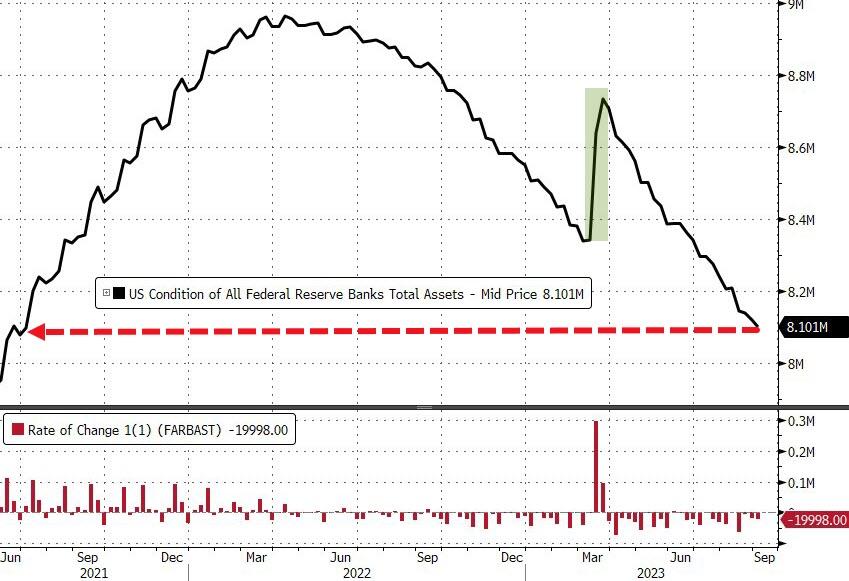
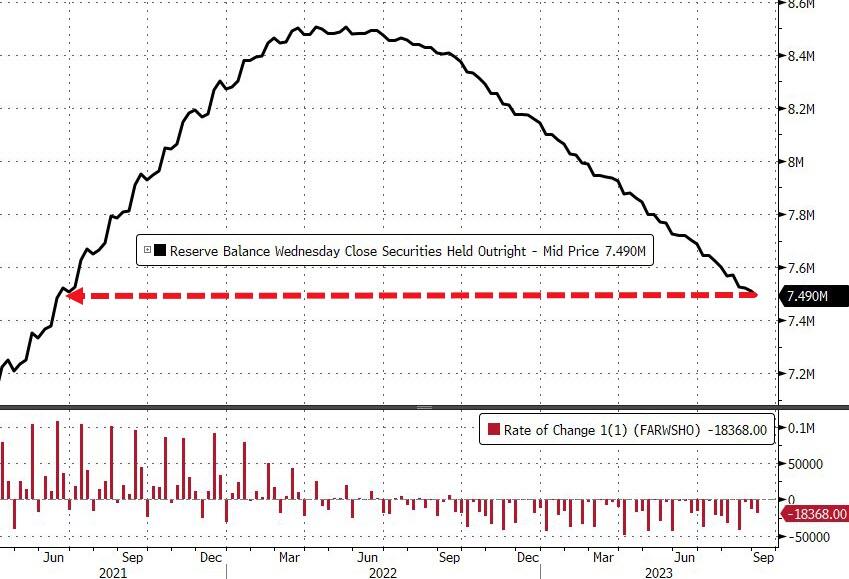
And while we actually saw huge deposit outflows (on a non-seasonally-adjusted basis) – despite The Fed’s seasonally-adjusted deposits increase – The Fed balance sheet shrank by another $20BN last week to its smallest since June 2021…
Source: Bloomberg
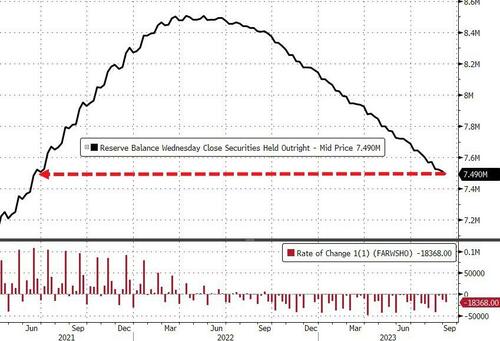
The Fed’s QT program continues apace with$18.4BN sold last week to its smallest since June 2021…
Source: Bloomberg
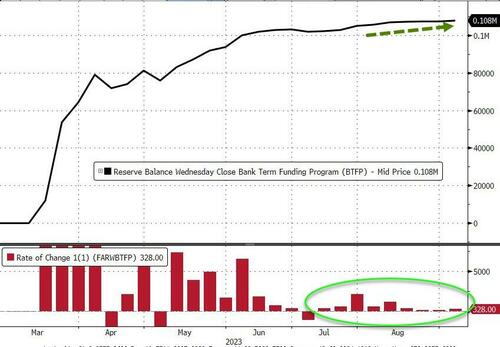
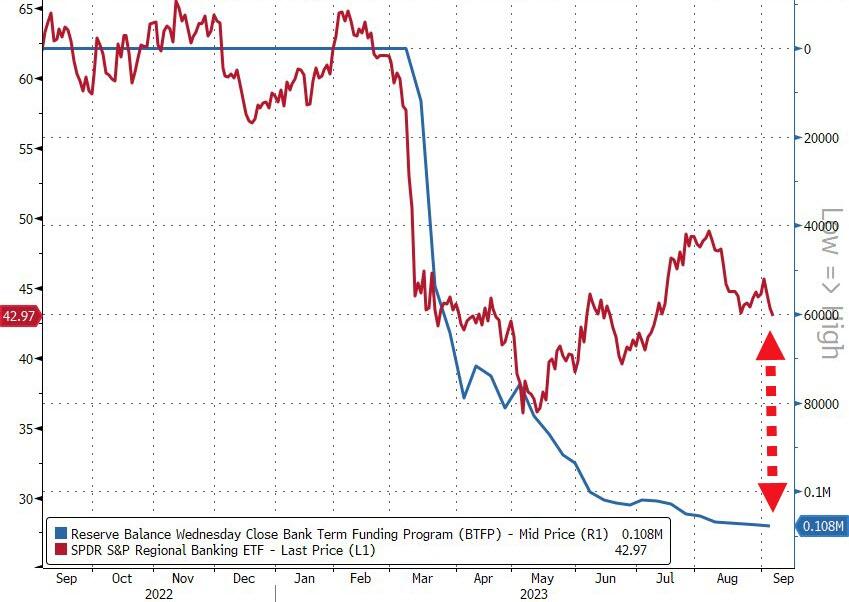
Usage of The Fed’s emergency bank funding facility jumped by $328 Million last week to a new high of $108BN…
Source: Bloomberg
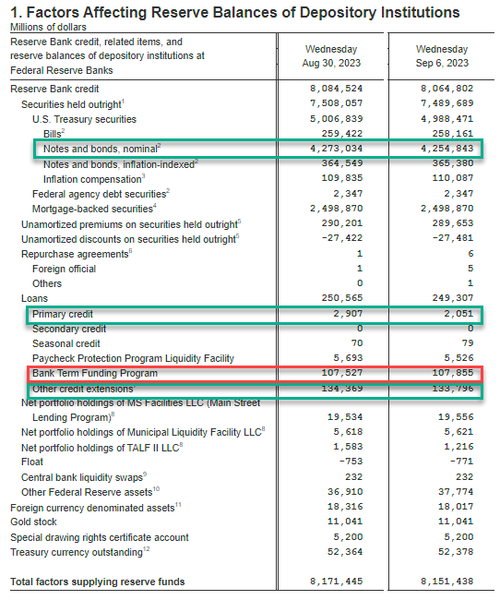
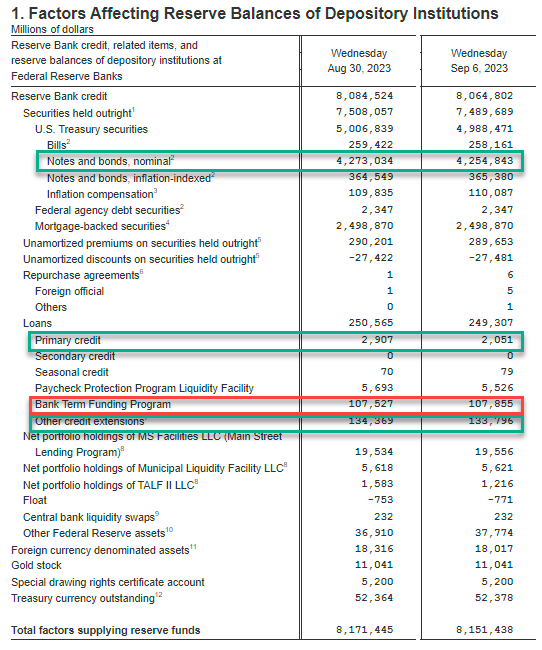
Fed BS weekly change:
Fed balance sheet QT (Notes and bonds decline): $4.255 trillion, down $18,2BN
Discount Window $2.1BN, down $800M from $.29BN
BTFP new record $107.9BN, up $400MM
Other Credit Extensions (FDIC Loans): $133.8BN, down $0.6BN from $134.4BN
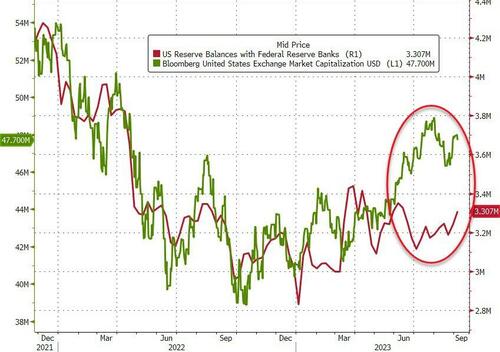
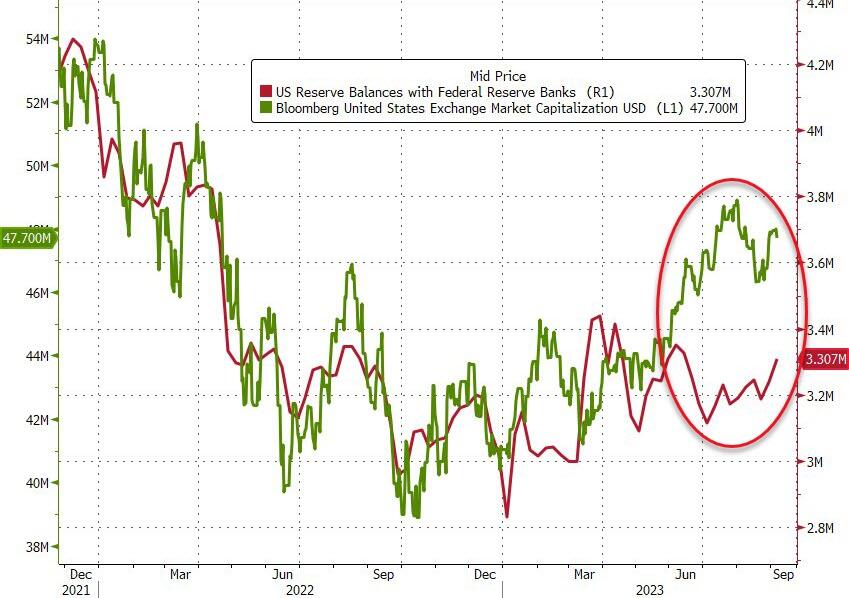
Finally, US equity markets and bank reserves at The Fed have converged a little recently, but the gap remains wide (thanks to the plunge in reverse repo balances)…
Source: Bloomberg
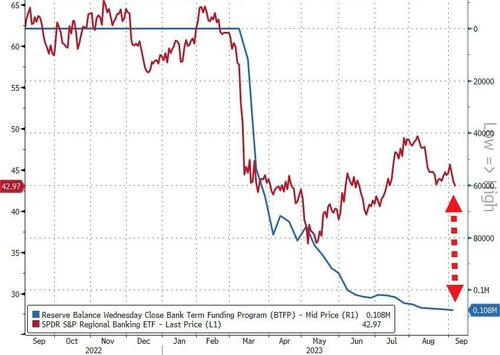
Tick, tock, banks!
Source: Bloomberg
You have six months to figure out how to clean up the $108 Billion hole in your balance sheet that you’re currently paying The Fed’s exorbitant rates to fill.
Bank deposit growth remains negative as The Fed tightens its overly accomodative monetary policy.
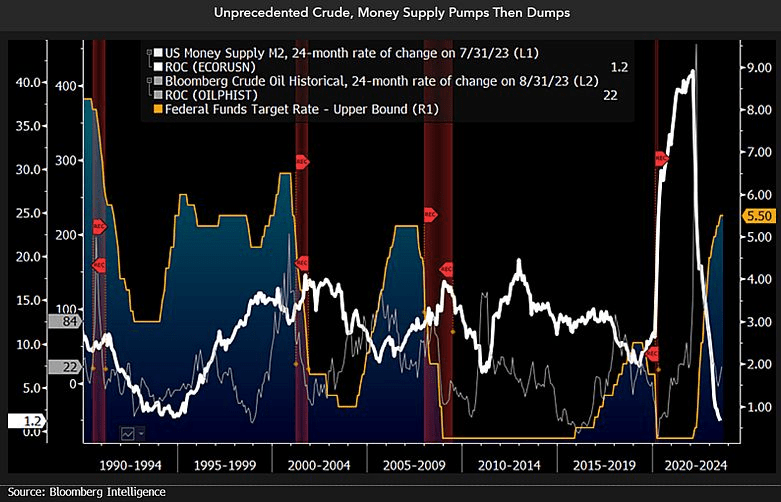
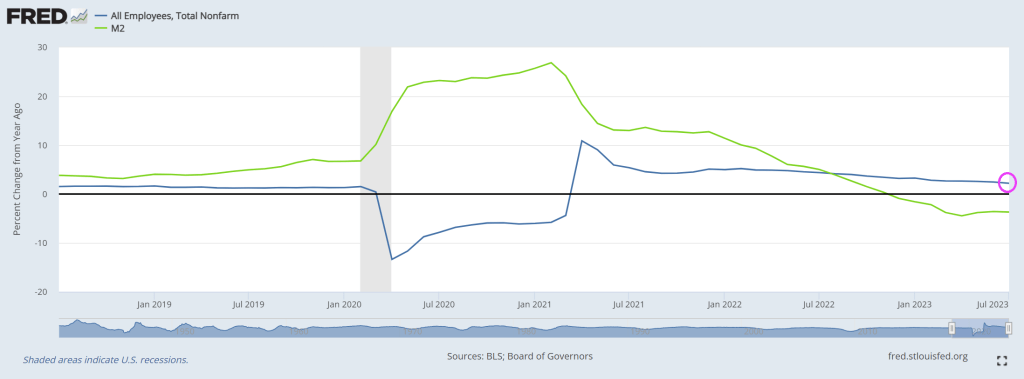
And then we have this chart showing plinging M2 Money (white line fever).
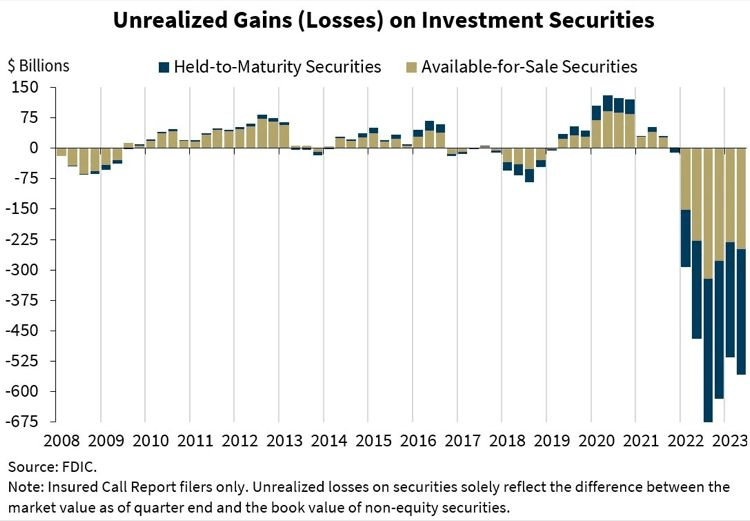
And the horrific unrealized losses on bank’s books.
Bidenomics is failing America. Primarily because Biden was one of the stupidest members of the US Senate. Not to mention nasty. Great President, America! /sarc
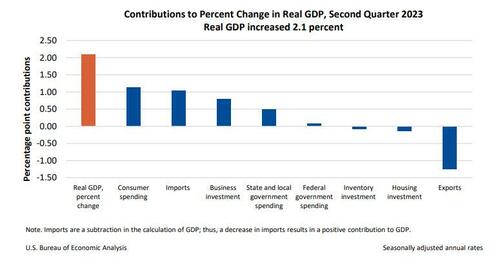
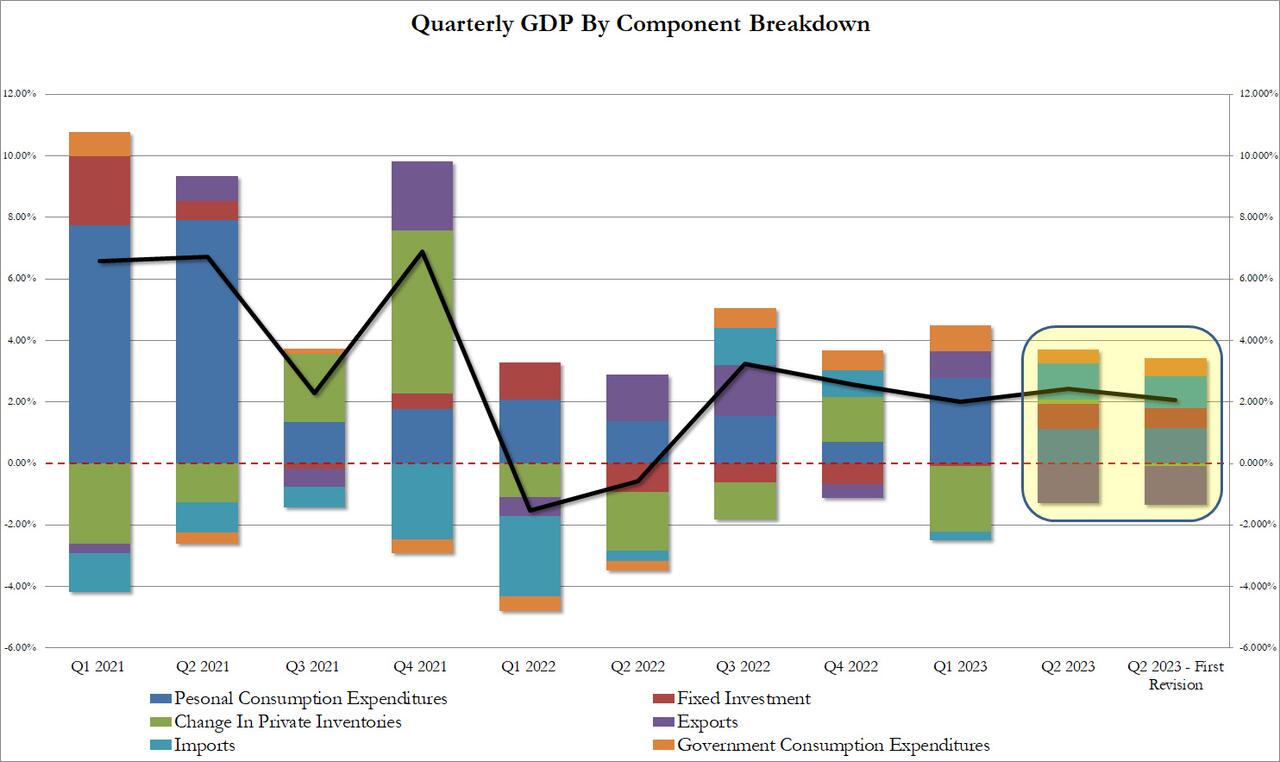
The GDP estimate released today is based on more complete source data than were available for the “advance” estimate issued last month. In the advance estimate, the increase in real GDP was 2.4 percent (refer to “Updates to GDP”). The updated estimates primarily reflecteddownward revisions to private inventory investment and nonresidential fixed investmentthat were partly offset by an upward revision to state and local government spending.
The increase in real GDP reflected increases in consumer spending, nonresidential fixed investment, state and local government spending, and federal government spending that were partly offset by decreases in exports, residential fixed investment, and private inventory investment. Imports, which are a subtraction in the calculation of GDP, decreased.
The revision according to the BEA, “reflected a smaller decrease in inventory investment and an acceleration in business investment. These movements were partly offset by a downturn in exports and decelerations in consumer spending and federal government spending. Imports turned down.” In short, everything was uglier,
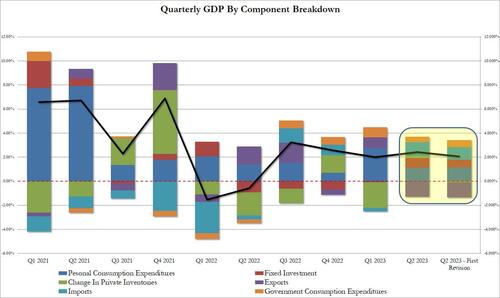
Taking a closer look at the data, we find the following changes to the bottom line:
Personal consumption added 1.14% to the bottom line print or just over half, up from 1.12% in the original print; annualized this comes out to 1.7% which was below the 1.8% estimate.
Fixed investment contributed 0.66%, down from 0.83%
Change in private inventories now subtracting 0.09% from the bottom line number, a big swing from the positive 0.14% print in the original estimate. And it will be revised even lower next month as more of the “shrink” emerges.
Net exports were also revised lower, with gross exports trimmed from -1.28% to -1.26%, while imports were revised from 1.16% to 1.04%
Finally the ever handy plug that is government consumption (which is a garbage concept since the government does not actually create anything of economic value in the economy but merely allocated graft and embezzlement of public funding), actually rose from 0.45% to 0.58% (of bottom line GDP). Without this revision, Q2 GDP would have printed below 2.0%
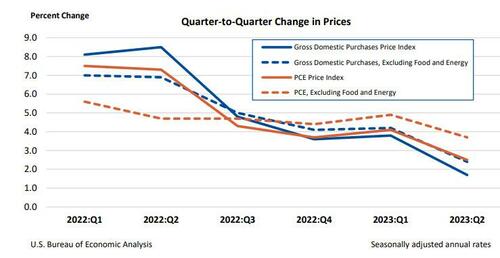
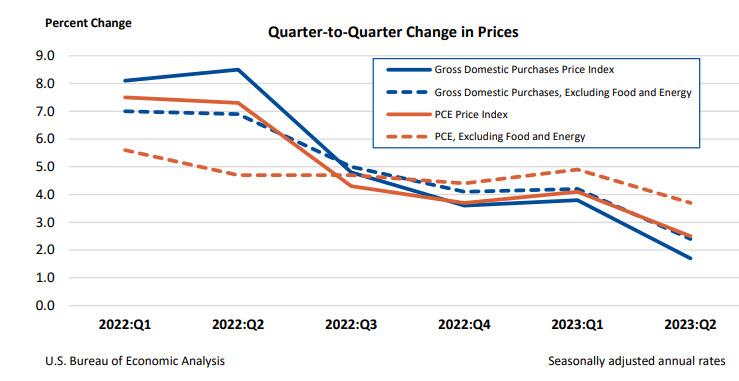
Separately, gross domestic purchases prices, the prices of goods and services purchased by U.S. residents, increased 1.7% in the second quarter after increasing 3.8 percent in the first quarter, above the 1.6% estimate last month but below the consensus 1.8%. Excluding food and energy, prices increased 2.4% after increasing 4.2%.
Personal consumption expenditure (PCE) prices increased 2.5% in the second quarter after increasing 4.1% in the first quarter. Excluding food and energy, the PCE “core” price index increased 3.7% after increasing 4.9%. This number was also revised lower from 3.8% and missed estimates of 3.8%.
Finally, the BEA reported corporate profits decreased 0.4% at a quarterly rate in the second quarter after decreasing 4.1% in the first quarter. Profits of domestic financial corporations decreased 12.1% after decreasing 2.3 percent. Profits of domestic nonfinancial corporations increased 0.9% after decreasing 5.0 percent. Profits from the rest of the world (net)increased 4.4 percent after decreasing 2.0 percent. Corporate profits decreased 6.5 percent in the second quarter from one year ago.
Needless to say, all this is a far cry from the rebound in corporate profits that companies themselves reported in their various GAAP and non-GAAP metrics, which is to be expected in a world where there is now an uncrossable chasm between economic data and its government fabrications.
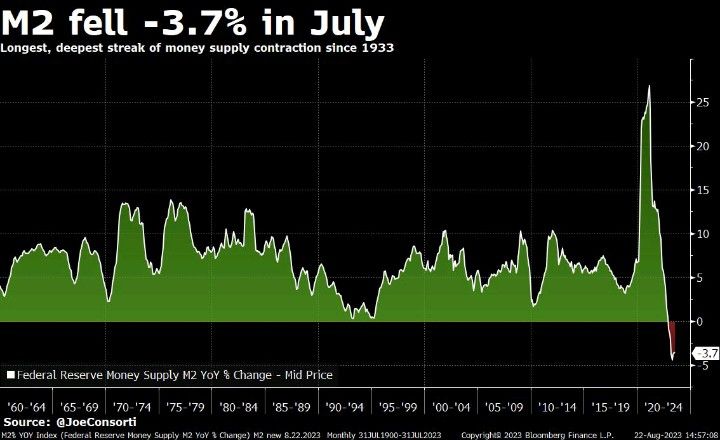
Then we have M2 Money collapsing, down -3.7% in July. Longest, deepest contraction of money suppy since 1933.
Biden, making Zelenskyy rich again!! The US bought Zelenskyy a new villa! “The document indicates that the villa was purchased by Zelenskyy’s mother-in-law in May 2023. The price of the villa is 150,000,000 Egyptian pounds or approximately $4,850,000.” Thanks Biden!!! America last!
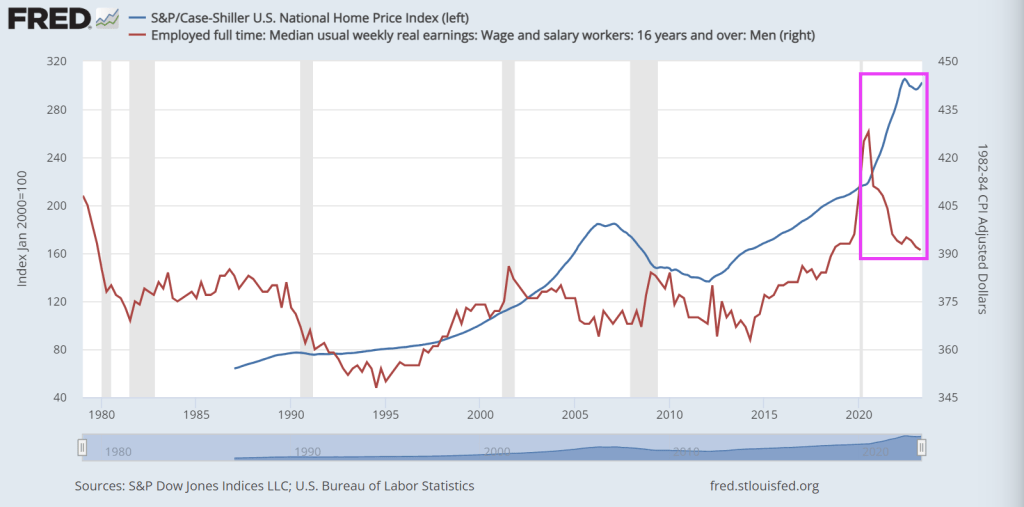
If we look at the Case-Shiller National home price index against real weekly wage growth, you can see the problem clearly. Since Covid and The Fed’s overreaction by providing staggering monetary stimulus, home prices shot up while real median weekly earnings collapsed.
Buying a house requires a much bigger slice of people’s income now — making this the most unaffordable housing market since 1984, by one measure.
And that crushing lack of affordability isn’t expected to improve much in the near future.
At today’s rates, buying a median-priced home would require a monthly principal and interest payment of $2,440 for those making a 20% down payment, according to Black Knight, a mortgage technology and data provider.
That’s $1,172 a month more in mortgage payments from just two years ago, before the Federal Reserve raised its benchmark lending rate 11 times in 18 months, Black Knight found. It’s a 92% increase — and is taking a growing chunk out of household budgets already facing inflation on many fronts.
Currently, 38.6% of the median household income is required to make the monthly payment on the average home purchase, making housing the least affordable it’s been since 1984, according to Black Knight.
“To put today’s affordability levels in perspective, it would take some combination of up to a 28% decline in home prices, a more than 4% reduction in 30-year mortgage rates, or up to a 60% growth in median household incomes to bring home affordability back to its 25-year average,” said Andy Walden, vice president of enterprise research and strategy at Black Knight.
Must as well face it, we’re addicted to gov. Or at least Fed monetary stimulus.
Just look at Personal Interest payments under Bidenomics.
Preliminary benchmark revision smaller than some had projected
Biggest payrolls adjustment in transportation and warehousing
Are you surprised that the Biden Administration has been lying about job creation?? Not really since Biden compulsively lies about everything. Including his corruption.
US job growth was probably less robust in the year through March than previously reported, according to government data released Wednesday.
The number of workers on payrolls will likely be revised down by 306,000 for March of this year, according to the Bureau of Labor Statistics’ preliminary benchmark revision.
Even without the revision, job growth has slowed to 2.2% YoY in July as M2 Money growth slowed to -3.7% YoY.
Let see what our Overlords say at the Jackson Hole Fed symposium.
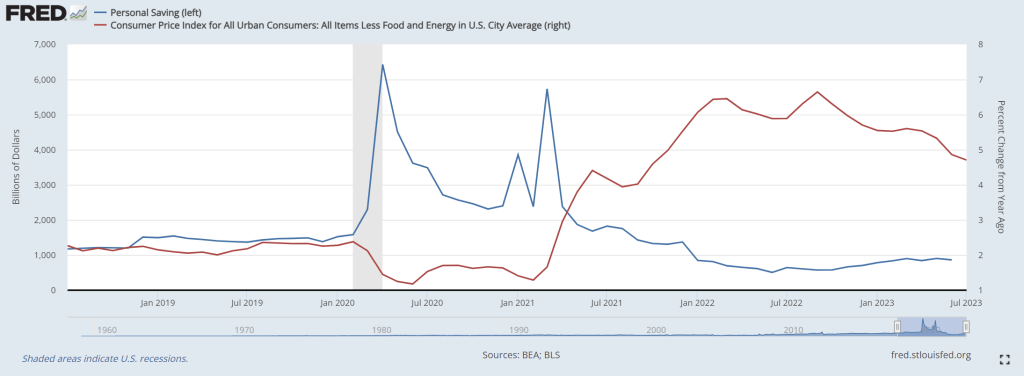
US personal savings are being exhausted as The Fed raises rates to fight inflation. I call this phenomenon “low riding” where consumers are being punished by The Federal Reserve and Biden Administration.
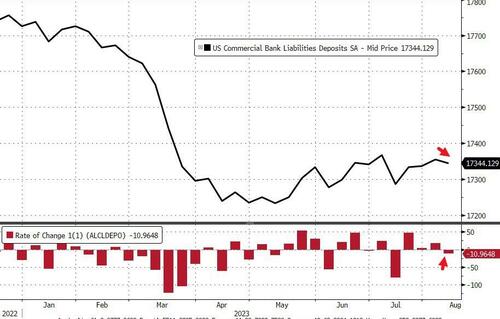
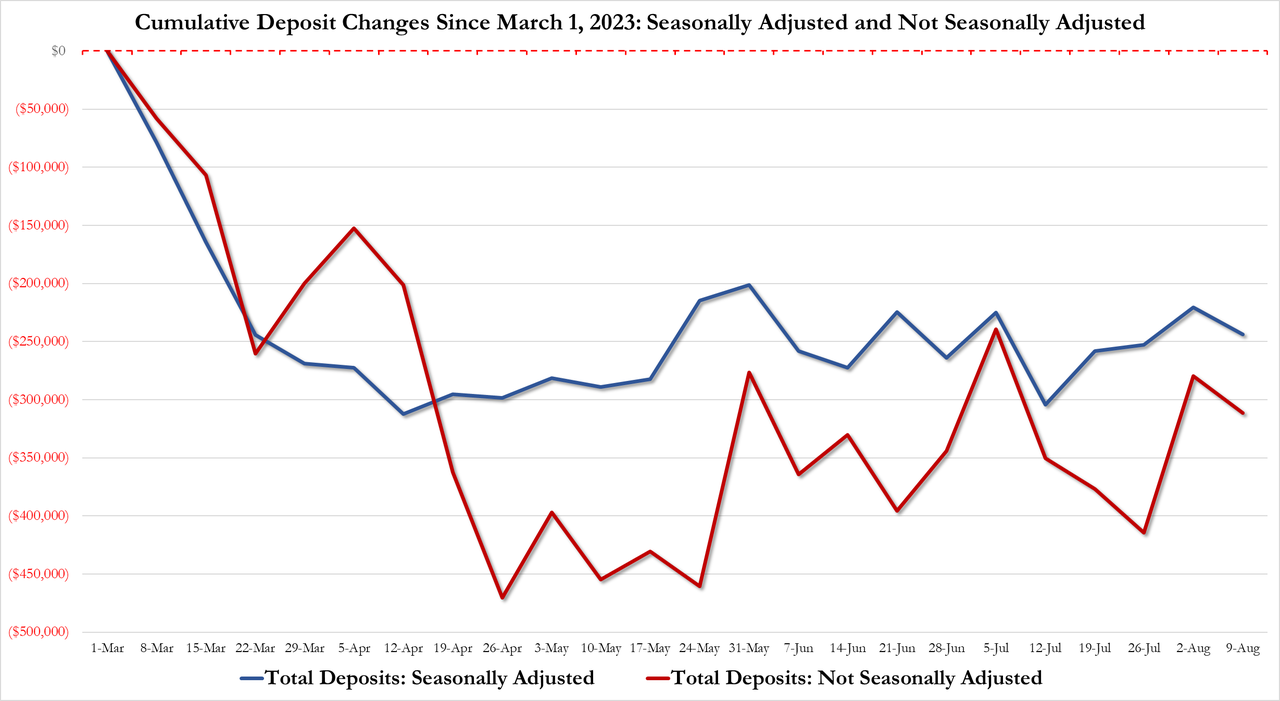
On a seasonally-adjusted basis, The Fed says that total deposits dropped $11BN last week (the first decline in 4 weeks). We also note that the prior week’s inflow was revised higher…
Source: Bloomberg
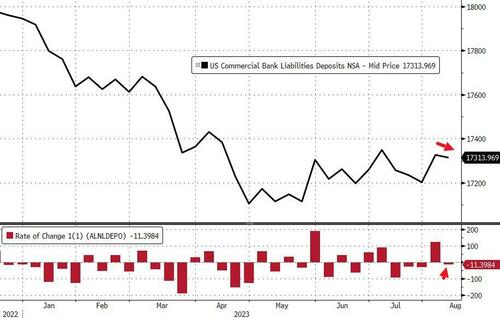
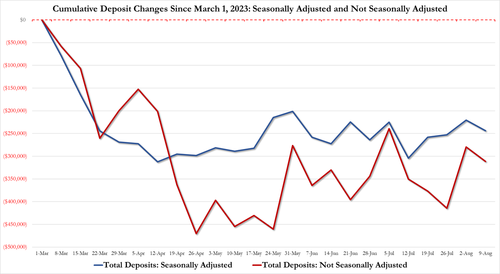
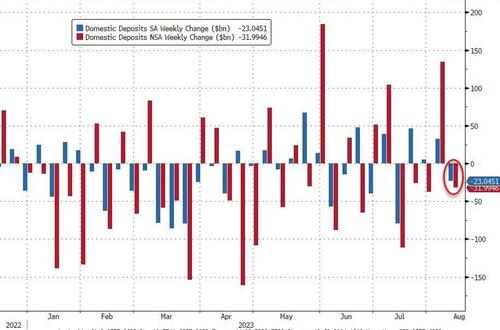
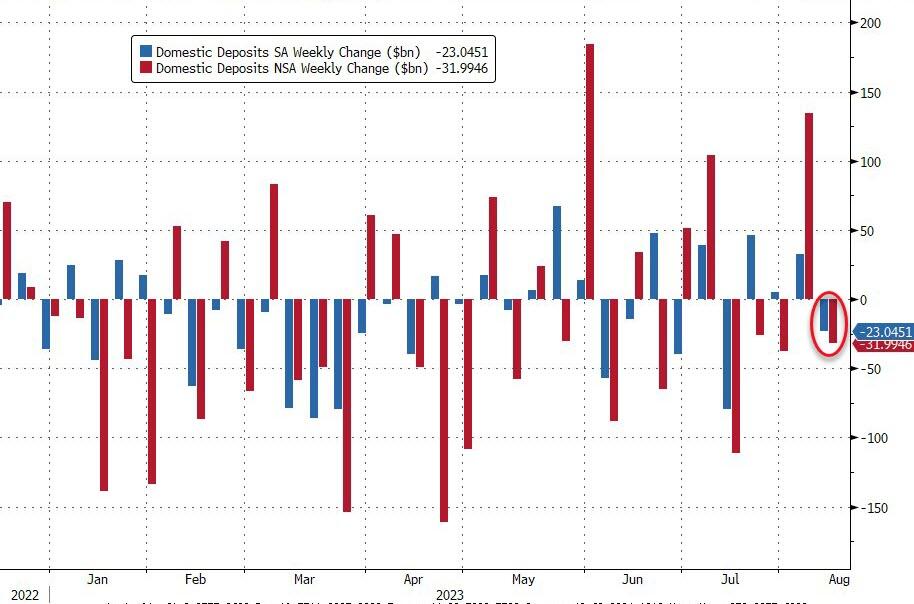
After last week’s enormous $121BN NSA deposits inflow, last week saw an $11BN outflow (on a non-seasonally-adjusted basis)…
Source: Bloomberg
The gap between SA deposits and NSA deposits remains more manageable (until the next time The Fed decides to fiddle)…
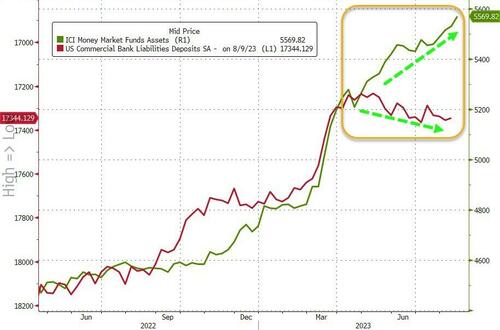
The divergence between money-market fund assets and bank deposits remains extreme…
Source: Bloomberg
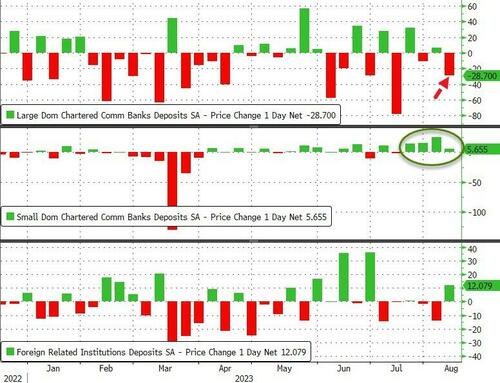
On a seasonally-adjusted basis, Small Banks saw $5.6BN deposit inflows last week while Large Banks suffered $28.7BN outflows (with foreign bank inflows of $12BN making up the difference)…
Source: Bloomberg
And so, for a nice change, everything is tidy with domestic US banks seeing deposit outflows on an SA and NSA basis…
Source: Bloomberg
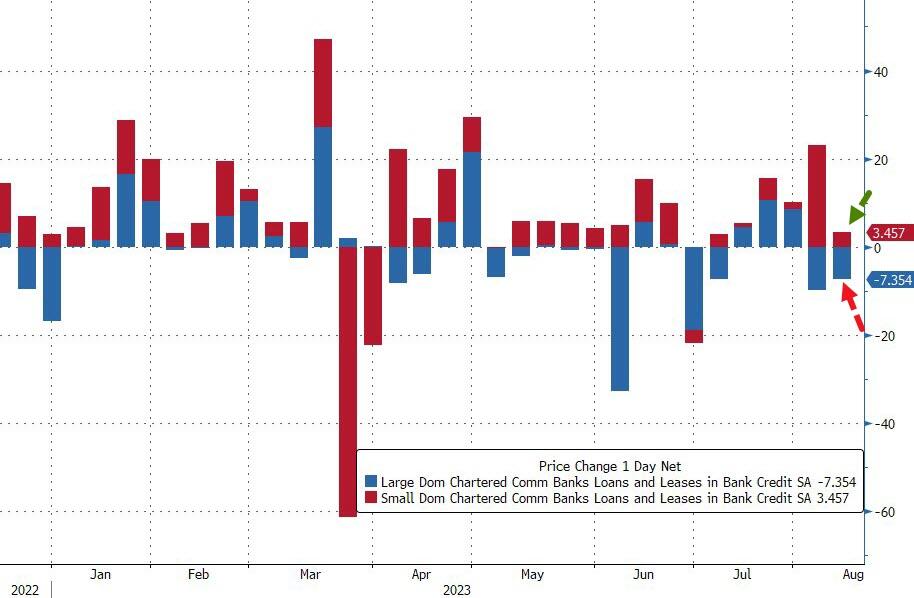
On the other side of the ledger, small banks continued to pump out loans (+$3.56BN, sixth straight week of increases), while large banks saw a $7.4BN contraction in loan volumes…
Source: Bloomberg
So, if The Fed’s data is to be believed, Small banks are ‘winning’ – deposit inflows and making loans; while large banks are leaking – deposit outflows and shrinking loans. All while Treasury prices tumble, stressing small bank balance sheets.
Just remember, the sitting US President Joe Biden goes under several psuedonyms like Robert Peters, Robin Ware, and JRB Ware in his email conversations about Ukraine with his son Hunter. But don’t forget another pseudonym: The Reverend Kane from Poltergeist 2!


You must be logged in to post a comment.