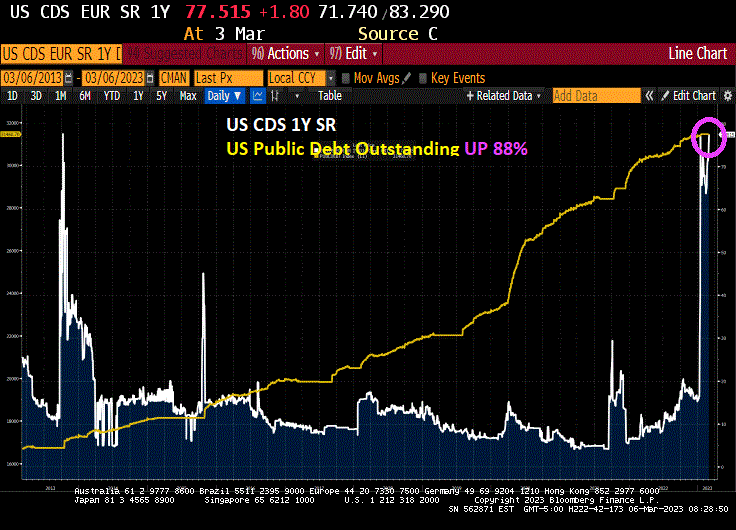
The last US debt crisis occured in 2013 when Congress finally raised the debt ceiling … and kept on borrowing and spending, But if you thought that a debt crisis would scare Congress (and the Administration) into balancing the Federal budget, you would be wrong. In fact, since the 2013 debt crisis, Federal debt is up 88% (+$14.7 TRILLION over the last 10 years).
And with the massive growth in Federal debt under Obama, Trump and Biden has resulted in an explosion in interest payments on the Federal debt.
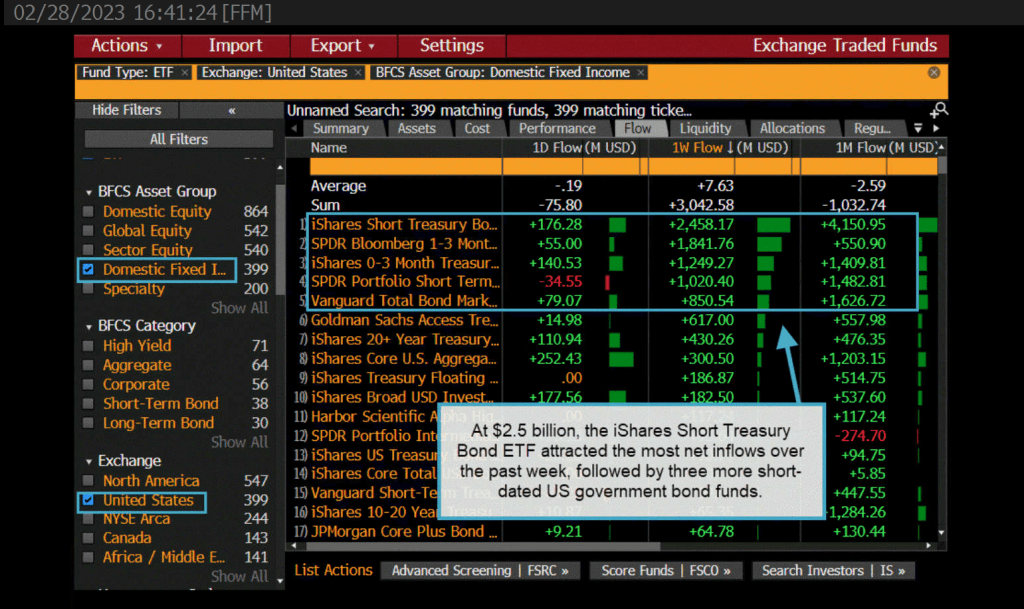
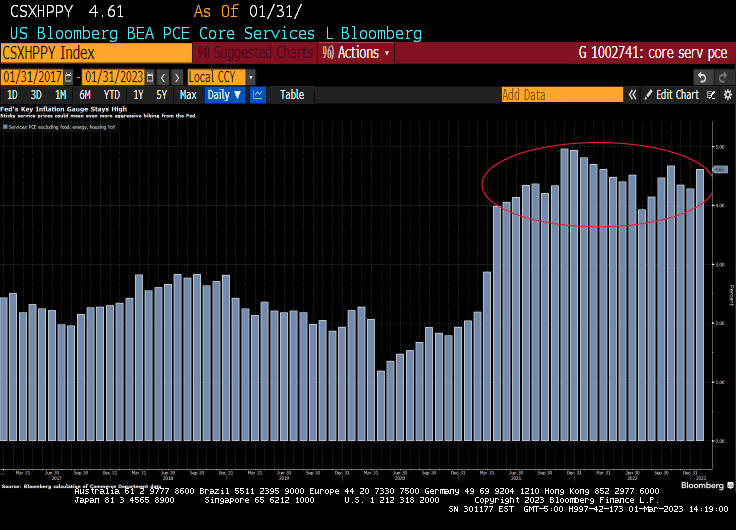
As The Federal Reserve reaffirms their draining of the monetary punch bowl, we are seeing investors flock towards the bond market. Particularly the iShares Short Treasury ETF. $2.5 BILLION to be exact.
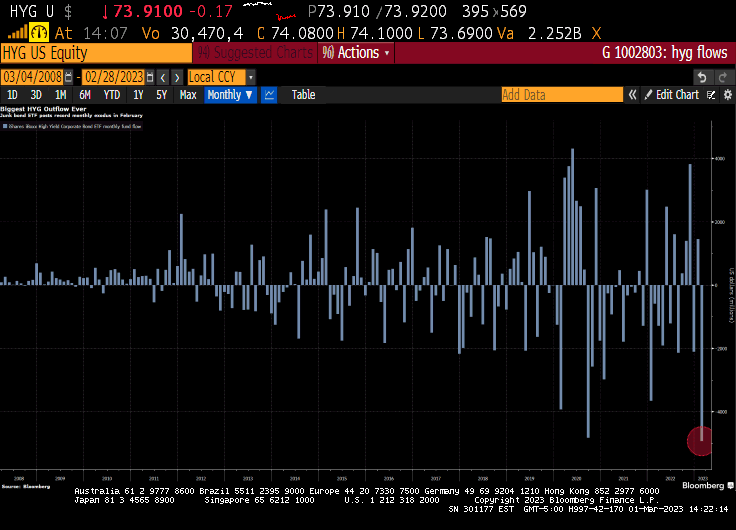
Meanwhile, credit ETFs are hammered by record outflows of almost $12 Billion.
The reason why? Inflation remains elevated which is leading The Fed to keep their foot on the monetary brake pedal.
Here is where we set today. The cost of insuring for a US debt default remains elevated as the US has hit its statutory debt limit. This is happening at the effective rate of interest on US mortgage debt is rising.
Help us McCarthy! Because Biden and Schumer don’t want to cut ANY spending.
The Federal Reserve’s Open Market Committee (FOMC) is meeting on Wednesday. What will they do?
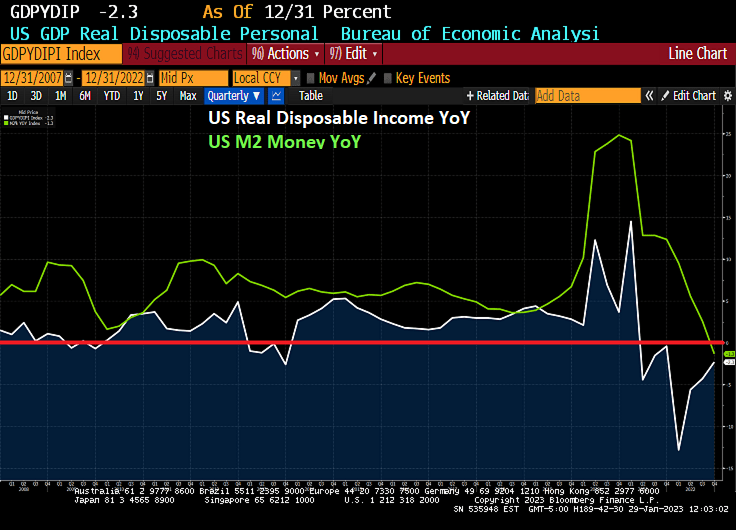
First, The Fed Funds Target (upper bound) is above the Core US inflation rate YoY. Second, M2 Money growth YoY has slowed to -1.3%.
Of course, the members of the FOMC might decide that this is not enough and may keep raising rates and shrinking The Fed’s enormous balance sheet.
In the “Haven’t they suffered enough?” arena, US real disposable income has fallen by -21% since Biden was sworn-in as President.
On the other hand, the Taylor Rule is still pointing to a target rate of 10% (we aren’t even half way there at 4.50%).
Oh and the price of insuring against a US debt default remains elevated (since Biden and Schumer are baving like arrogant bullies) and are refusing to negotitate over spending cuts.
The 1Y CDS volatility cube indicates that it will all be over soon.
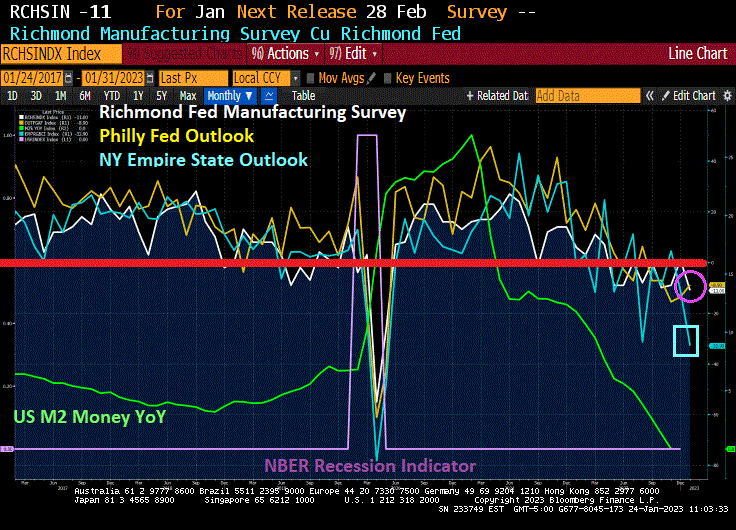
Three regional Fed reports I like to watch are New York’s Empire State Outlook, Philly Fed’s Outlook and Richmond Fed’s outlook. Today, The Richmond Fed released their manufacturing outlook and … it declined to -11.
So the big three are all down (Philly down to -8.9 while NY’s Empire State outlook is down to -32.9.
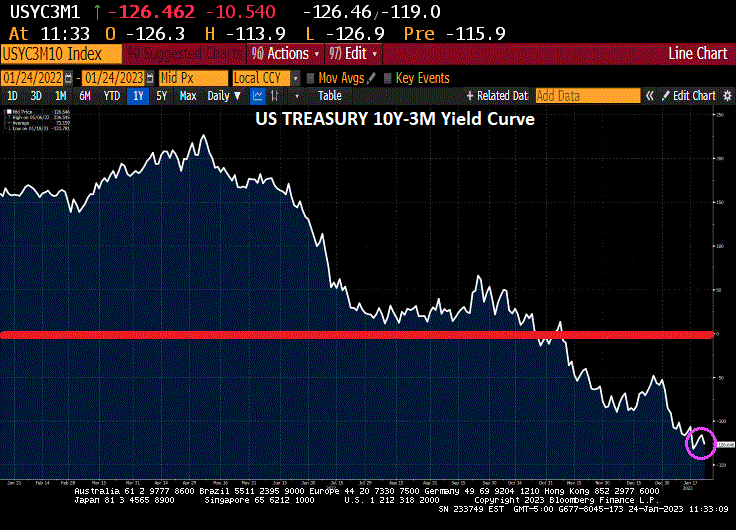
On the Treasury front, the US 10Y-3M yield curve inverted further (a signal of impending recession) just tanked to -126.462 basis points.
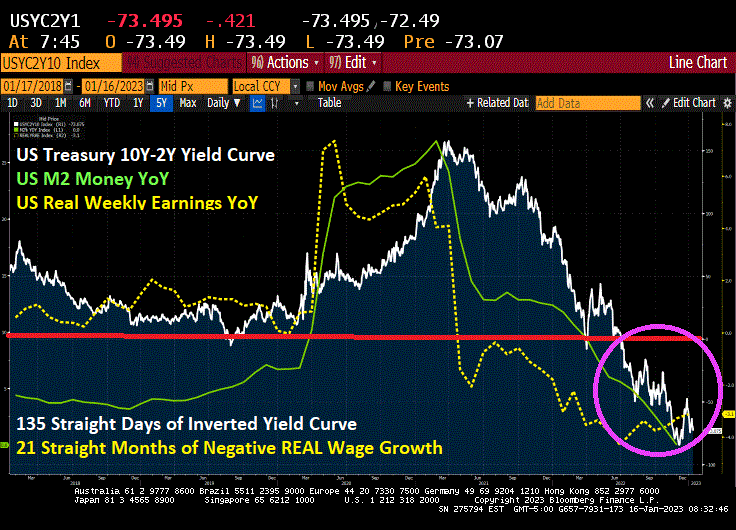
We got trouble in Potomac City! No, I’m not talking about the numerous Top Secret documents that Biden carelessly left in his garage in Delaware and the UPenn Biden Center. And they found more over the weekend. I’m talking about the US Treasury 10Y-2Y yield curve being inverted for 135 straight days. And thanks to inflation, REAL wage growth has been negative for 21 straight months.
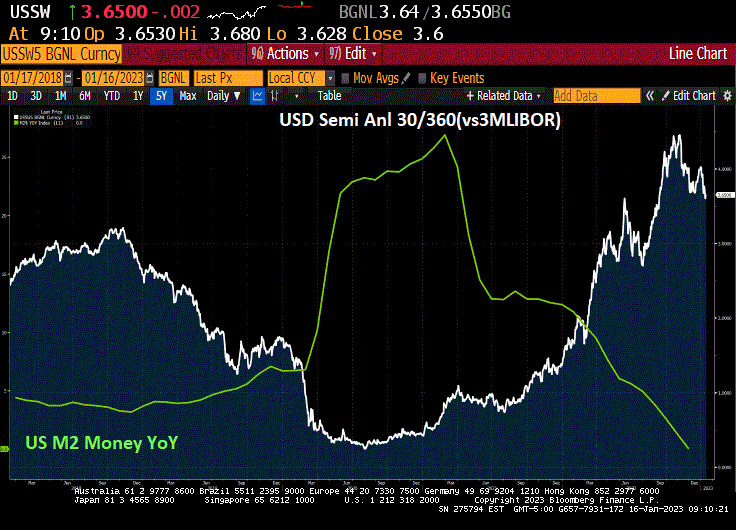
All this is happening while M2 Money growth (green line) stalls to 0% YoY.
Swaps 5Y are rising as The Fed withdraws monetary stimulus.
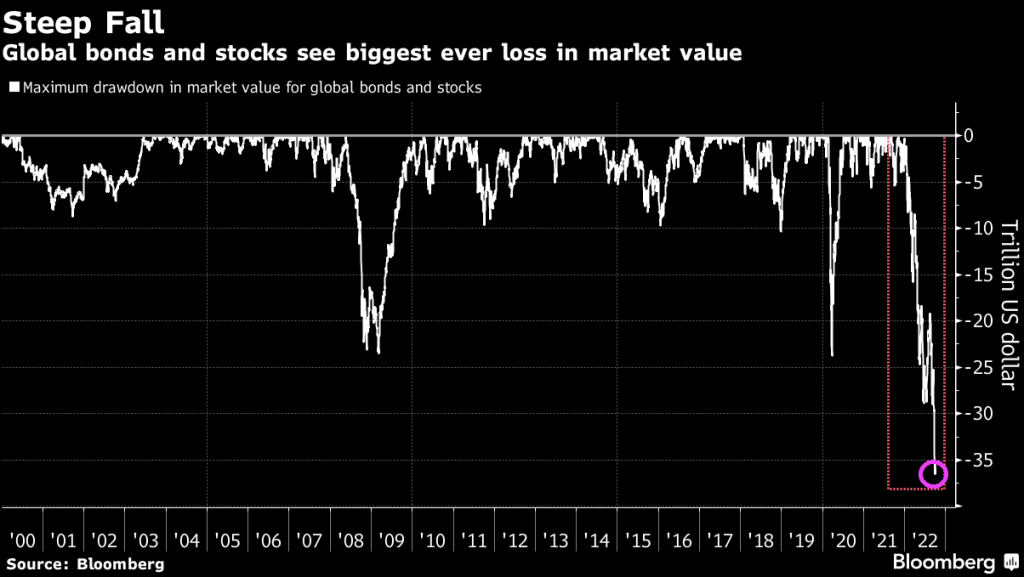
More tech tantrums. China’s Covid surge. And above all, no central banks riding to the rescue if things go wrong. Reeling from a record $18 trillion wipeout, global stocks must surmount all these hurdles and more if they are to escape a second straight year in the red.
With a drop of more than 20% in 2022, the MSCI All-Country World Index is on track for its worst performance since the 2008 crisis, as jumbo interest rate hikes by the Federal Reserve more than doubled 10-year Treasury yields — the rate underpinning global capital costs.
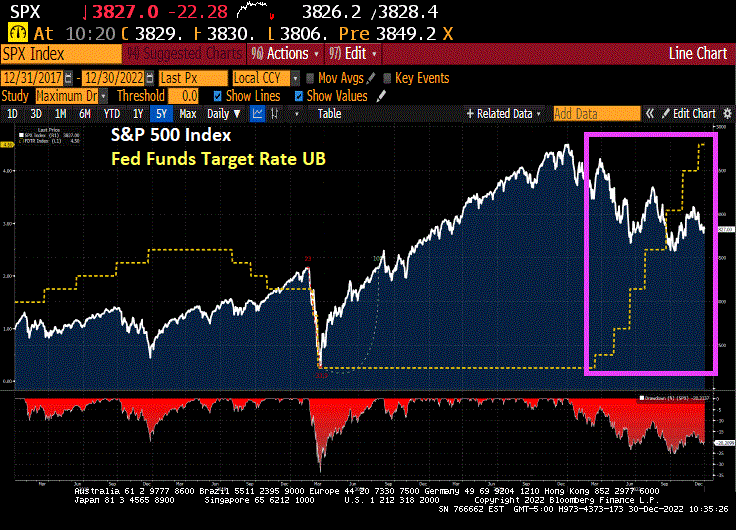
And in the US, we have the S&P 500 index being pulverized by Fed rate hikes to in their attempt to slow inflation.
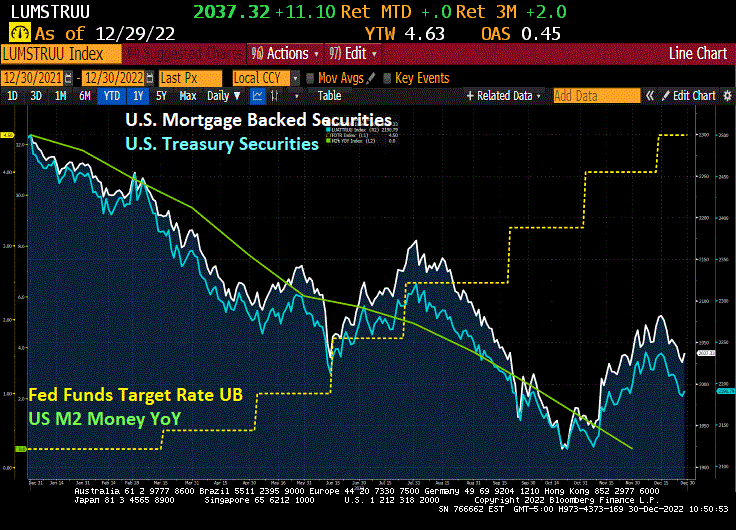
And in the US, mortgage-backed securities and Treasury securities are also getting pulverized by inflation and Fed rate tightening.
We are now left with the leftovers like high inflation.
The market began downshifting earlier this year as the Federal Reserve started hiking its benchmark interest rate, with the goal of easing high inflation that’s been driven in part by skyrocketing housing costs.
Rates for 30-year, fixed mortgages reached 7.08% in October — and again in November — though they have since retreated, Freddie Mac data show. With borrowing costs roughly double where they were at the start of the year, and inflation leaving less savings to put toward a down payment, homebuyers have pulled back. Sellers are also reluctant to list their properties, yet houses that are on the market are lingering and getting discounted as demand slumps.
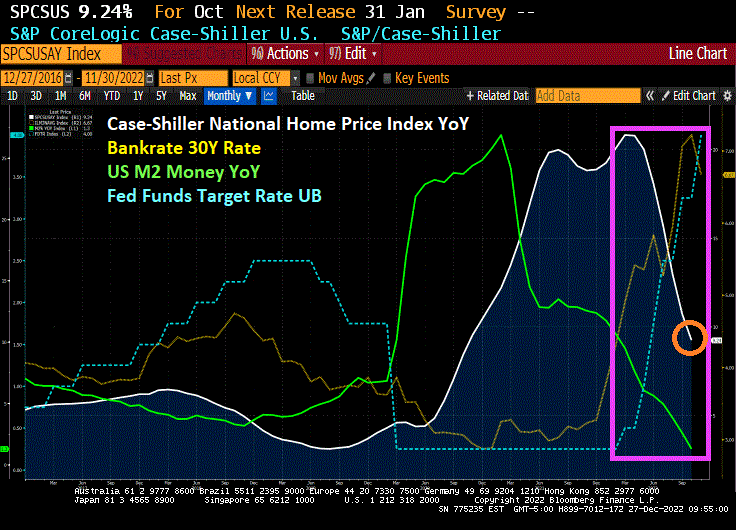
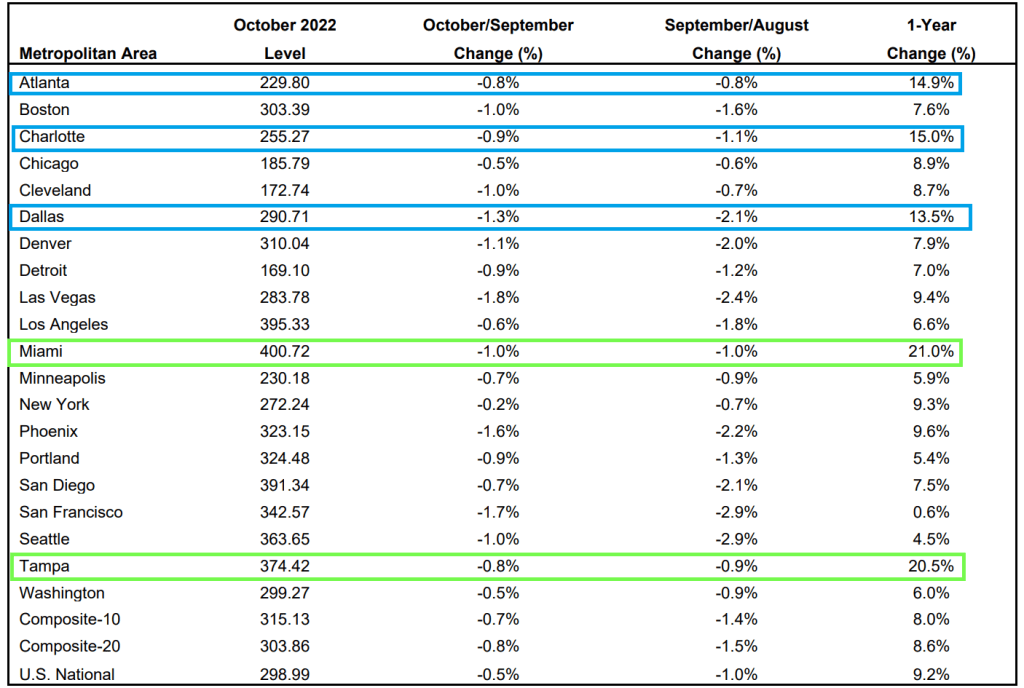
The Case-Shiller National Home Price Index “cooled” to 9.24% YoY growth as The Federal Reserve tightens its monetary noose.
Of the top twenty metro areas, both Miami and Tampa Florida were up over 20% YoY. Hot ‘Lanta, Charlotte and Dallas were over 10% YoY. Mordor on the Potomac was up “only” 6% and all other metro areas were under 10%.
But if we look at October/September changes, all metro areas are down (MoM) with San Francisco the worst.
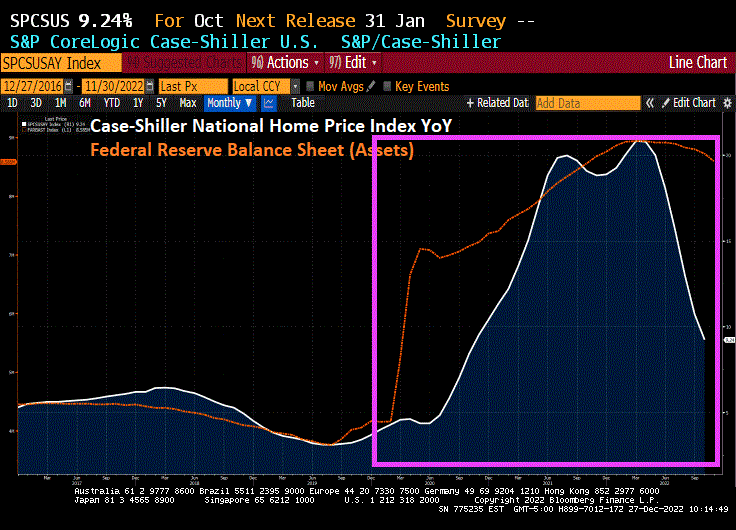
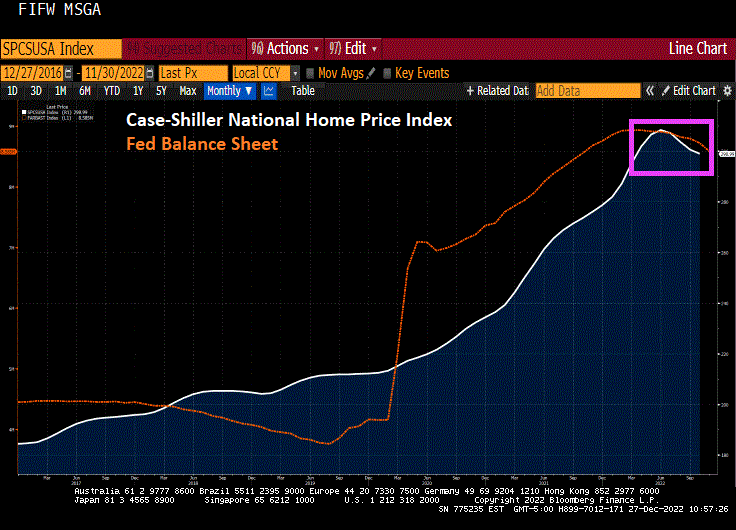
Finally, The Federal Reserve’s massive balance sheet is still out in force.
Look at this chart of the Case-Shiller National home price index again The Fed’s balance sheet. Uh-oh.
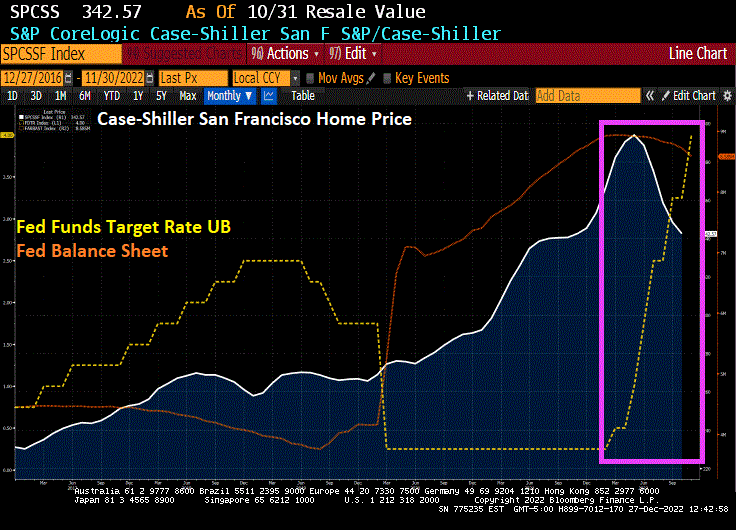
Let’s look at San Francisco (my hometown) since The Federal Reserve began interest rate tightening.
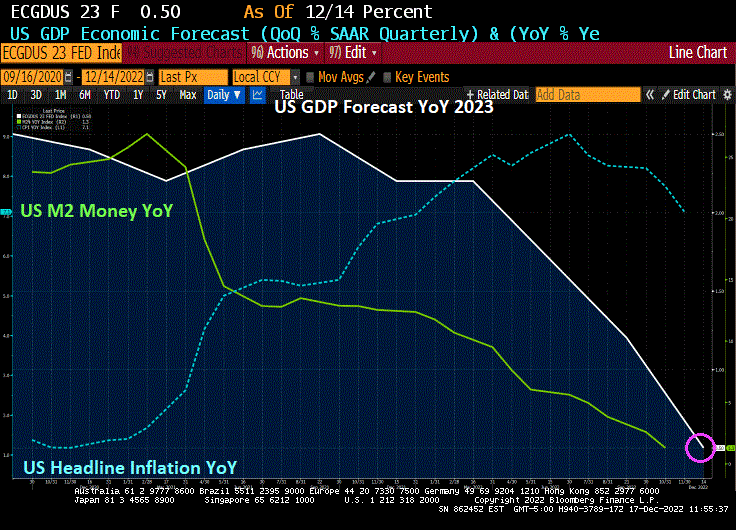
The Federal Reserve forecast for the US economy is a dismal 0.50% YoY. Do I detect a trend?
The FOMC forecast for 2023 and 2024. Core PCE YoY (inflation) is forecast to drop to 3.50%, still considerably higher than The Fed’s target rate of inflation of 2%. And unemployment is forecast to be 4.60%.
To cope with Bidenflation, US personal savings rate as of October is -67.9% YoY. The “good” news is that rents YoY are crashing. But food prices under Inflation Joe remain very high. But most everything is slowing down, not due to Biden’s policies, but a global and US economic slowdown.
With a big slowdown coming our way, you can understand why The Fed’s December Dot Plot is showing declining Fed Funds Target rate starts declining in 2024.
Even US mortgage rates are headed down.
Speaking of going down, cryptos are down across the board with Cardano leading the decline at -6.91%.
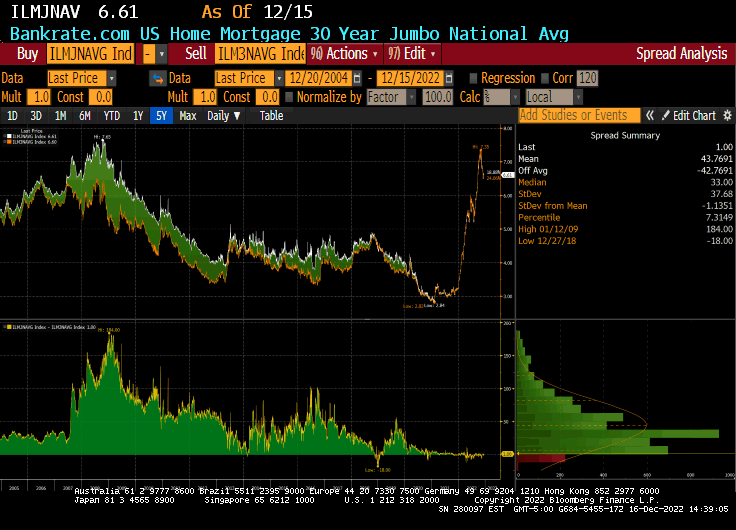
Years ago, Brent Ambrose, Michael Lacour-Little and I wrote a paper on the US 30-year jumbo mortgage spread over conforming 30-year mortgage rates entitled “The effect of conforming loan status on mortgage yield spreads: a loan level analysis.” But that paper was written before Covid and the dramatic distortion caused in mortgage markets by The Federal Reserve’s massive increase in money.
Here is the spread between Bankrate’s 30-year mortgage rate and their 30-year JUMBO mortgage. Notice that between 2007 and early 2020, the median “jumbo spread” was 49 basis points. But after Covid and The Fed’s counterattack (by printing M2 Money), the median Jumbo spread from 4/1/2020 to today is only 1 basis point.
In the following chart, you can see the jumbo mortgage rate (yellow) against the conforming mortgage rate (white) and there is almost always a spread between the two UNTIL 2020 where we saw M2 Money growth (green line) spike and The Fed increased their purchases of Agency MBS (purple line). Since Covid and The Fed’s massive reaction, the jumbo rate and conforming rate are virtually the same. In fact, the latest jumbo spread is 1 basis point over the conforming rate.
Why is this happening? One explanation is that demand from the investors who ultimately buy jumbo mortgages. The strong demand by investors appears to have driven down the yields on jumbos relative to conventional loans, especially as the use and accessibility to jumbos has grown.
A second explanation is that Loan Level Price Adjustments that were added to conforming loans post-financial crisis never went away (until just recently on selected loans). This makes jumbos and conforming loans very close in yield.
So, when will the mortgage market return to normal and jumbo mortgages go back to the normal 50 basis point spread? We may see normalization if The Fed speeds up its withdrawal from markets. Also, getting rid of Loan Level Price Adjustments would help normalized the mortgage market.
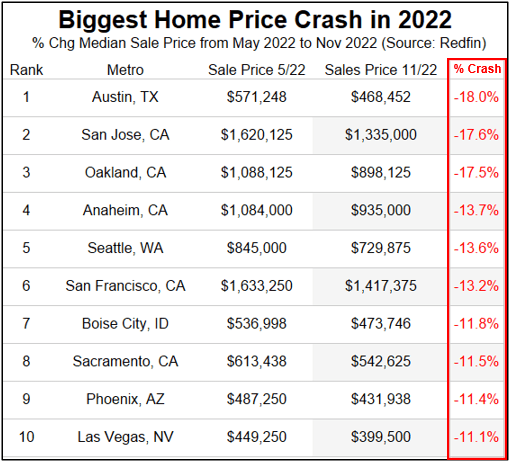
But things are getting stressed in jumboland (California) where home prices are crashing in 5 of the top 8 metro areas.
Harry Houdini couldn’t have created a more tantalizing mystery … and one I wish would go away.


You must be logged in to post a comment.