Running On Empty? The Free Money Has Run Out (M2 Money Growth Has Been Negative For The Past Year!)

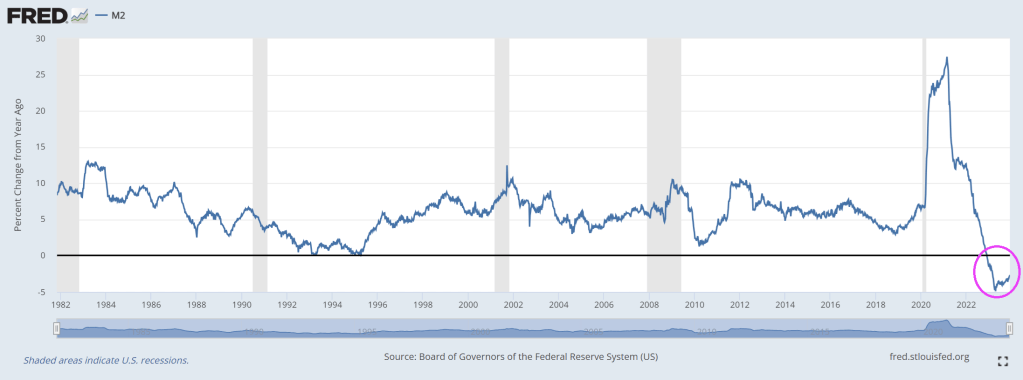
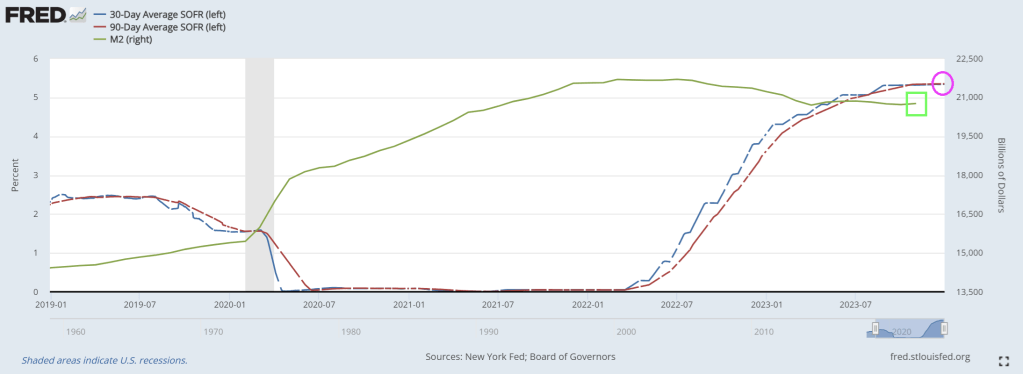
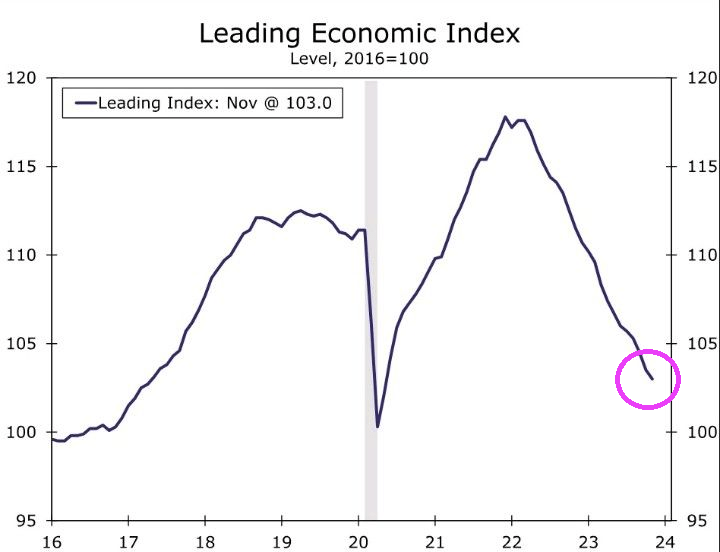
Jackson Browne said it best. The US economy is “running on empty.”

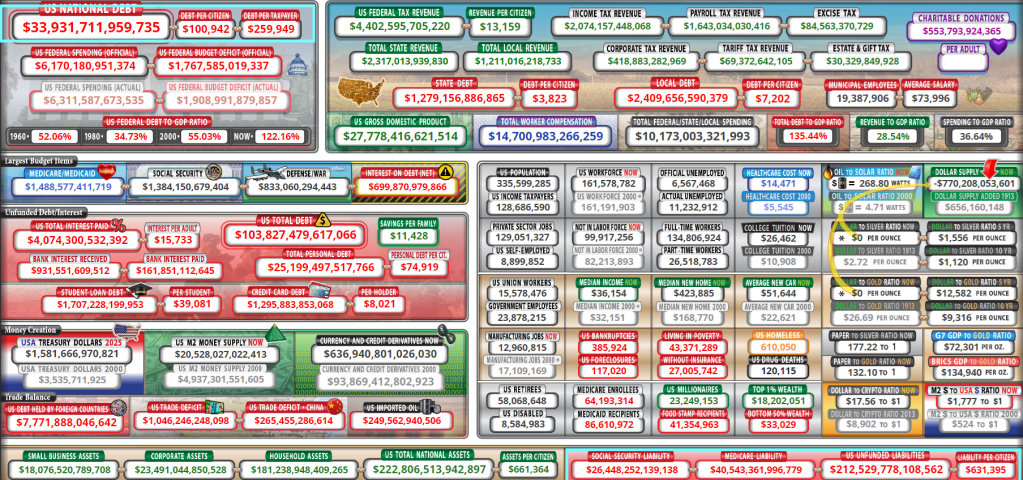
M2 Money growth is negative. And M2 Money growth has been negative for the last year.

The third and largest round of fiscal stimulus was in March of 2021. That’s when Biden’s popularity peaked at 55.1 percent.

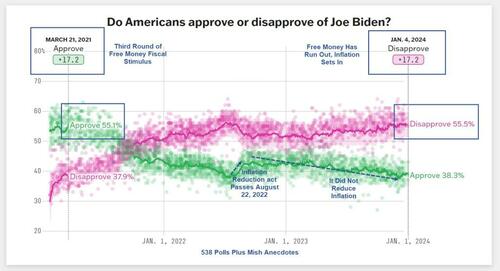
Base image from 588 Biden Approval Ratings.

Why Biden’s Approval Rating Is Miserable

Income is rising and so are wages. Even real income is up. But real wages are another matter.

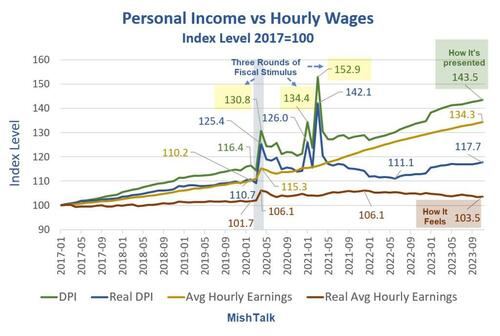
Personal income data from the BEA, hourly wages from the BLS, real hourly earnings and chart by Mish.

Personal Income vs Hourly Wages Notes

  • DPI means Disposable Personal Income. Disposable means after taxes.
  • Real DPI means inflation adjusted using the Personal Consumption Expenditures (PCE) deflator. Real DPI is a BEA calculation.
  • Average hourly earning are for production and nonsupervisory workers.
  • Real wages are deflated by the Consumer Price Index (CPI) not the PCE.
  • The BLS does not report a real hourly wage. I used the CPI-W index for production and nonsupervisory workers, produced by the BLS, as the deflator.

Personal Income Definition

The BEA defines personal income as “Income that people get from wages and salaries, Social Security and other government benefits, dividends and interest, business ownership, and other sources.” 

Rental income is a part of other sources.

Three Rounds of Fiscal Stimulus

  • Round 1, March 2020: $1,200 per income tax filer, $500 per child(CARES Act) – Trump
  • Round 2, December 2020: $600 per income tax filer, $600 per child (Consolidated Appropriations Act, 2021) – Trump
  • Round 3, March 2021: $1,400 per income tax filer, $1,400 per child (American Rescue Plan Act) – Biden

The three rounds of free money fiscal stimulus (literally a helicopter drop), plus eviction moratoriums put an unprecedented amount of money in people’s hands. In addition, unemployment insurance paid people more to not work than they received working.

The third round of stimulus under Biden was totally unwarranted. However, it is also worth noting that Trump wanted a much bigger second stimulus package than the Republican Congress gave him. Trump is no fiscal hero.

For more discussion, please see Why Biden’s Approval Rating Is Miserable in One Economic Chart

The three stimulus packages, on top of supply chain disruptions, energy disruptions due to the war in Ukraine, and Bidenomics in general, set in motion the biggest wave of inflation in over 30 years.

Biden went from an approval rating of 17.2 percent to a disapproval rating of 17.2 percent.
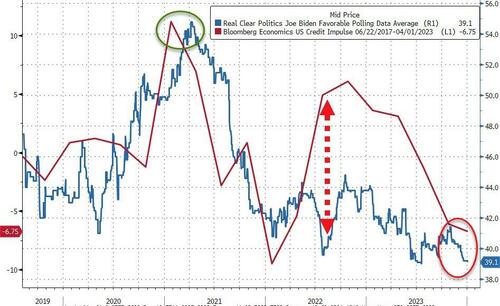
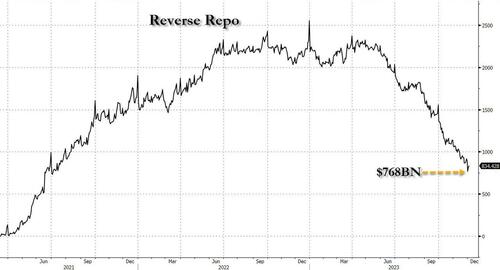
Peak Free Money

In addition to declining real wages, perhaps Biden’s big problem is the free money has run out.

Biden’s popularity peaked in March of 2021 along with stimulus. Was that a honeymoon impact or peak free money?

[ZH: While not a perfect indicator, the lagged US credit impulse perhaps provides a proxy for US fiscal excess and when overlaid with Biden’s approval rating, it is clear that 2022’s re-acceleration did nothing for people’s faith in him… and it’s only got worse…]

I suspect a bit of each coupled with hope of more free money, especially student loan forgiveness.

Sending free money to Israel and Ukraine does not help perceptions of how Biden is doing. And neither does the border or ridiculous energy regulations that cost people money.

Biden keeps telling people what a great job he has done.

I don’t believe it and most don’t either. And that shows up in the polls no matter what reason you assign.

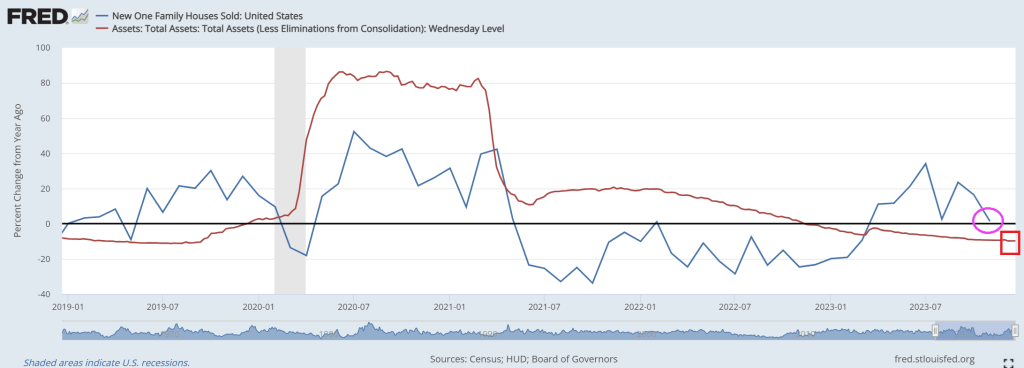
Can Biden scrounge up some more stimulus? Because the private sector is not doing well under “Open Borders Biden.”

Bidenomics Housing Market: Average US Household Can Afford Only Cheapest 16% Of Listed Homes (WORST Housing Affordability In History!)

Some content on this page was disabled on May 23, 2024 as a result of a DMCA takedown notice from Adtech lt, UAB. You can learn more about the DMCA here:

https://wordpress.com/support/copyright-and-the-dmca/

Bidenomics In One Chart! Top 1% (Donor Class) Have More Wealth Than Middle Class

Bidenomics is the pride of the donor class.

After all, much of the Federal spending splurge in green energy has gone to big donors, including the Chinese.

The top 1% of US earners now have more wealth than the middle class.

Biden’s song. All he wanted to do was destroy the US middle class. And The Fed’s snakejuice flows to the 1%.

Hey Joe! SOFR Suddenly Soars To Record High As Key Funding Spread Hints At Imminent Liquidity Crunch

Hey Joe (BIDEN)! Please stop destroying the economy!! (Here is my favorite version by Jim Pons and The Leaves!). The most lame version? The Byrds and David Crosby.

Over a month ago (and well before the Fed’s “shocking” dovish pivot) as the Fed’s Overnight Reverse Repo tumbled below $900 billion for the first time since June 2021 amid a growing debate of where and when the Fed’s reserve scarcity constraint will be hit, we warned that liquidity is rapidly approaching the reverse repo constraint level which could emerge as soon as the RRP facility dropped to $700 billion, at which point the market’s all-important credit plumbing will start to crack.

We didn’t have long to wait because just a few days later, on December 1 (just after the customary month-end window dressing period) when reverse repo tumbled to a fresh multi-year low of $765 billion…

… things indeed broke as we explained in “Sudden Spike In SOFR Hints At Mounting Reserve Shortage, Early Restart Of QE” (in which we correctly previewed the coming Fed pivot at a time when most were still dead certain that Powell would only care about inflation for months to come): that’s when the the all-important SOFR rate (i.e., the new Libor) unexpectedly jumped 6bps to 5.39%, the highest on record…

… also resulting in the largest SOFR spike vs ON RRP since Jan ’21, which hit 6bps.

The spike caught almost everyone by surprise, even such Fed-watching luminaries as BofA’s Marc Cabana because it was with “no new UST settlements, lower repo volumes, and lower sponsored bi-lateral volumes.”  More ominously, and confirming our take from three weeks ago, Cabana warned at the time (full note here) that “the move is consistent with the slow theme of less cash & more collateral in the system” – i.e., growing reserve scarcity –  and “may have been exacerbated by elevated dealer inventories, bi-lateral borrowing need, and limited excess cash to backstop repo. If funding pressure persists, it risks Fed re-assessment of ample banking system reserves & potential early end to QT.”

Then, the mini liquidity crisis disappeared almost as fast as it emerged, as SOFR rates eased off and the SOFR-Fed Funds spread normalized once GSE cash entered the market as it does every month….

… until today when not only did SOFR hit a new record high, ironically at a time when the market is pricing in more than 6 rate cuts in 2024…

… but the spread between the SOFR and the effective Fed Funds rate just spiked to the highest level since the March 2020 repo crisis…

.. with a similar move also observed in the spread between SOFR rate and the O/N Reverse Repo which similarly blew out to the widest since the start of 2021.

While there was no specific catalyst behind the sudden spike, two factors are the likely culprits: the year-end liquidity crunch, and the recent sharp increase in the Fed’s reverse repo facility, which has increased from a multi-year low of $683 billion on Dec 15 to yesterday’s $830 billion, and which STIR strategists expect will shoot up above $1 trillion in today’s final for 2023 reverse repo operation as a whopping $300+ billion in short-term liquidity in pulled from markets in just days.

That’s the bad news.

The good news is that come 2024 in a few hours, and specifically the first day of trading on Jan 2, we expect the reverse repo facility to plummet back to $700 billion once the year-end window dressing is over (especially with total US debt rising above $34 trillion to start the year), and floods the system with fresh liquidity which will stabilize the monetary plumbing at least until reverse repo dips below that key level of $700 billion at which point we expect the SOFR spikes to become a daily occurrence, and one which the Fed will no longer be able to ignore.

Indeed, one can already see traces of this in the repo market, where the rate on overnight GC repo first surged to 5.625% at the open on the final trading day of December before dropping to 5.45%, according to ICAP. It has since climbed back to 5.50%. But that’s still lower than where repo rates for Dec. 29 were trading during the prior session, as markets now start frontrunning the coming reverse repo liquidity flood.

Of course, once reverse repo eventually tumbles to $0 some time in March, all bets are off and the narrative shift to the next QE will begin.

“Say, can I sniff you if you take Trump off of Maine’s Presidential ballot??”

Loose As A Goose? US 30Y Yield Tumbles Back Below 4.00%, Financial Conditions Loosest Since May 2022

Are US financial conditions loose as a goose?

Despite resilience in US data, 30Y Yields have plunged back below the 4.00% Maginot Line this morning…

Source: Bloomberg

The last few weeks have seen US macro data reverse its recent trend of disappointment…

Source: Bloomberg

The long-end of the curve is outperforming…

Source: Bloomberg

But, ‘do not fight The Fed’ seems to be the narrative and expectations for a March rate-cut are rising once again…

Source: Bloomberg

And the market is pricing in over 160bps of cuts for next year…

Source: Bloomberg

Financial Conditions are now at the same level of looseness as of May 2022…

Source: Bloomberg

That is 300bps of Fed rate-hikes ago!!! Is that really what The Fed wanted?

Jay Powell and The Gang are likely partying at a nightclub drinking Heineken while the rest of us drink Pabst Blue Ribbon.

Biden Demands Media To Start Reporting Good Economic News (15.1 Million Jobs Added In 10 Months After Covid Economic Shutdown Ended Under Trump, 15.5 Million Jobs Added Under Biden In 34 Months After $6.25 TRILLION In Additional Public Debt)

C’mon Joe. The media has always reported bad news. Warm and fuzzy doesn’t anger people, but bad news does! And under Bidenomics, there has been a lot of bad news.

President Biden railed against corporate media before he and several family members headed by helicopter to Camp David, the presidential retreat in the mountains of western Maryland. 

Before boarding the presidential helicopter, Biden was asked by one reporter: “What’s your outlook on the economy next year?”

The president responded: “All good,” adding, “Take a look. Start reporting it the right way.”

Sounds like Biden watched the Travola/Jackson flick “Basic” where the infamous line was uttered “Tell the story right.”

OK Joey, let’s tell the story right. After the horrendous economic shutdowns of local economics and schools in 2020, 15.1 million jobs were added after the shutdowns ended in just 10 months. Wow, that was simple! But under Biden’s Reign of Economic Error, only 15.5 million jobs were added over the next 34 months.

But Biden’s record on jobs comes at the expense of an additional $6.25 TRILLION IN PUBLIC DEBT.

With $34 trillion and rapdily growing debt and budget deficits, it is hard to find good news about Bidenomics.

The Fed Killed Inflation? US Home Prices Surged For 9th Straight Month In October (+4.8% YoY), Led By Miami And Detroit(?)

So much for “The Fed killed inflation” narrative. Inflation is still alive and well in housing prices. Particularly in cities like Miami and Detroit? Maybe the Lions winning their division for the first time in 30 years helped!

The S&P CoreLogic Case-Shiller U.S. National Home Price NSA Index, covering all nine U.S. census divisions, reported a 4.8% annual change in October, up from a 4% change in the previous month. The 10-City Composite showed an increase of 5.7%, up from a 4.8% increase in the previous month. The 20-City Composite posted a year-over-year increase of 4.9%, up from a 3.9% increase in the previous month. Detroit reported the highest year-over-year gain among the 20 cities with an 8.1% increase in October, followed again by San Diego with a 7.2% increase. Portland fell 0.6% and remained the only city reporting lower prices in October versus a year ago.

The Case-Shiller National Home Price index was up 4.8% in October as The Federal Reserve keeps its monstrous foot on the balance sheet pedal.

Home prices in America’s 20 largest cities rose for the 9th straight month in October (the latest data released by S&P Global Case-Shiller today), up 0.64% MoM (slightly better than the +0.60% MoM expected).

That pushed the YoY rise in prices up 4.87% – the fastest pace since Dec ’22…

Source: Bloomberg

…but as the chart shows the MoM gains are slowing rapidly.

“U.S. home prices accelerated at their fastest annual rate of the year in October”, says Brian D. Luke, Head of Commodities, Real & Digital assets at S&P DJI.

“We are experiencing broad based home price appreciation across the country, with steady gains seen in nineteen of twenty cities.”

Miami and Detroit saw the biggest MoM gains while the West Coast dominated the MoM price declines with San Francisco, Portland, and Seattle worst.

But, judging by the resumption of the rise of mortgage rates since the Case-Shiller data was created, we would expect prices to also resume their decline…

Source: Bloomberg

So prices are up, mortgage rates are actually falling again now (lagged)… so The Fed is re-blowing the same bubble?

Well, at least Detroit is near the top! Playing in Rocket Mortgage stadium.

Bidenomics Isn’t Working! Conference Board Leading Economic Index Fell Again In November

Biden says over and over again the Bidenomics is working. It isn’t working.

The Conference Board Leading Economic Index® (LEI) for the U.S. declined by 0.5 percent in November 2023 to 103.0 (2016=100), following a (downwardly revised) decline of 1.0 percent in October. The LEI contracted by 3.5 percent over the six-month period between May and November 2023, a smaller decrease than its 4.3 percent contraction over the previous six months (November 2022 to May 2023).

Alarm! US New Home Sales Crash In November, Despite Plunging Rates (New Home Sales Down -12.2% From October)

Alarm! New home sales dropped like Biden’s popularity in November, down -12.2% from October.

While existing home sales bounced very modestly off record lows in November, it has been the ‘strength’ of new home sales – with buyer heavily subsidized by homebuilders – that has held up the housing market.

Of course, investors don’t care about actual fundamentals, rates are down so ‘buy buy buy’ the builders…

Source: Bloomberg

Trouble is, even as mortgage rates have plunged recently, applications for home purchases has continued to decline…

Source: Bloomberg

And while mortgage rates have declined (rapidly), they remain massively high relative to the effective mortgage rate for all Americans. That difference is the ‘subsidy‘ that homebuilders have to fill to enable buyers – and it’s still yuuuge!

Source: Bloomberg

So, just how many new homes were sold in November?

The last few months have been very choppy for new home sales but November clarified that homebuilders just hit a wall on their subsidization!

New home sales crashed 12.2% MoM – the biggest MoM drop since April 2022. That dragged the YoY change to just 1.4%…

Source: Bloomberg

9 of the last 10 months have seen downward revisions to the new home sales SAAR!

Source: Bloomberg

New home sales fell in the South by the most, followed by the West. The Northeast and Midwest saw increased sales…

Source: Bloomberg

The new home sales SAAR printed 590k (well below the 690k exp) – the lowest since Nov 2022… catching down to existing home sales reality…

Source: Bloomberg

And another catch-up to reality for sales, even as rates tumble…

Source: Bloomberg

Finally, we note that the median new home priced jumped to $434.7k from $414.9k…

Source: Bloomberg

The median existing home price dropped to lowest since April while median new home price jumped to highest since August

Odd that these ‘actual’ new home sales are plunging as ‘soft survey’ data shows homebuilder sentiment rising, and housing starts.

Biden’s Fiscal Inferno! Treasury Warns Budget Deficit Up 13%, Debt Reaching $34 Trillion (Don’t Forget About $212.5 TRILLION In Unfunded Liabilities)

It‘s Biden’s Fiscal Inferno! Insane open borders, insane green spending, wars in Ukraine, Gaza and growing restlessness around Taiwan. Inflation. And a demented 81-year old President in charge.

The U.S. government ran a budget deficit of $381 billion so far into the 2024 fiscal year, which represents a 13% increase from this same time period last year.

The deficit is $44 billion higher than it was at the end of November 2022, according to the latest data released by the U.S. Department of the Treasury.

Congress passed a “laddered” continuing resolution in November with a final expiration date of February 2. Conservative House Republicans have been calling for a reduction in federal spending to reduce the budget deficit. Congress must pass another spending bill to keep the government funded past Feb. 2.

The specific cuts the House GOP is considering remains unclear at this time, but any reduction in spending is likely to hit roadblocks in the Democratic-led Senate. Senate Majority Leader Chuck Schumer, D-N.Y., has criticized previous GOP attempts to cut domestic spending levels.

In September, House Republicans were trying to cut annual spending by about $120 billion, which still would not balance the budget. Congressional Democratic leaders were critical of their approach at the time.

Senate congressional leaders are currently debating a foreign assistance package that would provide additional aid to Ukraine and Israel as well as humanitarian assistance for Palestinian refugees along with money for U.S. border security. Senate leaders said on Tuesday that both sides were closer to a deal, but a formal agreement hasn’t been reached yet.

“With regard to the border discussion, I think it’s pretty safe to say that we’ve made some significant progress, but we obviously aren’t there,” McConnell said at the Capitol during his weekly news conference on Tuesday.

On the House side, Republicans have argued that additional aid for Israel and Ukraine should be paid for or “offset” by equivalent spending reductions. Schumer has said that such foreign assistance does not need to be paid for since it is considered emergency spending.

Senators are still in Washington negotiating on the package but the House has left town for the holidays.

Scott Hodge, president emeritus and senior policy adviser at the Tax Foundation, a nonpartisan tax policy 501(c)(3) nonprofit, said the U.S. Treasury reporting a 13% increase in the deficit compared to November 2022 shows the U.S. government continues to go down the wrong path when it comes to fiscal policy.

“It is being driven by federal spending, which is up by $152 billion, a 17% increase compared to the same month in 2022. The monthly deficit would have been worse if decent economic growth hadn’t boosted federal tax collections by $108 billion, or 19%,” Hodge told Just the News.

“The problem with the federal budget is basic math—the growth in spending continues to outpace the growth in tax collections. This is why our national debit is heading toward $34 trillion. It cannot go on forever without serious economic consequences,” he added.

Maya MacGuineas, president of the Committee for a Responsible Federal Budget, shared a similar perspective on the matter. “The longer we allow our debt to worsen, the less room we ultimately have to respond to the kinds of global emergencies we’re seeing in the world today,” she said.

“This leaves policymakers with a choice: make the hard choices today by paying for our priorities and putting the national debt on a sustainable trajectory, or saddle the next generation with an even worse situation,” she added.

The national debt in January of 2020 was $17.2 trillion, according to historical data from the Peterson Foundation. By contrast, the national debt is currently $33.9 trillion, according to the U.S. Treasury.

And don’t forget that $212.5 TRILLION in unfunded liabilities.