How To Stop Inflation Without A Recession? Slow Federal Spending And Shrink The Fed Balance Sheet (Return To Demand Economy From Obama/Biden’s Command Economy)

Inflation is a killer to the middle class and low-wage worker. Yet there are always apologists for terrible Federal spending and Federal Reserve monetary policies. Like Alex Bereson with his “How we stopped inflation without a recession (hint: by not stopping inflation).”

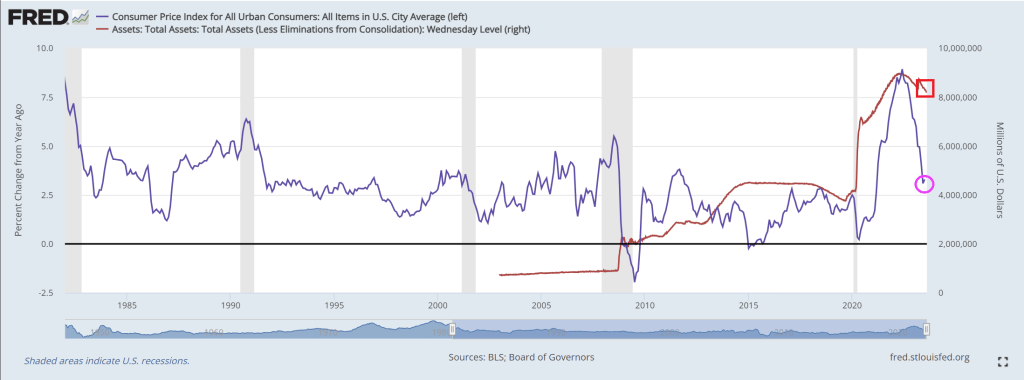
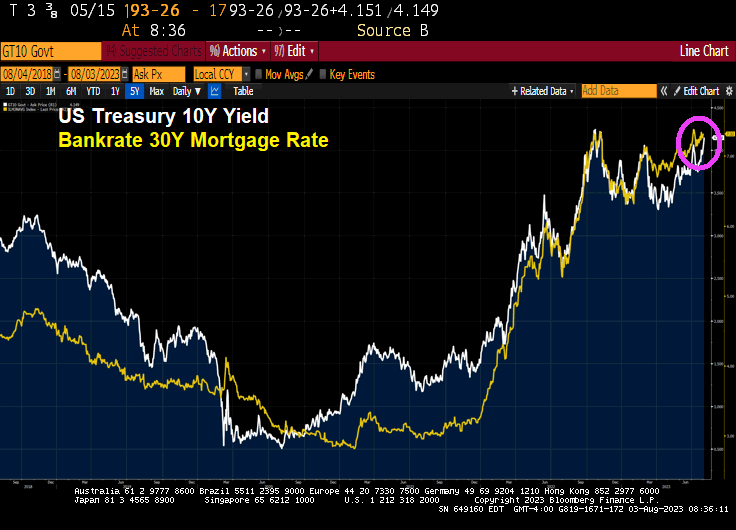
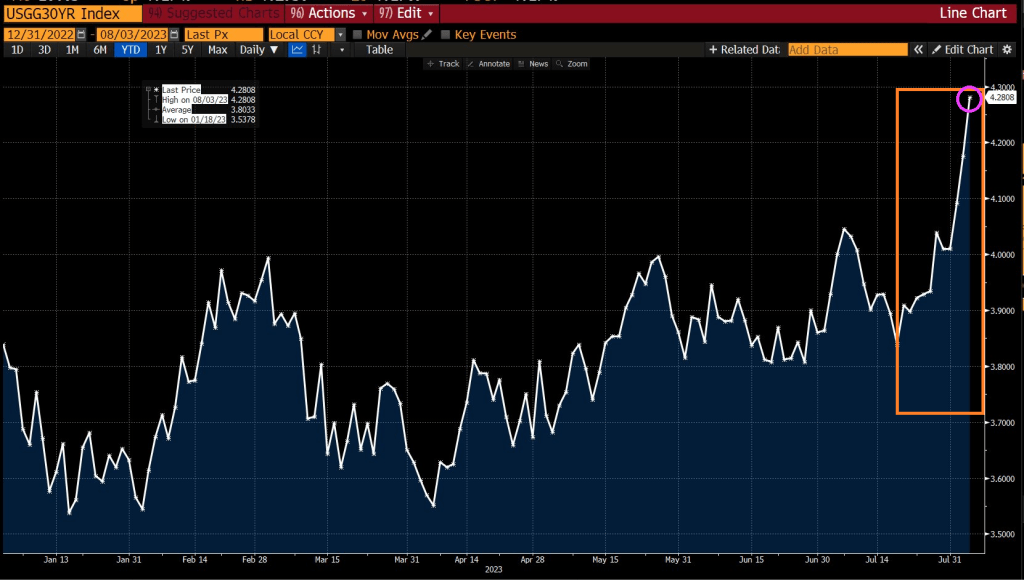
Before I look at Berenson’s plea for more inflation, let’s see where Federal spending and Fed Monetary policies have left us. As of this morning, the REAL US Treasury 10-year yield (nominal yield less inflation), is now the highest since two crises ago, meaning The Great Recesssion and the first major overreaction of The Federal Reserve in late 2008.

Here is Berenson’s chart showing changes in inflation (CPI YoY) from 1966-1982 compared with recent inflation (orange) from 9/30/2013 – 06/30/2023. A charist might get confused and assume that inflation is will start rising again. But it is far more complicated than a simple projection.

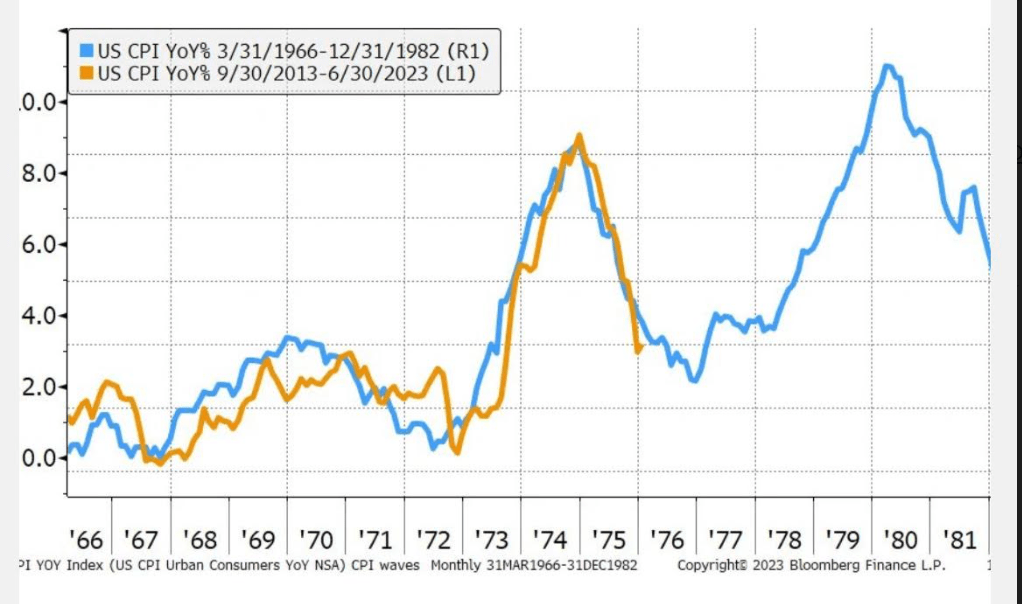
One of the complications to the narrative is the change in the US economy after the Carter recession of 1980 and the inherited recession inherited by Reagan from Carter from 1981-2.

Since 1982 and the Carter recessions, we have seen incredible growth in Federal spending and when the proved insufficient, a massive increase in Fed monetary stimulus in late 2008 and then again in 2020 due to Covid. Remember Winston Churchill’s quote regarding water, “Never let a good crisis go to waste.” That has morphed into a battle cry for more government spending and regulation, not to mention Federal Reserve monetary policies.

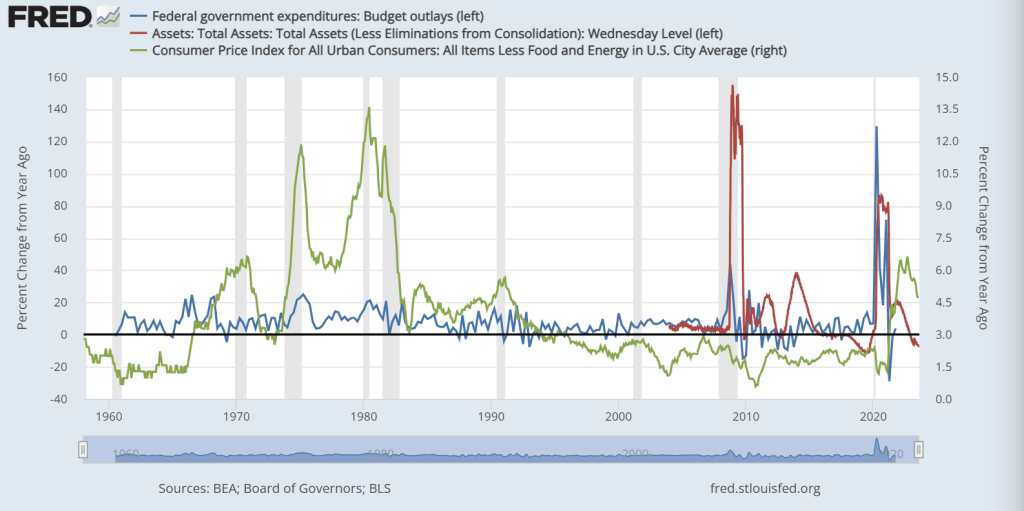
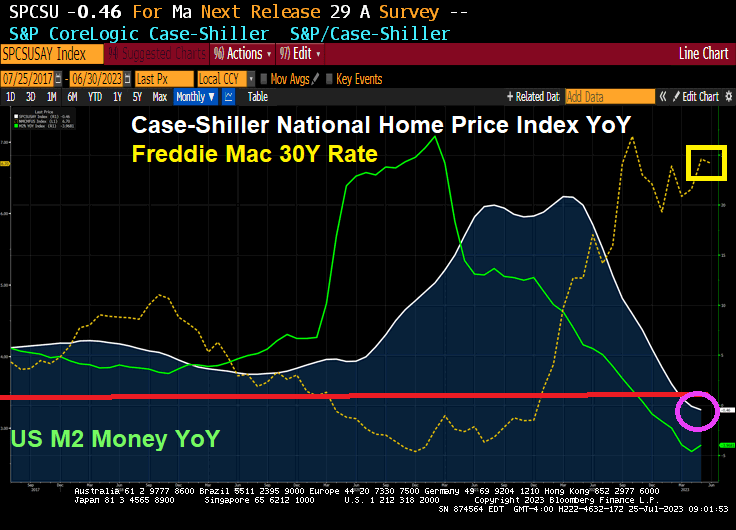
Notice that core inflation under Carter (green line) was gut wrenching (yet Berenson just shrugs it off). Core inflation is still at a horrible 4.7% YoY. But you can see the spikes in Federal spending (blue line) and Fed Monetary stimulus (red line) associated with the financial crisis of 2008-2009 and Covid 2020-2021.

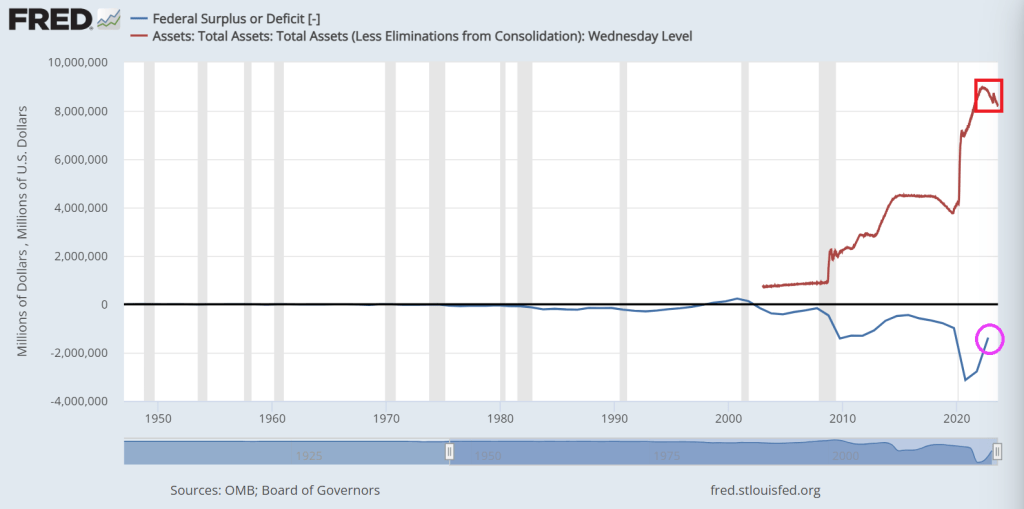
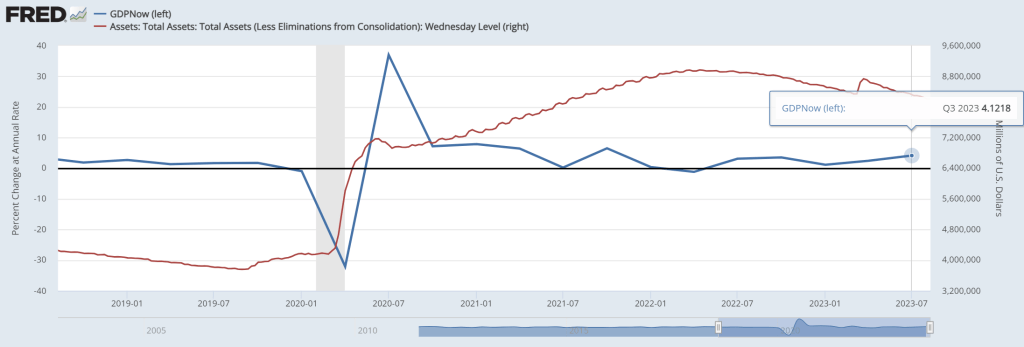
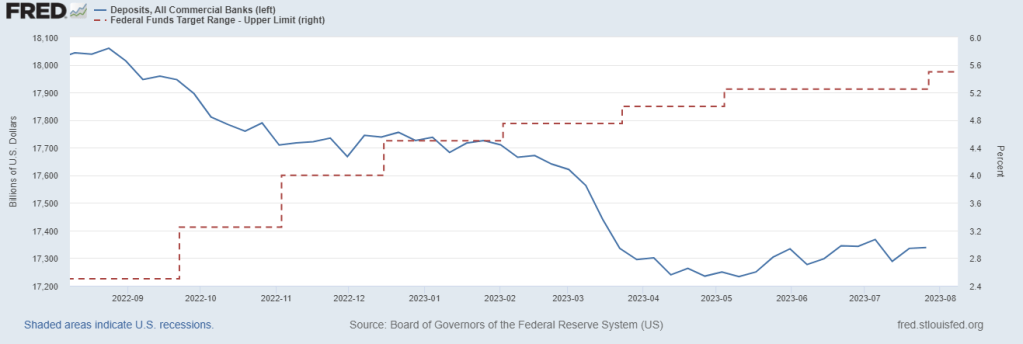
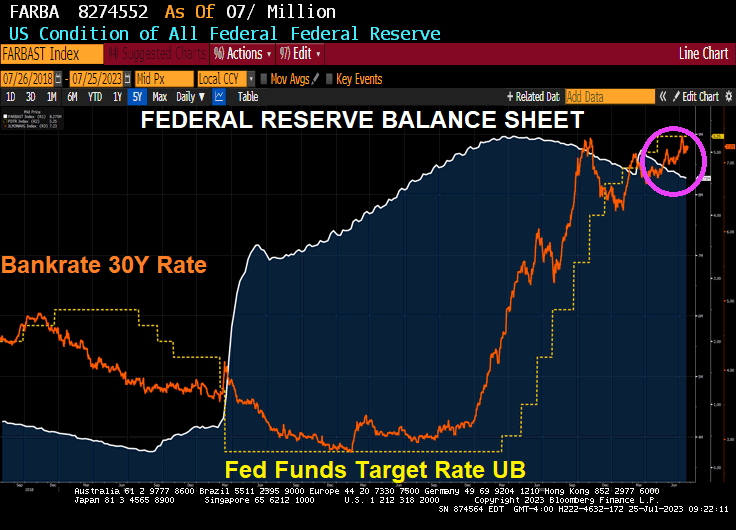
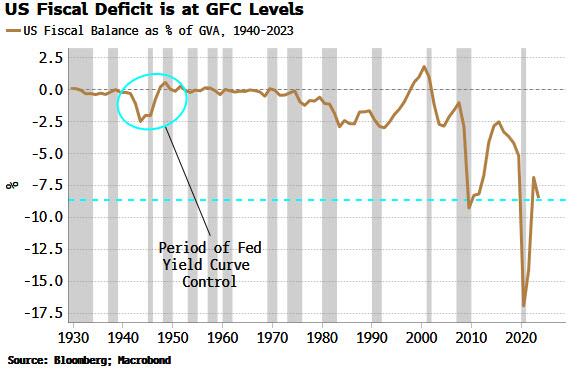
Then we have the Federal budget deficit, still over $1 trillion (despite perpetually confused President Biden claiming he got rid of the deficit). Meanwhile, The Federal Reserve still has over $8 TRILLION in monetary stimulus sloshing around the financial system.

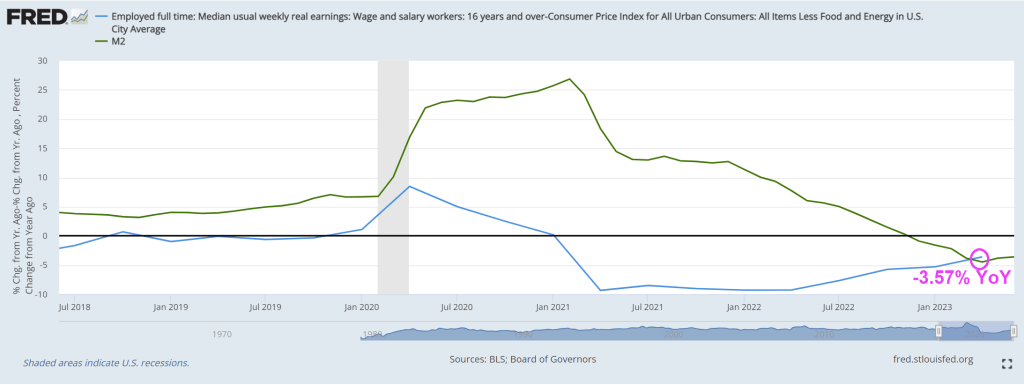
Inflation is a horrifying by-product of Federal spending and Fed monetary policy (especially under Fed Chair Janet Yellen). Unfortunately, Yellen is now the US Treasury Secretary. For example, REAL average hourly earnings are declining thanks to inflation.

Berenson closes his piece with this sobering statement: “Ultimately, this pattern is why inflation is so problematic. It is addictive, and breaking the addiction means damaging the economy.”

Its Federal spending that addictive, and eventually Congress has to cut its insane spending levels. Even if it lowers GDP and increases unemployment. Take a look at China, a command economy, that is really suffering despite massive government spending.

Berenson is saying “all the Biden defenders are saying we’ve won the battle with inflation. But how can that be so with how much we’ve spent?” I agree, but will Washington DC ever learn? I doubt it.

Under Obama/Biden, the US economy is transitioning from a demand economy to a Soviet/Chinese-style command economy where central government directs economic traffic. We need to bite the bullet and return to a deamnd economy.

Dark Side Of Federal Stimulus! Checkable Deposits Soared For The Top 1% In Terms Of Wealth Compared To Bottom 50% (The More The Fed Prints, The Wealthier The 1% Becomes)

Yes, there is a Dark Side to Federal stimulus! And it isn’t Dark Side of the Moon, but the dark side of who benefits from Federal stimulus. Its all about money.

Example? Take Checkable Deposits of the to 1% (blue line) of wealth compared to the bottom 50% of wealth (red line) after The Fed cranked up monetary stimulus to combat the Covid shutdowns.

On the wealth side, Covid-related monetary stimulus benefitted the top 1%.

But the middle class is expericing a tighening of credit coutesy of Cap’n Crunch (Fed Chair Powell).

Bidenomics: The Good, The Bad And The Ugly (Atlanta Fed GDP At 4.12% For Q2, Bank Credit Growth Goes Negative, Confernce Board Leading Indicator Goes Negative, REAL Gross Domestic Income Growth = -0.82%)

Bidenomics, which is also Yellenomics (the former Fed Chair and current Treasury Secretary) has The Good, The Bad and The Ugly to say for it.

First, The Good! The Atlanta Fed’s GDP Now real time GDP tracker has Q3 GDP at … 4.12%. Pretty good, but bear in mind that there is still more than $8 trillion in Fed Monetary Stimulus outstanding (aka, Yellenomics).

Second, The Bad. Bank credit growth is now negative.

As lenders are tightening credit standards for commercial and industrial loans.

The ugly? There are several candidates for this dishonor.

One, The Conference Board’s leading economic indicators is down -10.

Two, REAL median weekly earnings growth remains negative at -3.57% YoY.

Third, auto loan and credit card balances are at $1.5 TRILLION making further consumer credit more difficult to finance GDP growth.

Fourth, Real Gross Domestic Income growth was negative in Q1 2023.

I could go on and on about the negatives of Bidenomics (e.g., massive distortion of Federal spending towards green energy and big donors). Isn’t the earth moving closer to the Sun in its elliptical orbit?? HOW is spending trillions on green energy work as we move closer to the Sun??

I am waiting for Bill Gates to recommend firing nukes at the Sun to reduce the extreme heat as Earth moves closer to the Sun.

Merrick “The Mouse That Roared” Garland throws up roadblocks to protect “Stonewall Biden.”

Economic Rollerball! US Regional/Small Bank Shares Drop After Moody’s Cuts Ratings, Warns on Risks (Bidenomics Favors Large Firms, Not Small Firms)

  • Rating company downgrades 10 lenders, citing dimmer outlook
  • U.S. Bancorp, BNY Mellon among six firms facing potential cuts

Not surprising given that Bidenomics is nothing more than giving big bucks to big corporations, including banks. Regional/small banks? Not so much.

US bank stocks declined after Moody’s Investors Service lowered its ratings for 10 small and midsize lenders and said it may downgrade major firms including U.S. Bancorp, Bank of New York Mellon Corp., State Street Corp., and Truist Financial Corp.

Higher funding costs, potential regulatory capital weaknesses and rising risks tied to commercial real estate are among strains prompting the review, Moody’s said late Monday.

“Collectively, these three developments have lowered the credit profile of a number of US banks, though not all banks equally,” the rating company said.

Moody’s Sees Problems Ahead for US Banks

Rating company issues raft of downgrades, outlook

Source: Moody’s

Shares declined for firms that had their ratings cut, including M&T Bank Corp., down 3.2%, and Webster Financial Corp., which lost 1.3%. Moody’s also adopted a “negative” outlook for 11 lenders, including PNC Financial Services Group, Capital One Financial Corp. and Citizens Financial Group Inc. Among those, PNC was down 2.2% and Capital One lost 2.4%.

Investors, rattled by the collapse of regional banks in California and New York this year, have been watching closely for signs of stress in the industry as rising interest rates force firms to pay more for deposits and bump up the cost of funding from alternative sources. At the same time, those higher rates are eroding the value of banks’ assets and making it harder for commercial real estate borrowers to refinance their debts, potentially weakening lenders’ balance sheets.

“Rising funding costs and declining income metrics will erode profitability, the first buffer against losses,” Moody’s wrote in a separate note explaining the moves. “Asset risk is rising, in particular for small and midsize banks with large CRE exposures.”

Some banks have curbed loan growth, which preserves capital but also slows the shift in their loan mix toward higher-yielding assets, Moody’s said.

Banks that depend on more concentrated or higher levels of uninsured deposits are more exposed to these pressures, especially banks with high levels of fixed-rate securities and loans.

Deposits are declining as The Fed hikes rates.

So, Bidenomics reminds me of the film “Rollerball” where big corporations run the government and run a game akin to Rome’s gladiator fights.

“Pain Trade” Points To A Steeper US Yield Curve As Fed Remittances To US Treasury Soar (The Cost Of Bidenomics’s BIG Policies)

Yes, Bidenomics is an FDR-type massive expansion of government into the private sectors requiring massive Federal spending … and inflation. Except that it beenfits anything BIG and powerful to the detriment of the small and weak.

(Bloomberg) Friday’s jobs data sparked a relief rally in bonds and a flatter yield curve, but the pain trade is still for higher yields and a steeper curve – the lesser-spotted bear steepener – with this week’s CPI a potential catalyst.

Last week was a turbulent one for bonds, but the continued softening in payrolls data served to remind the market that supply and fiscal-profligacy fears have to be counter-balanced with an economy that’s in its late-cycle stages.

After the data, 10-year yields took the elevator back down to sub-4.05% after briefly going above 4.20%. They have since clambered back to 4.12%, but their next cue is likely to come from Thursday’s CPI report. Headline is expected to nudge back up to 3.3% (from 3% last month), mainly due to base effects, and core is expected to hold steady at 4.8%.

Still, stronger-than-expected data probably means higher yields in a market more acutely alert to inflation (and therefore supply) risks. As with last week, term premium would likely drive the move, meaning a curve steepening. After relentlessly flattening for the last two years, the pain trade is for a steeper curve. Implicit positioning of speculators from the COT report shows there is a heavy skew to a flatter curve.

The negative carry for most flatteners remains punitive (for 2s10s USTs it’s ~83bps over a year), but the large upside potential from supply/inflation worries and the covering of positions begins to make that look less insurmountable.

Finally, the Bundesbank’s decision to stop paying interest on domestic government deposits – which initially pushed short-term German bonds higher this morning – highlights the broader issue of central banks paying interest on reserves when they are superabundant.

In the days of QE and 0% interest rates, the ECB and Fed at al. remitted money to their treasuries from the income on their bond portfolios.

But now that is reversed as bond income is dwarfed by the cost of paying interest on trillions of bank reserves. Take the Fed, whose debt to the Treasury is now accruing at over $2 billion each week.

This is something that will become more politically contentious, especially as economies continue to slow and cost-of-living pressures bite further.

Bidenomics. The takeover of the US economy by BIG corporations, BIG labor unions, BIG tech, BIG pharma, BIG defense, BIG healthcare, BIG media, BIG banks, BIG tech, BIG … Well, anyting that is BIG and powerful that can buy influence in Congress and the Administration. Except BIG energy which lost out to BIG Progressive DC thinktanks.

Leading to BIG inflation!

But I feel good! Even though inflation expectations are soaring again as gasoline soars again.

Bidenomics Falsehood: Biden “Created” 400k Jobs Per Month While Trump Lost Jobs (Actually Trump Averaged 1.56 Million Jobs Added Post-Covid While Biden Averaged 400k)

“One of the most cowardly things ordinarily people do, Is to shut their eyes to facts.” – C.S. Lewis

Okay, we know Biden lies constantly and misrepresents facts (hey, he is a politician like Adam Schiff (D-CA). But this graphic praising Bidenomics with Biden having created the most jobs (average per month) since Carter (notice they left out Democrat darling Jimmy Carter!!!). In this absurd graphic, Biden wins by “creating” over 400k jobs per month while Trump lost jobs per month. Riveting … except that it is completely misleading.

Actually, the US economy added 12.53 million jobs after April 2020 (Trump) while Bidenomics created took 2 1/2 years to add 12.56 million jobs. So, Biden took over twice as long to create jobs after Covid than it did under Trump. Simply opening the economy and schools produced that magical claim by Biden. And the National Teacher’s Union and Randi Weingarten worked with Fauci to orchestrate shutting down schools. Blaming Trump for local governments shutting down the economy is pure bunk.

12.53 millions jobs added / 8 months = 1.56 million jobs average per month. Biden? 12.56 million jobs added / 30 months = .43 million jobs average per month. So, Trump averaged more than 3x the job growth post-Covid than Biden.

Here is the “glories of Bidenomics” from the White House. As Biden likes to say, pure malarkey!

I wonder if the Democrat Party is a rebirth of New York City’s Tammany Hall corrupt political movement of the 1800s? Is Biden Boss Tweed? Or is Obama Boss Tweed with Biden as his nasty, dimwitted henchman?

In 1871, Thomas Nast denounces Tammany as a ferocious tiger killing democracy. The image of a tiger was often used to represent the Tammany Hall political movement. Sounds an awful lot like today’s Democrat Party.

Perhaps a fez for Democrats?

Bidenomics! Ford Will Lose $4.5 Billion On EVs This Year, Up From $2.1 Billion Last Year (Ford DOWN -48% Since January 2022, GM DOWN -40% As Fed Withdraws Stimulus)

Bidenomics, the term for “Government Gone Wild! in terms of spending and EPA regulations, is a disaster for the US middle class and low wage workers. Even the 1% are now hurting if bought into Biden’s green lunacy. Ford is now down -48% since January 14, 2022 as The Fed started raising rates to fight inflation. GM is down “only” -40%.

Ford is slated to lose $4.5 billion from its EV segment this year, a $1.5 billion larger loss than the company had expected. 

So far this year, the division has lost $1.8 billion and this year’s $4.5 billion loss figure blows away last year’s $2.1 billion loss. Ford also announced that its electric F-150 pickup trucks will undergo a price cut, according to Fox.

Ford beat earnings on Thursday and reported adjusted EPS of $0.72, beating expectations of $0.54. It posted revenue of $45 billion and adjusted EBITDA of $3.8 billion, above estimates of $3.15 billion. 

The company also raised its guidance, forecasting adjusted EBIT of $11 billion to $12 billion from $9 billion to $11 billion. The company is now guiding for free cash flow of $6.5 billion to $7 billion, from $6 billion. 

But reality has sunk in about the company’s comments regarding its EV production schedule and spending plans. Price cuts in the industry, led by Elon Musk and Tesla, have thrown Ford’s production targets into a tailspin and Morgan Stanley noted on Friday morning that “major changes to the EV strategy” could be necessary, according to a wrap up by Bloomberg. 

Ford now says it is “throttling back” on plans to ramp up EV production, the wrap up said. It blamed the price war for EVs as part of the cause and told shareholders it would need another year to meet its target of 600,000 EVs produced annually. 

Ford CEO Jim Farley said late last week: “The shift to powerful digital experiences and breakthrough EVs is underway and going to be volatile, so being able to guide customers through and adapt to the pace of adoption are big advantages for us. Ford+ is making us more resilient, efficient and profitable, which you can see in Ford Pro’s breakout second-quarter revenue improvement (22%) and EBIT margin (15%).”

CFO John Lawler said yesterday that the company “has ample resources to simultaneously fund disciplined investment in growth and return capital to shareholders – for the latter, targeting 40% to 50% of adjusted free cash flow,” Bloomberg added. He now says Ford is “not providing a date” for producing 2 million EVs per year, which was previously the company’s target for 2026. 

Ford’s inability to compete with Tesla was noted earlier this year in a piece titled Tesla ‘Weaponizes’ Price-Cuts To Crush EV Competition

Is the company pulling an Intel and “kitchen sinking” its guide for the year, or has Elon Musk’s price cuts over at Tesla really put the legacy automaker on the ropes? Ford reports again on October 26, where we’ll get our next glimpse into its continuing operations this year. 

Tesla is down -26% since January 14, 2022. And showing a nice turnaround!

Today, the 10-year Treasury yield is up 11 basis points.

Government Gone Wild!

Bidenomics? US Treasury Rates Rise As US Fiscal Deficit Back To Financial Crisis Levels As Tax Revenues Collapse

US Treasury yields are up today along with 30-year mortgage rates. There is a lot happening in bond markets.

It’s been a tumultuous week for yields, with the Bank of Japan’s policy tweak, and the Treasury increasing its funding needs. But Fitch was the weatherman with its US downgrade, telling us about the downpour we can see for ourselves just by taking a glance at the fiscal data. In short, the US faces a perfect storm of a vertiginous fiscal deficit, a near-historically swollen debt load, ballooning interest-rate costs and collapsing tax revenues.

First, the deficit. It’s close to historical wides, bigger than it’s ever been outside of a recession, and almost as wide as it was in the depths of the GFC. It’s the largest in the world in GDP terms, and it is currently heading in the wrong direction. This heaps more pressure on the government debt-to-GDP level, already uncomfortably high at 112%.

Second, tax revenues. These have seen almost their largest annual fall ever, in an economy that’s supposed to be growing at 2.4%.

And then there’s rising interest-rate costs. The total interest expense as a percentage of tax revenue is expected to rise sharply in the next year or two, and make new highs by the end of the decade. However, these CBO forecasts should be taken with a grain of salt as they are based on a 10-year yield of only 3.8% (the ten-year average has been higher than that in every decade bar the 2010s and 2020s).

My former student at University of Chicago’s MBA program, Kevin Smith of Crescat Capital, has this charming chart of state and local income tax receipts collapsing.

There is a view the Treasury is already implementing YCC, based on the fact it has been skewing its issuance towards bills and away from coupons. But issuing more bills is simply the easiest and fastest way for the Treasury to replenish its account at the Fed (the TGA). It was run down to almost zero in the lead-up to the debt-ceiling limit, and has now risen to over $500 billion.

This level of bill issuance is not unusual. The Treasury has an implicit target of about 20% for the amount of bills outstanding as a percentage of total debt. As we can see from the chart below, bills have often been more than 20% of debt outstanding over the last 30 years. Moreover, the Treasury announced this week it was raising its coupon-issuance amounts.

According to the stealth YCC thesis, less longer-dated Treasury issuance implicitly caps longer-term yields, but this has not historically been the case. As the chart above shows, the yield curve typically steepens – not flattens – when there is greater bill issuance – the opposite of what is desired by YCC.

We see the same relationship if we look the duration of US government debt outstanding. When the average duration falls – as it would if issuance is skewed toward bills – the yield curve tends to steepen. The current average duration held by the public is consistent with a steeper, not a flatter, yield curve.

This sounds counter-intuitive. If issuance drives yields, then more issuance at the front-end of the curve versus the longer end – equating to a fall in duration – implies the yield curve should flatten.

But the fact the relationship is the other way implies it’s likely that demand is the more dominant driver of yields in the medium term. There is ready-made demand for bills, from MMFs, etc, so when supply increases, demand rises to meet it, suppressing the yield-curve impact.

It’s thus hard to argue the Treasury is engaging in yield curve control. But that does not detract from the rising possibility it will need to be implemented in some shape or form eventually.

Banks and the Fed are reducing their Treasury holdings, while foreigners now collectively own about $5 trillion less USTs – about 10% – than they did in 2021. At the same time the “Treasury put” means large fiscal deficits are likely to become a feature, not a bug. That means inflation is likely to become embedded.

Fiscal profligacy and elevated price growth are a combustible mix and a road to prohibitively high yields via rising term premium. Yield capping thus starts to look like the endgame.

How it’s done is another matter, whether it’s the Fed co-opted to cap yields as it was in WWII, Treasury buybacks, or financial repression, whereby domestic institutions are forced to hold more government debt. Whatever way, at some point yield curve control in the US is becoming increasingly likely – by stealth or otherwise.

But never fear! Janet “Too Low For Too Long Creating Asset Bubbles” Yellen is still US Treasury Secretary.

Case-Shiller National Home Price Index Slows To -0.46% YoY As Fed Withdraws Covid Stimulus SLOWLY (Mortgage Rates UP 151% Under Bidenomics, Taylor Rule Suggests Fed Rate Of 10.42%)

The Case-Shiller home price numbers are out for May. The national home price index is down -0.46% YoY as The Fed slows M2 Money growth into negative growth territory. No doubt Biden (and Karine Jean-Pierre) will take credit for slowing home price growth, although The Federal Reserve slowing monetary stimulus is mostly responsible.

The Fed is still slow walking shrinking its enormous balance sheet. Although The Fed is cranking up their target rate.

The Taylor Rule suggests a 10.42 target rate to cool inflation. They are only half way there!!!

CRE Storm? “Nobody Understands Where Bottom Is” For Commercial Real Estate (Fed STILL Slow To Remove Monetary Stimulus)

Where is the bottom for commercial real estate (CRE)?

Starwood Capital Group’s Barry Sternlicht recently told Bloomberg’s David Rubenstein about the ongoing crisis in the commercial real estate sector, equating it to a severe “Category 5 hurricane“. He cautioned, “It’s sort of a blackout hovering over the entire industry until we get some relief or some understanding of what the Fed’s going to do over the longer term.”

Currently, the biggest problem in the CRE space is sliding office and retail demand in downtown areas. Couple that with high-interest rates, and there’s a disaster lurking for building owners. According to Morgan Stanley, the elephant in the room is a massive debt maturity wall of CRE loans that totals $500 billion in 2024 and $2.5 trillion over the next five years. 

Senior markets editor for Bloomberg, Michael Regan, chatted with John Fish, who is head of the construction firm Suffolk, chair of the Real Estate Roundtable think tank and former chairman of the board of the Federal Reserve Bank of Boston, in the What Goes Up podcast to discuss the biggest problems in the CRE market. 

Fish warned that “capital markets nationally have frozen” and “nobody understands value.” He said, “We can’t evaluate price discovery because very few assets have traded during this period of time. Nobody understands where the bottom is.” 

For a sense of recent price discovery trends, we were the first to point out to readers of a wicked firesale of office towers in the downtown area of Baltimore City: 

As for the overall CRE industry, Goldman Sachs chief credit strategist Lotfi Karoui recently told clients, “The most accurate portrayal of current market conditions with Green Street indicating a 25% year-over-year drop in office property values.” 

Sooooo, Powell and The Fed will likely raise rates this week. And maybe a few more times over the next few months. And The Fed remains defiant about taking away the Covid monetary stimulus.