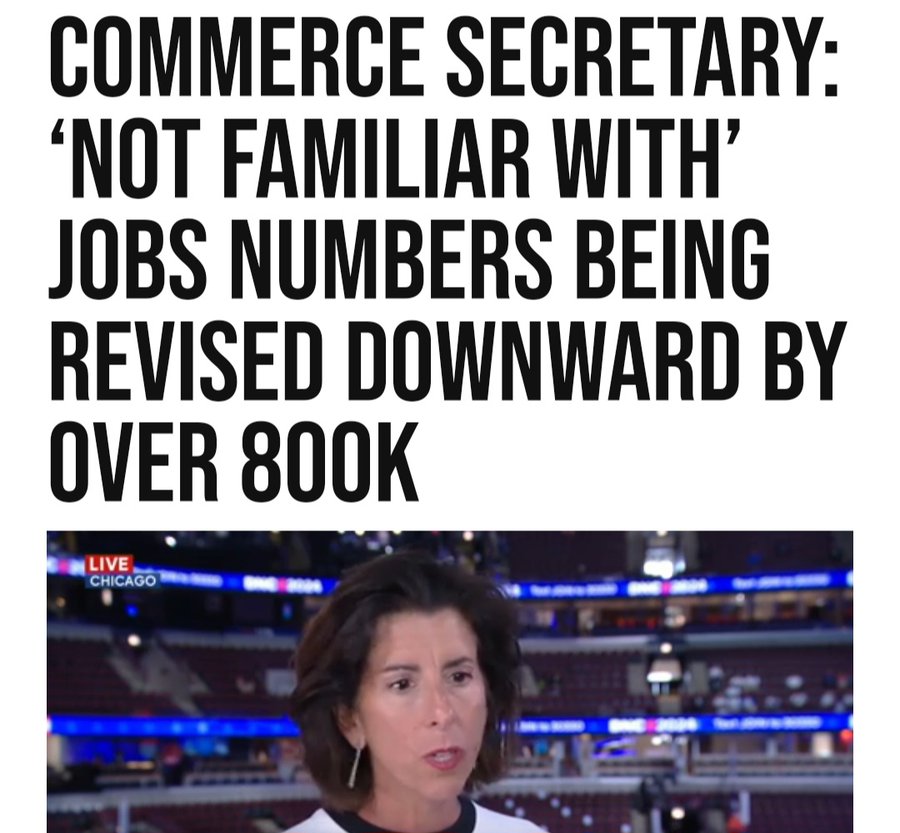
The scary thing about the BLS overstating job gains by Biden/Harris by almost 1 million jobs is that US Commerce Secretary Gina “The Goofball” Raimondo didn’t even know about the Philly Fed report.
Back in March, when most of Wall Street and economists still believed the lies spewed forth by the Biden Bureau of Labor Statistics, which intentionally uses inaccurate, rushed “data” from the Establishment survey which is meant to pad sentiment and make the economy appear far stronger than it is for propaganda purposes (as one can see by the constant monthly downward revisions), we did an in-depth analysis looking at the actual, “uncooked” numbers published by the Philadelphia Fed preview of the annual Quarterly Census of Employment and Wages employment revision, and warned our readers that actual US payrolls are overstated by at least 800,000.
Specifically, we concluded that “the BLS had overstated payrolls by 800,000 through Dec 2023 (and more if one were to extend the data series into 2024)” and added that “it’s truly statistically remarkable how every time the data error is in favor of a stronger, if fake, economy.”
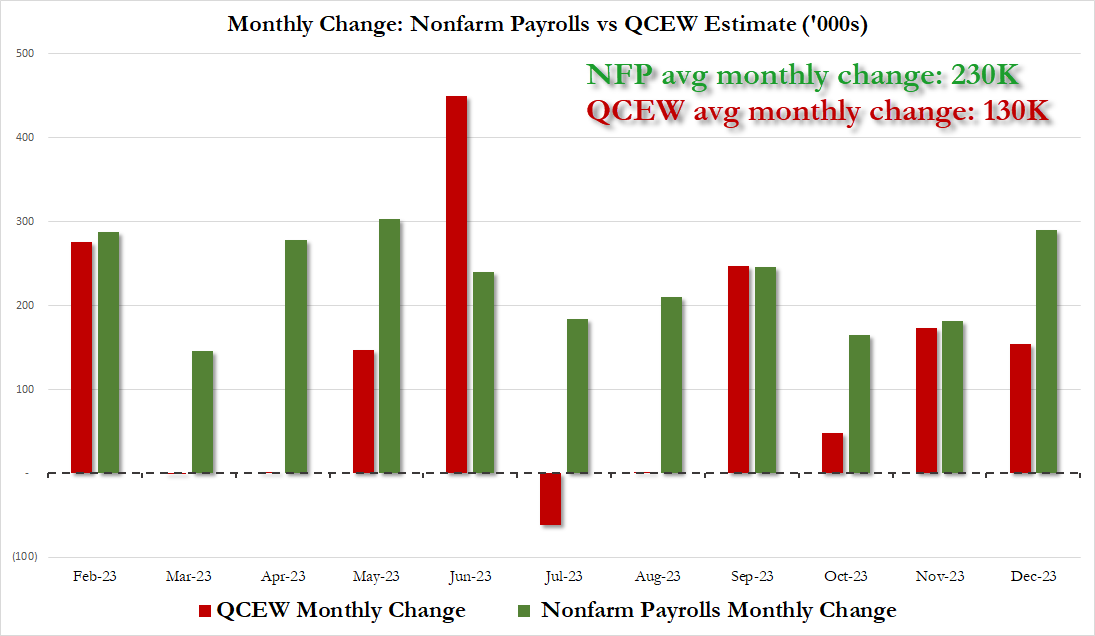
Furthermore, we also noted that the revision “also means that far from the stellar 230K average monthly increase in payrolls in 2023, which the White House would spin time and again as direct evidence of the benefits of Bidenomics, the true average monthly payroll increase in 2023 was only 130K! The full monthly change in payrolls as originally reported by the BLS (in green) and the actual monthly number, as per the QCEW (in red) is shown below.”
This matters because as we reminded our followers this weekend, today at 10am, the BLS would publish its annual nonfarm payrolls benchmark revision where it would unveil as , which it did (with the usual 35 minute delay because that’s the kind of service $35 trillion in debt buys you), and it confirmed that we were right almost to the dot, because as the BLS unveiled in its CES Preliminary Benchmark Announcement, “the preliminary estimate of the benchmark revision indicates an adjustment to March 2024 total nonfarm employment of -818,000 (-0.5 percent)” or just above the 800,000 was said to expect back in March.
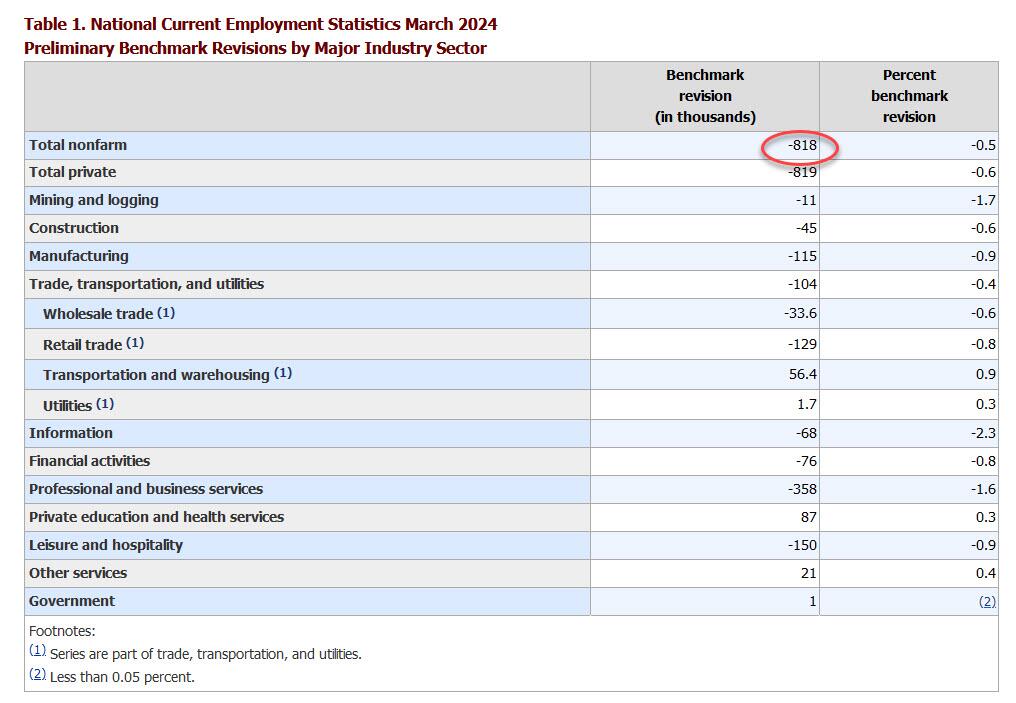
The revision is mainly due to the highest-paying sectors: i.e., professional services -358k, leisure -150k, and manufacturing -115k. Not at all surprising: government was revised +1,000.
As an aside, while the data were scheduled to be released at 10 a.m. in Washington but didn’t appear on the BLS’s website for more than a half hour later. A spokesperson for the agency didn’t answer Bloomberg’s questions as to why the figures were delayed, but we have some pretty good guesses about the panic that gripped the BLS as they realized they needed a green lights from the propaganda ministry before going live with this number.
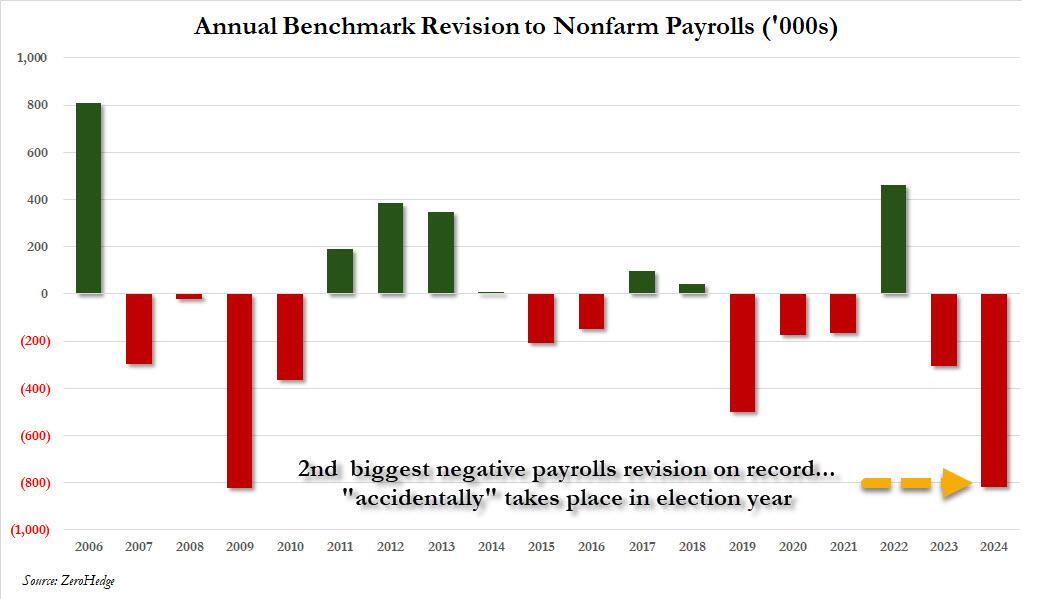
How big is the 818,000 revision in context? As the chart below shows, the 2024 revision was the biggest in the past decade, and the second biggest on record, with just the 824K downward revision in 2009 just (barely) greater.
The revisions confirm that – as we had been warning for much of the past year – the labor market started moderating much sooner than flawed conventional wisdom thought. It wasn’t until earlier this month that markets and economists grew concerned with the release of the July jobs report. That set off alarm bells with a weak pace of hiring and a fourth month of rising unemployment, but other metrics like jobless claims and vacancies have suggested a more moderate slowdown.
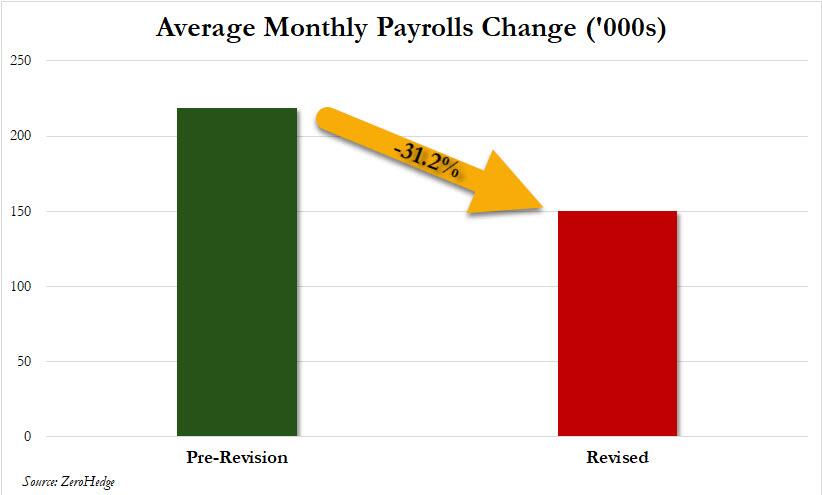
Putting it all together, we now know – as we reported first back in March – that the labor market is, and was, far weaker than conventionally believed. In fact, no less than 800,000 payrolls would end up “missing” when one uses the far more accurate Quarterly Census of Employment and Wages data rather than the BLS’ woefully inaccurate and politically mandated payrolls “data”, and if one looks back the the monthly gains across most of 2023, one gets not 218K jobs added on average every month but rather 150K, a 31% decline. Needless to say, the market would look very different if it had known that effectively all the payroll “beats” of the past year would be deleted!
Of course, none of that paints Bidenomics, or Kamalanomics, or whatever it is now, in a flattering picture, because while one can at least pretend that issuing $1 trillion in debt every 100 days to add 3 million jos per year is somewhat acceptable, learning that that ridiculous amount buys 800,000 jobs less is hardly the endorsement that the White House needs. On the flip side, pretending that the US had added an additional 800,000 jobs in the past year is precisely what Biden, and now, Kamala would have wanted to generate the kind of buzz and momentum that somehow translates into the “greatest economy ever”… at least until it is all revised away as the admin’s lies finally wash away.
What is the implication for the market? Well, as UBS trader Leo He correctly notes, “the Fed is well aware of nonfarm payrolls (establishment survey) overstating the job market, but unemployment rate (household survey) underestimating the job market” and he goes on to quote Governor Bowman’s speech on Tuesday:
“There are also risks that the labor market has not been as strong as the payroll data have been indicating, and it appears that the recent rise in unemployment may be exaggerating the degree of cooling in labor markets. The Q4 Quarterly Census of Employment and Wages (QCEW) report suggests that job gains have been consistently overstated in the establishment survey since March of last year, while the household survey unemployment data have become less accurate as response rates have appreciably declined since the pandemic. The rise in the unemployment rate this year largely reflects weaker hiring, as job searchers entering the labor force are taking longer to find work, and layoffs remain low. It is also likely that some temporary factors contributed to the soft July employment report. The rise in the unemployment rate in July was largely accounted for by workers who are experiencing a temporary layoff and are more likely to be rehired in coming months. Hurricane Beryl also likely contributed to weaker job gains, as the number of workers not working due to bad weather increased significantly last month.”
At the end of the day, all this does is cement the Fed’s 25bps rate cut next month.
As for broader socio-political implications, the reactions are already pouring in with those on the blue side of the spectrum pretending nothing happened, while those on the other side of the aisle raging at what has now become clear propaganda by the highly politicized Department of Labor. To wit, here is RFK, Jr., proposed VP candidate Nicole Shanahan slamming the BLS, and using our data to do so:
The Bureau of Labor Statistics (BLS) has long been used as a tool of propaganda by the executive branch. Here’s how: they distort definitions, manipulate data, exclude discouraged workers, and revise past reports to create narratives that fit the agenda of whichever administration is in power. This skews the actual economic picture and misleads citizens about the true state of our economy. It’s like a game of musical chairs, and neither side wants to be caught standing when the music stops. The Constitution doesn’t grant the government the authority to track unemployment statistics, so why do we even have this agency? Perhaps it’s time to get rid of it. Their $750M budget could surely be put to better use, and private companies already track U.S. unemployment for free. Win-win.
We agree: back in March we concluded our article, which predicted today’s revision with near 100% accuracy, by warning that the staggering size of the revised data “is also why nobody in the mainstream media – which is now nothing more than the PR smokescreen for the Biden puppetmasters, the government and the deep state – will ever mention this report.”
Today it will be more difficult for the propaganda press to ignore it.
At least she should speak in front of a Communist Chinese flag! Her true master.


You must be logged in to post a comment.