“The Congressional Budget Office and the staff of the Joint Committee on Taxation project that a version of the bill modified as you have specified would increase the deficit by $3.0 trillion over the 2022–2031 period.”
The Penn-Wharton Budget Model estimates that — if Congress follows White House policy to make most provisions permanent — then Build Back Better will reduce the long-term GDP by 2.8 percent, reduce wages by 1.5 percent, and reduce work hours by 1.3 percent. The only thing it will expand is government debt, by 25 percent.
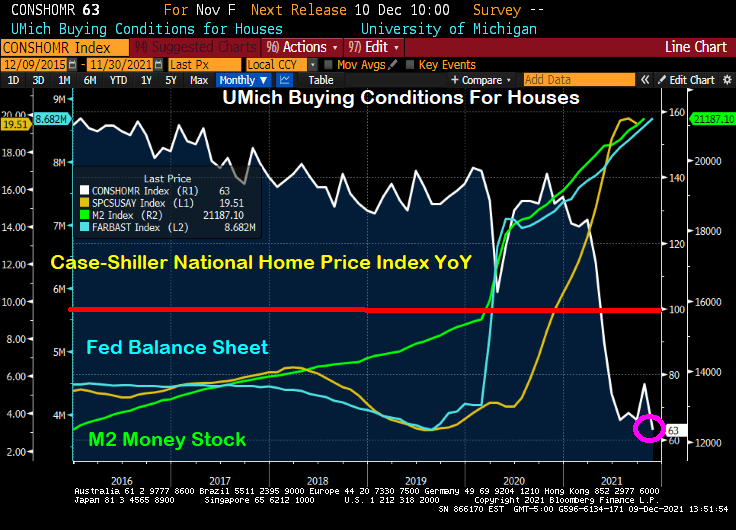
Just look at this chart of the University of Michigan Buying Conditions For Houses index. It was positive (meaning above 100) until shortly after COVID struck and The Federal Reserve rode to the rescue. National home price growth was already at 4.57% YoY in March 2020, then ballooned to 19.51% YoY at the last reading.
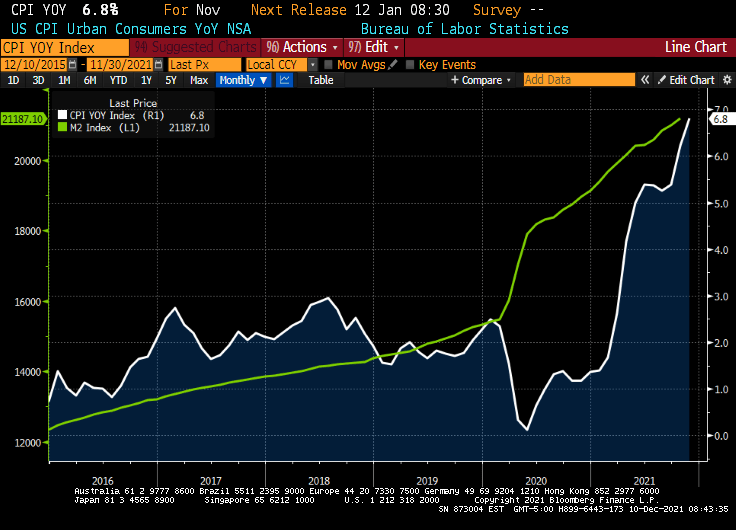
Here is the same chart with the broader M2 Money stock and The Fed’s Balance sheet. Same results, just not as dramatic as M1.
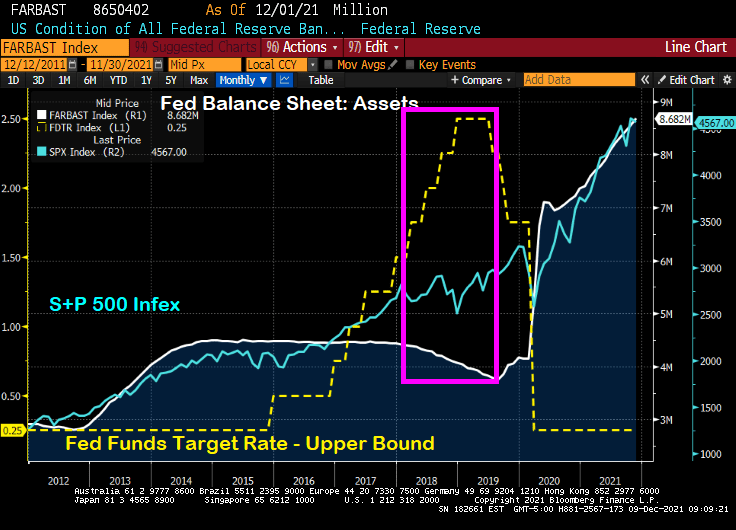
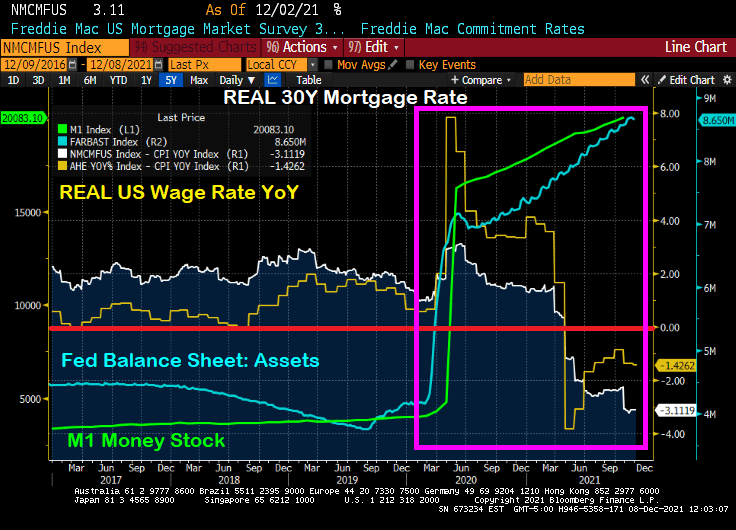
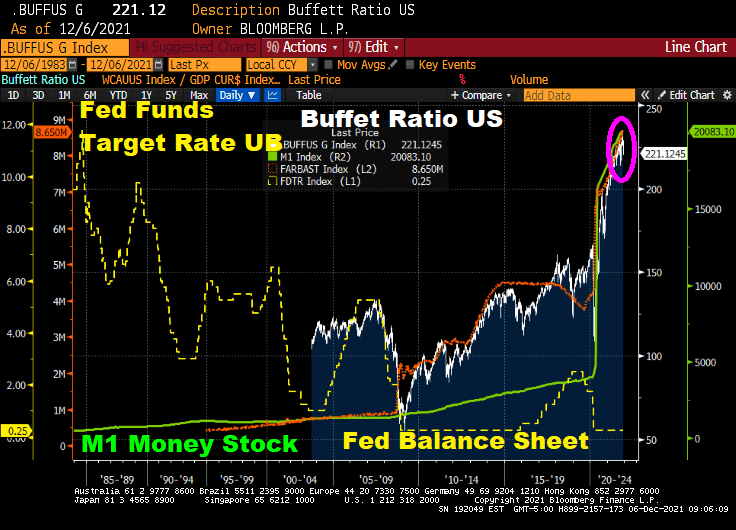
We will soon find out if The Federal Reserve will announce a rate hike or taper news. They are likely to confirm tapering, particularly if they believe that tapering won’t roil markets. After all, then Fed Chair Janet Yellen and the FOMC decided to let the Fed’s balance sheet taper (white line) while, at the same time, increasing the Fed’s target rate (yellow line). The S&P 500 index rose 9.5% over the taper/rate increase period of 12/29/2017 to 8/30/2019.
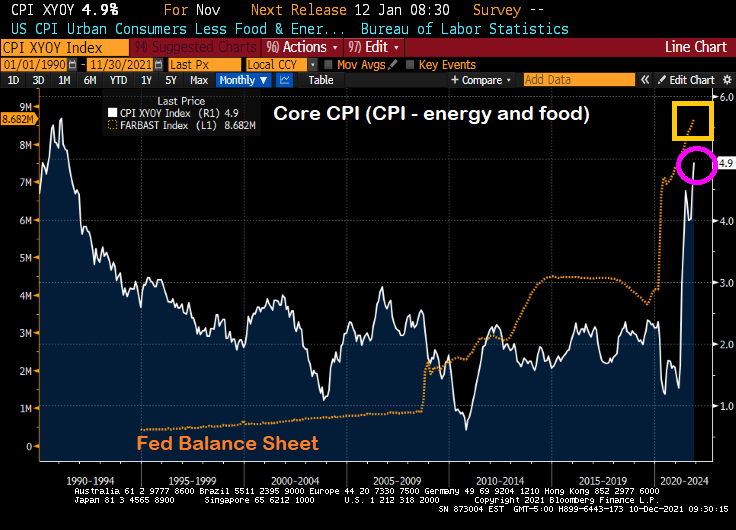
But since Stimulypto (2/28/2020 to 11/30/2021), the Fed’s balance sheet doubled+ from $4,158,637 to $8,681,771. And The Fed Funds Target Rate (UB) immediately fell from 1.75% in February 2020 to 0.25% in March 2020 … and has stayed there ever since. The S&P 500 index rose 54.6% over this Stimulypto period.
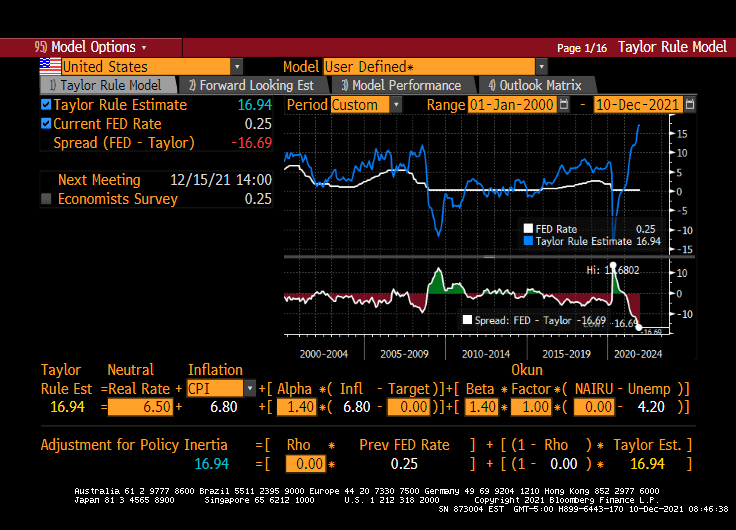
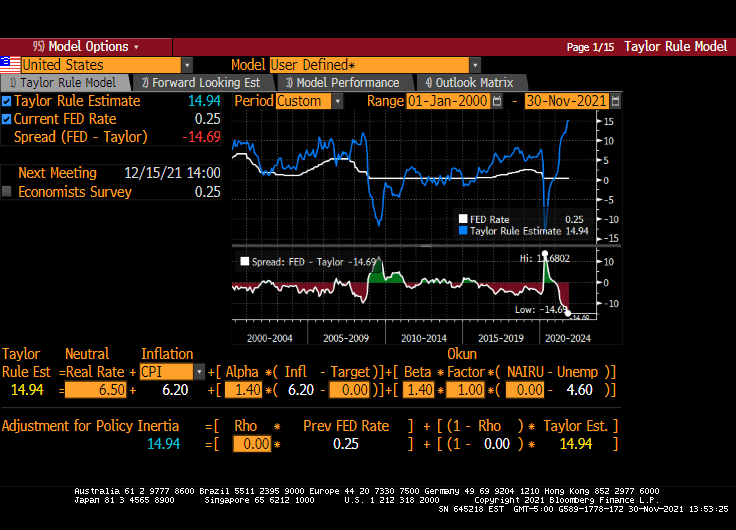
But The Fed’s upcoming decision on December 15, 2021 may be a Yellen-pivot (taper balance sheet, but raise The Fed Funds Target rate). But, then again, maybe not. The Fed is getting really bad about forward guidance and choose instead to surprise us. Hence, this is why an a-political rule is preferred (such as the Taylor Rule).
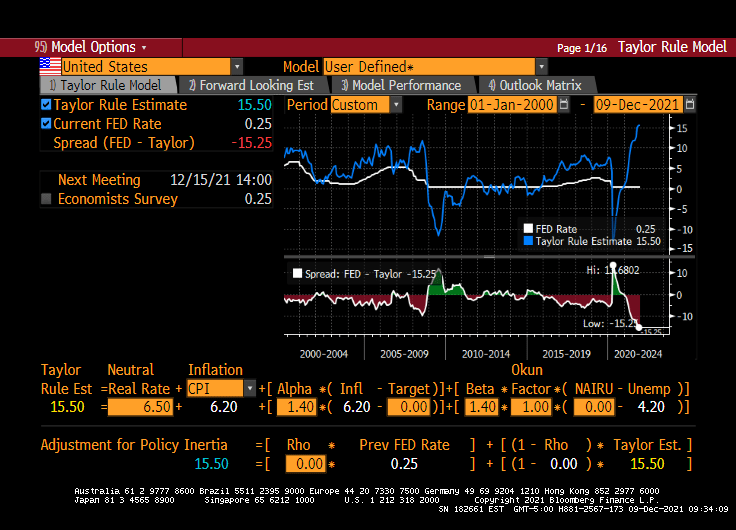
Unfortunately, the Taylor Rule infers a Fed Funds Target rate of 15.50% (using CPI YoY running at 6.20% YoY. If The Fed raises their target rate by 25-50 basis points at the December 15th meeting, color me surprised.
So, the Powell Pivot may just be the Yellen Pivot after all.
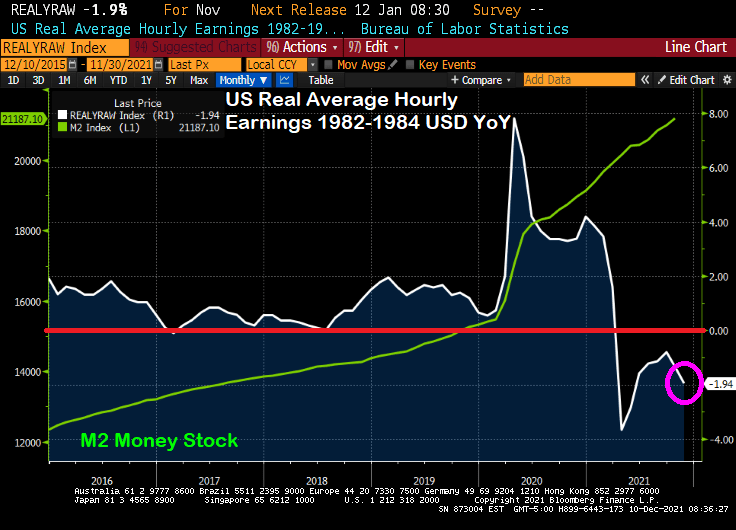
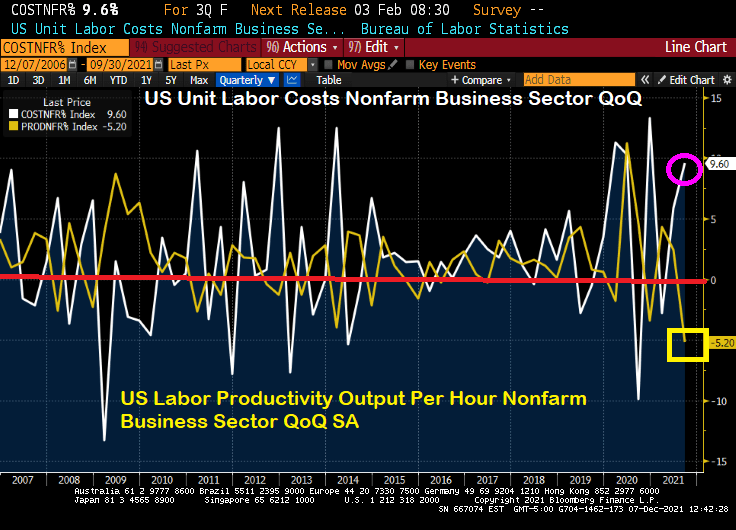
If this what the Biden Administration had in mind? Soaring labor costs at the same time that labor productivity is falling to its lowest level since 1960?
Powell and the Gang’s monetary approach doesn’t seem to be working for the labor market …
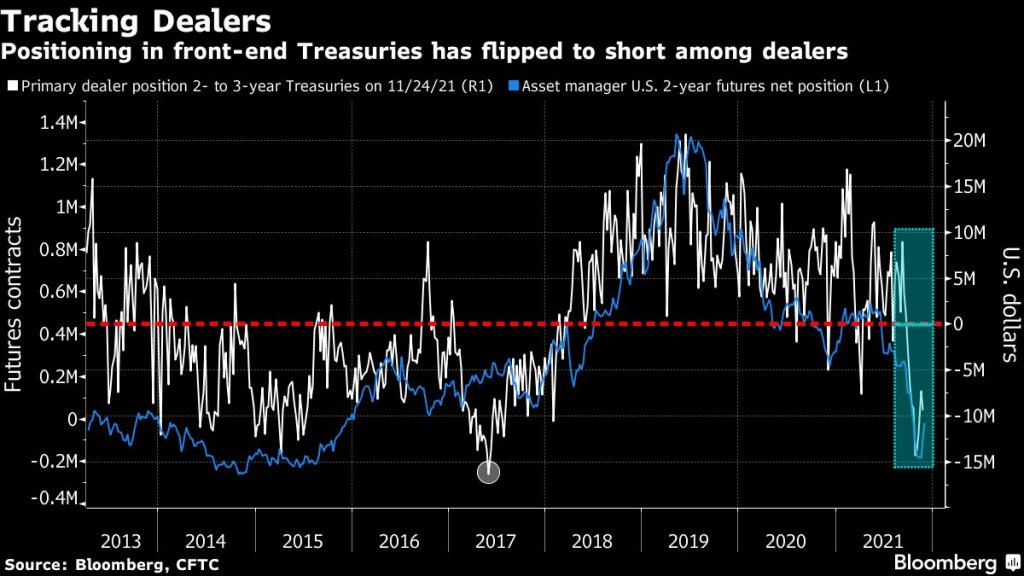
(Bloomberg) — The recent drop in primary-dealer holdings of front-end Treasuries is another warning of potential market dislocation heading into the year-end liquidity vacuum.
As of Nov. 24, primary dealers — which are mostly the large banks — were on the whole betting against two- to three-year Treasuries rather than buying. They had net short positions of just over $9 million, near the most bearish levels since 2017, signaling a pullback by buyers that provide crucial liquidity for older Treasury issues.
The positioning in the front-end of the curve “suggest less demand from the dealer community to fund off-the-run long positions,” Barclays strategists Anshul Pradhan and Andres Mok say in a Dec. 3 note. Off-the-run Treasuries are notes and bonds created in past years and traded less frequently than the newest issues; they’re the biggest part of the market and make up most of the Federal Reserve’s daily asset purchases, which are being scaled back.
Short positioning increased on a relative basis as a result, “which may also have crowded demand to borrow particular issues over others,” the analysts wrote.
Those forces together could contribute to an increase in market dislocations.
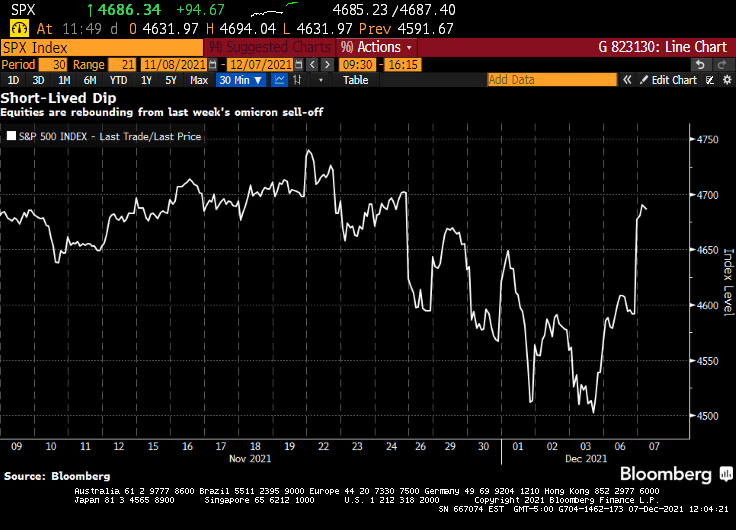
Jerome Powell’s hawkish pivot shocked financial markets. A week later, stocks are higher. The S&P 500 staged its biggest rally since March to wipe out losses from the past week. The speculative fringe that was a smoldering wreck Friday was soaring Tuesday. An index of meme stocks rallied more than 4%, while one composed of airlines added 1.6%. A gauge of newly public companies advanced more than 4%, SPACs jumped more than 2% and even cryptocurrencies rallied, with Bitcoin powering back above $51,000.
It’s a stunning about-face for risk assets that went into a tail spin after the Federal Reserve chair suggested he favored accelerating the removal of monetary support. What follows are takes from market-watchers on why the market is looking past the Fed’s potential change in policy.
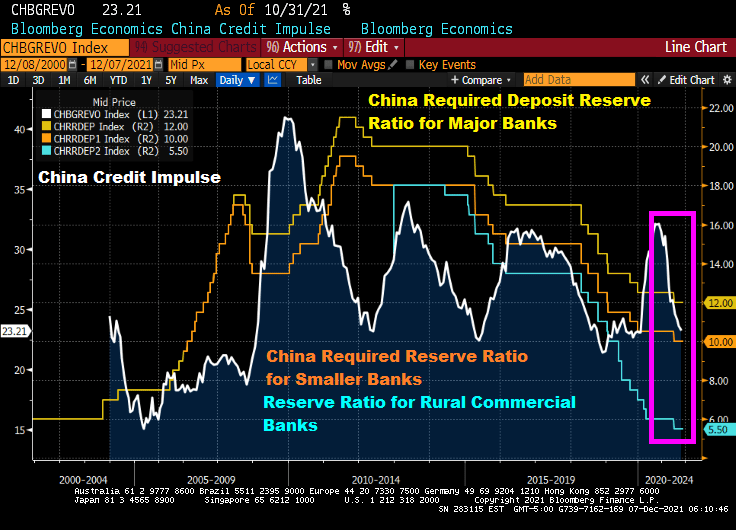
China cut the amount of cash most banks must hold in reserve, acting to counter the economic slowdown in a move that puts the central bank on a different policy path than many of its peers.
The People’s Bank of China will reduce the reserve requirement ratio by 0.5 percentage point for most banks on Dec. 15, releasing 1.2 trillion yuan (US$188 billion) of liquidity, according to a statement published Monday.
The reduction was signaled by Premier Li Keqiang last week when he said that authorities would cut the RRR at an appropriate time to help smaller companies, and is the second reduction this year.
The decision comes after recent data showed the economy and industry stabilizing, although Beijing’s tightening curbs on the property market have led to a slump in construction and worsened a liquidity crisis at developer China Evergrande Group and other real estate firms.
Evergrande’s ADR is collapsing (now 5.975) along with Evergrande debt falling to 23.12 (versus 100 par).
China’s credit impulse has nosedived (see pink box) as the PBOC drops bank reserve ratios to lowest level since 2007 in an effort to float the boat. Will the PBOC drop in reserve ratios stem the tide? Or is it peasant magic?
As The Federal Reserve tries to drain-off the extraordinary growth in its balance sheet since COVID without raising its target rate (good luck with that!), it is time to appraise where we are sitting. First, liquidity.
(Bloomberg) Buying and selling large quantities of U.S. government debt without substantially moving the market is about the hardest it’s been since the pandemic sent markets reeling in March 2020. Volatility has jumped, failed trades have increased — and Wall Street analysts warn that the Federal Reserve’s exit from bond-buying is set to make matters worse.
When markets seized up last year, liquidity in most Treasuries vanished, forcing the Fed to embark on massive asset purchases and other measures to avert a full meltdown. Now, the U.S. central bank is scaling back that buying, which has targeted the least-liquid Treasuries, and is poised to quicken the wind-down. At the same time, new government borrowing is ebbing, with the combination setting the stage for more fireworks.
OK, liquidity isn’t as bad as COVID and March 2020, but it is near the highest level since March 2020. The question is … will the numerous asset bubbles around the globe burstLet’s look at the ongoing saga of Chinese conglomerate Evergrande (mainly known as a large real estate developer). Their 8.25% bond has plunged to $23.481 on speculation of a catastrophic default on their bond payments. Then we have Invesco’s Golden Dragon China ETF (measuring a diversified market cap of US-listed companies headquartered or incorporated in China & derive a majority of their revenues from the People’s Republic of China). This ETF has crashed and burned back to pre-COVID (and Stimulytpo) levels.
Speaking of cracks, how will the Buffett Ratio US react to a reduction in The Fed’s balance sheet (orange line) and M1 and M2 Money stock? Given that the Fed Funds target rate is WAY below where it should be (according to the Taylor Rule).
As I mentioned yesterday, the Shiller CAPE ratio is at its highest level since the Dot.com debacle of 2000. How will the Shiller CAPE ratio react to The Fed’s tapering?
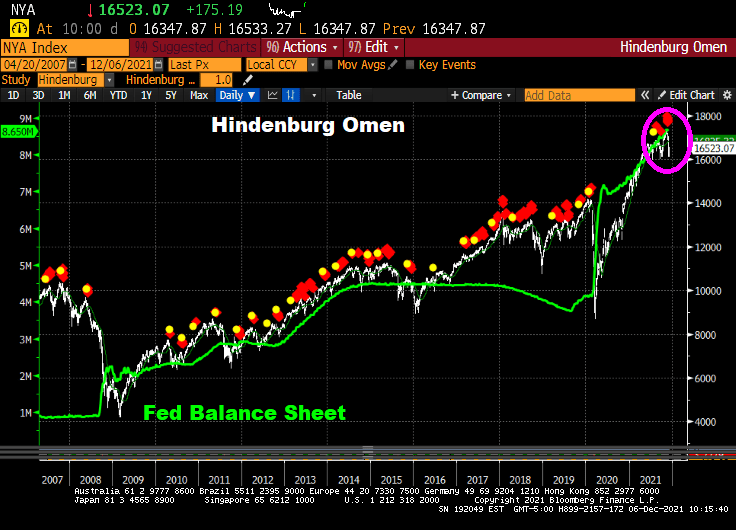
Even the Hinderburg Omen is flashing red … again.
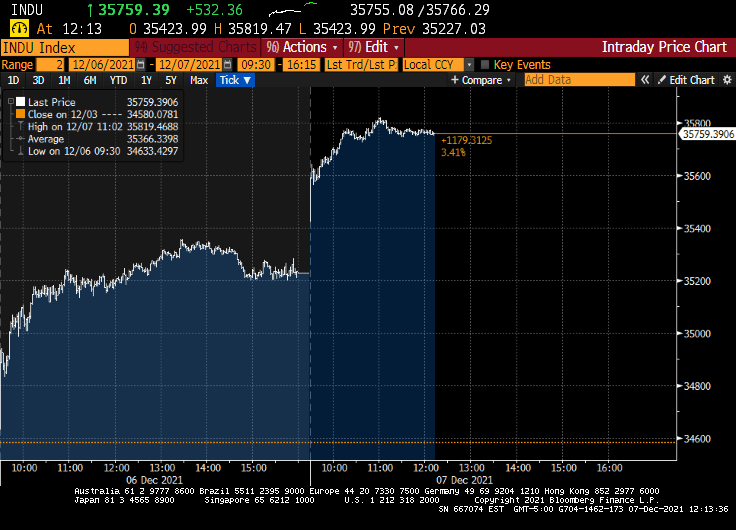
Now, the Dow is up 600 points today, primarily on the news that the Omicron Variant is about as harmful as the common cold.
A major shift is underway at the Federal Reserve to begin to remove the central bank’s massive pandemic easing policies, and could see it hike rates sooner than is priced in by markets.
Comments by Fed officials suggest the central bank is likely to decide to double the pace of its taper to $30 billion a month at its December meeting next week. Initial discussions could also begin as soon as the December meeting about when to raise interest rates and by how much next year with Fed officials set to submit a fresh round of economic forecasts and projections for the fed funds rate.
There is no consensus yet on when to begin hikes, but it’s clear that the faster taper is designed to give the Fed flexibility to raise rates as soon as the spring. The markets do not appear to expect the first rate hike until the summer of 2022.
Uh-huh. Let’s see what happens when and if The Fed starts to taper. Is economic growth so strong that it can continue without Federal Stiumulypto? THAT is the right question.
Look at the above charts and tell me if The Fed will actually raise their target rate more than twice. Despite the Taylor Rule suggest a target rate of 15.50% to cool inflation.
Calamity Jay Powell is no longer mentioning “transitory” when it comes to inflation, but does Powell and the FOMC have the moxie to ACTUALLY raise rates more than a smidge??
(Bloomberg) — Team Transitory is throwing in the towel.
In a clear sign that the Federal Reserve is shifting to tighter monetary policy, Jerome Powell — who’s spent months arguing that the pandemic surge in inflation was largely due to transitory forces — told Congress on Tuesday that it’s “probably a good time to retire that word.”
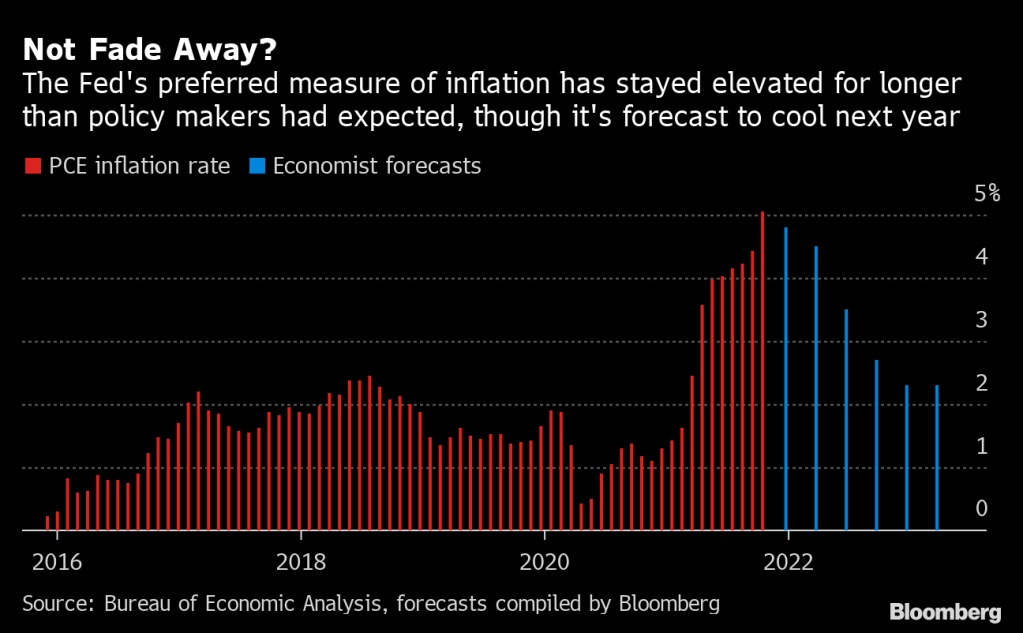
The Fed chair, tapped last week for another four-year term, still thinks inflation will ebb next year.
But in testimony before the Senate Banking Committee, he acknowledged that it’s proving more powerful and persistent than expected, and said the Fed will consider ending its asset purchases earlier than planned.
A number of economists are forecasting cooling inflation next year, which gives Powell an excuse to NOT raise rates, other than just a bit.
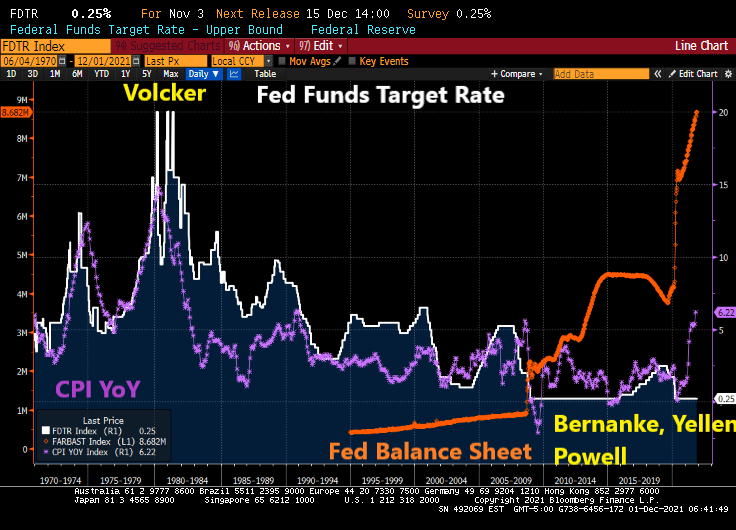
For a little history, inflation was rampant in the 1970s and early 1980s. Fed Chair Paul Volcker, all 6’7 of him, raised the Fed Funds target rate (white line) to 20% on several occasions. The result? Inflation cooled from over 14% in 1980 to 2.46% by 1983. But since 2008, Fed Chairs Bernanke, Yellen and Powell have been the ANTI-Volckers … keeping the Fed Funds Target rate near zero for the the most part and adopted their gut-wrenching quantitative easing programs that are still here today.
Of course, Powell could do what Volcker did (and the Taylor Rule suggests) and raise their target rate to 15% to cool inflation.
But does Powell and the other FOMC members have the moxie to really cool inflation? Frankly, no. Powell until yesterday played the TRANSITORY card and still believes that inflation will cool by 2022.
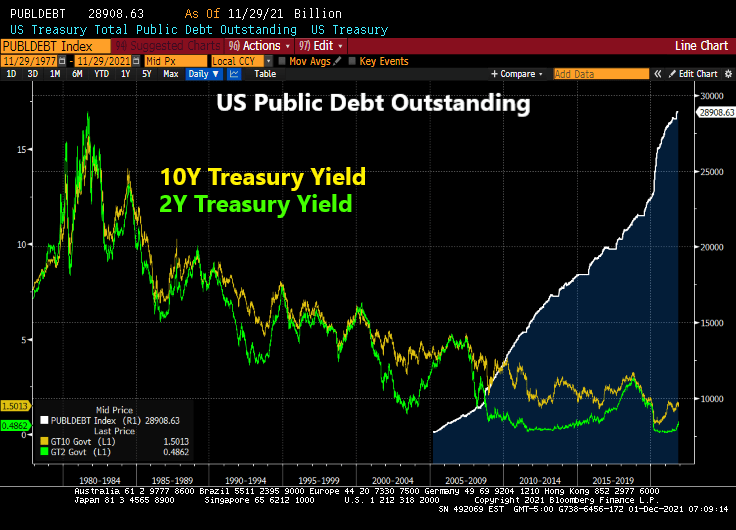
True, the Federal government has binged on borrowing (up 172% since January 2009). And with Biden and Congress trying to spend trillions more (much of which will be added to the public debt rolls, so increasing interest rates ala Volcker is very problematic.
And then there is always the good ‘ole excuse not to raise rates if needed. Other than admitting that The Fed is monetizing Federal government spending to which there is no end in sight.
I have written numerous times about nothing has been the same since the housing bubble burst and ensuing financial crisis of 2008. The crisis led to bank bailouts (TARP) and banking legislation (Dodd-Frank) giving The Federal Reserve even more power. And then the COVID lockdowns led to even MORE power for The Fed. And a horrid decline in money velocity (the ability of printing money to increase economic growth … or GDP).
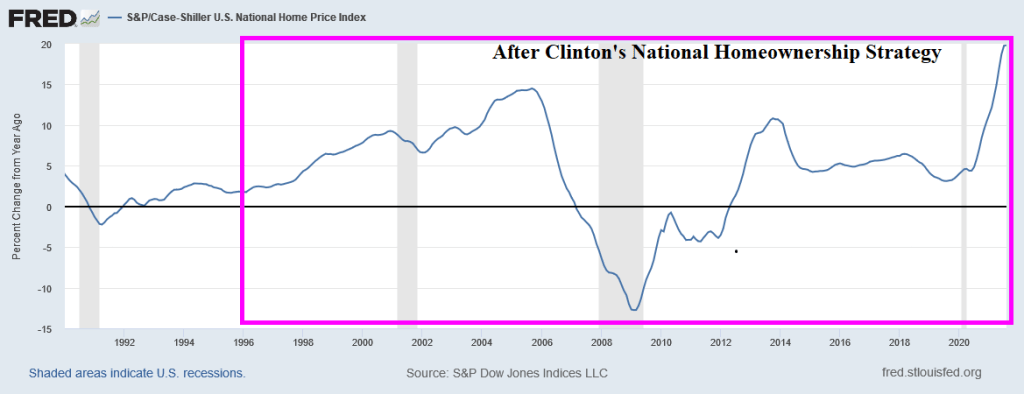
But let’s take one step backwards. One the causes of the housing bubble that burst was President Clinton’s infamous National Homeownership Strategy that encouraged “partners” with the Federal government to soften underwriting standards for mortgage lending, particularly for minority households. The intent was to increase the homeownership rate in the US and it worked! Too well. Along with increasing the homeownership rate came rising home prices, culminating with home price growth reaching 14.5% YoY in September 2005. Only to start slowing to a crash.
Of course, the housing bubble was associated with no/low documentation and subprime mortgage lending. But the relaxing of underwriting standards by the National Homeownership Strategy helped fuel the no/low doc and subprime lending crisis. But weakening underwriting standards to increase homeownership rates is a dangerous strategy.
Note the surge in M1 Money Velocity (GDP/M1) starting in 1994. M1 Velocity grew until Q4 2007, then crashed along with home prices. The second and more sudden crash in M1 Velocity occurred with the COVID outbreak in March 2020 and the ensuing economic lockdowns and the intervention of The Federal Reserve in terms of money printing. M1 Money surged 173% from October 2008 to February 2020 and then another 369% from March 2020 to today. THAT is a Fed Storm Surge!!
M2, the broader definition of money, has not grown as rapidly as M1, but it still grew at an alarming rate. Atlanta Fed President Raphael Bostic blamed inflation on COVID but not The Fed’s insane money printing or government lockdowns. C’mon man!
Finally, the banking crisis (and TARP bailouts) along with COVID have made consumer purchasing power of King Dollar even worse.
Be careful of government strategies to make housing more “affordable” because they seem to make housing more expensive and can help crash the financial system.


You must be logged in to post a comment.