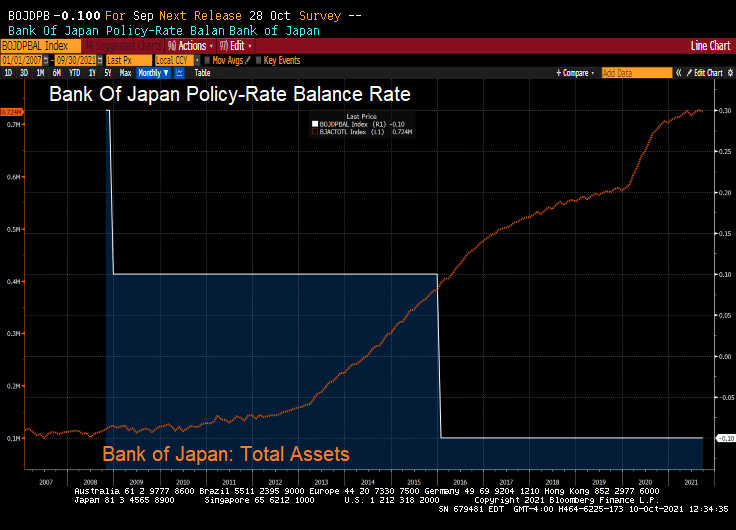
What’s left of it is that the BoJ (and Bank of Japan Governor Haruhiko Kuroda) now holds about half of the huge pile of the central government’s debt. With their target rate at -0.10% and a gargantuan balance sheet, what could go wrong?
But BOJ’s QE has ended. The BoJ’s overall assets stopped growing, and its holdings of government bonds have started to decline.
As of the BoJ’s balance sheet dated September 30, released on Thursday, total assets declined to a still monstrous ¥724 trillion ($6.4 trillion), below where it had been in May 2021.
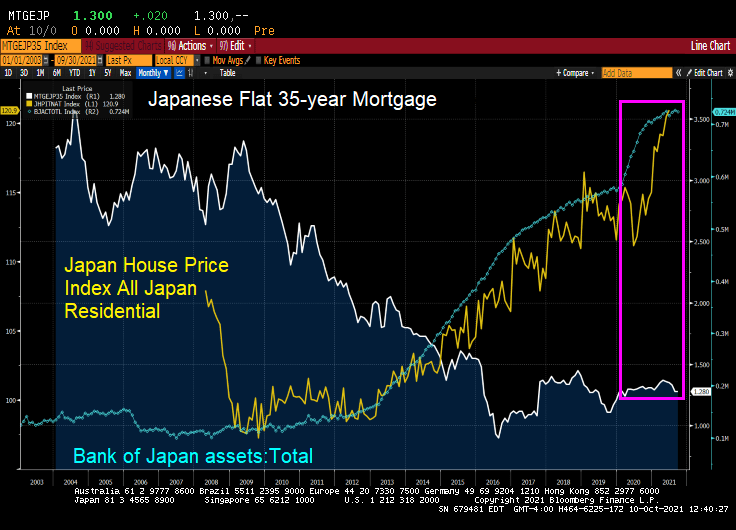
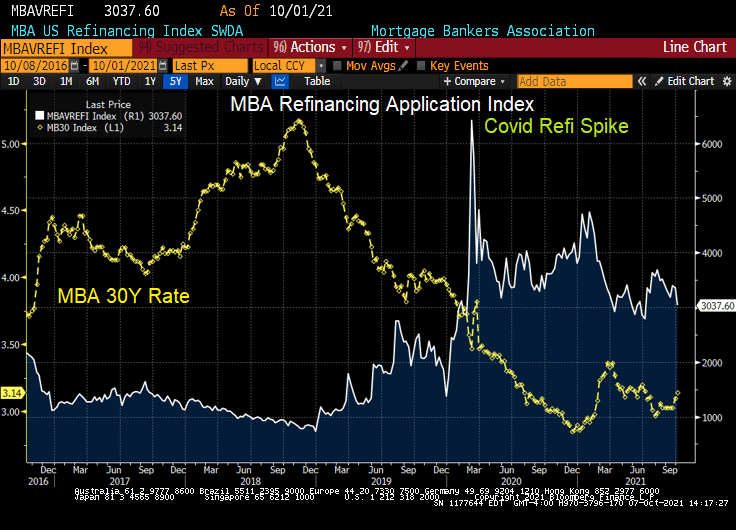
But look at Japanese home prices with the growth of the BOJ’s balance sheet and general decline in mortgage rates. Like the USA, there was a balance sheet spike associated with Covid and a resulting spike in home prices.
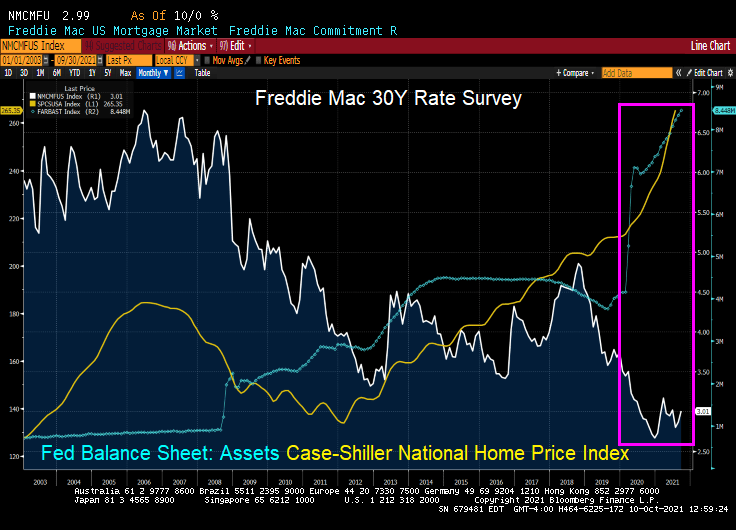
The USA? We also saw a surge in home prices following The Fed’s monetary “stimulypto.”
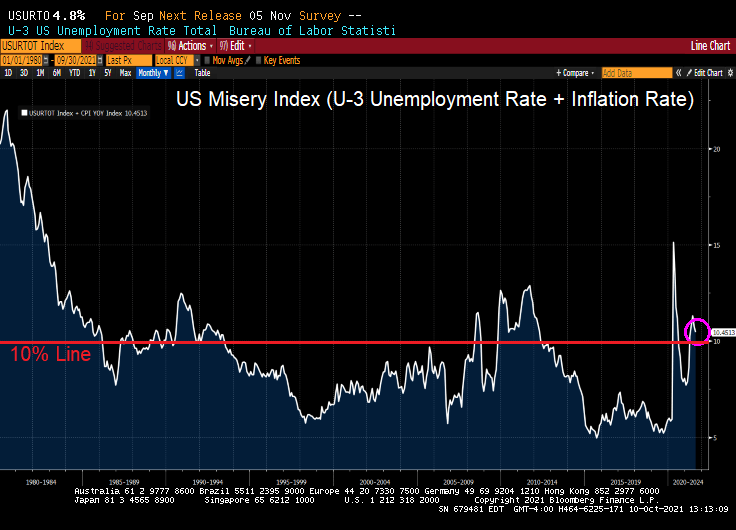
Bear in my that the US Misery Index is above 10% (U-3 unemployment + inflation).
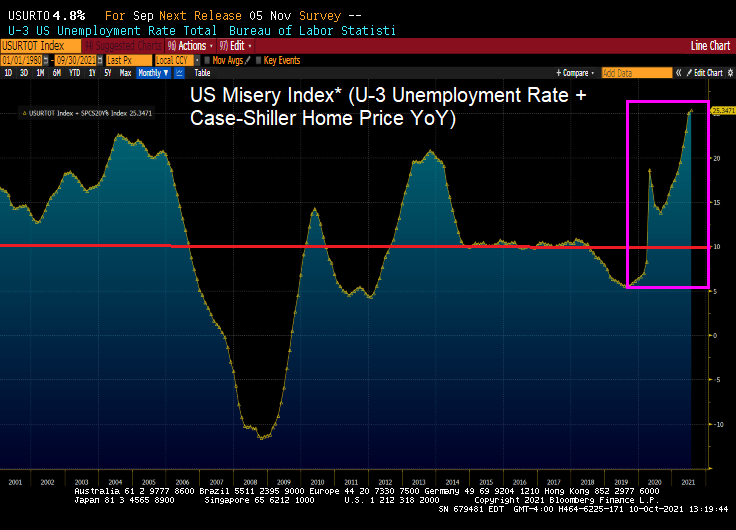
And if I define the US Misery Index as U-3 unemployment + home price growth, we can see we are at record misery rates. Miserable for households that don’t own a home or are trying to move to a higher housing price area).
It was great to be a “Master of the Universe” (Treasury and MBS trader) since October 1981 when the US 10Y Treasury yield peaked at 15.84% and mortgage rates peaked at 18.63%. Treasury and mortgage rates have generally fallen ever since. But what happens if Treasury and mortgage rates rise?
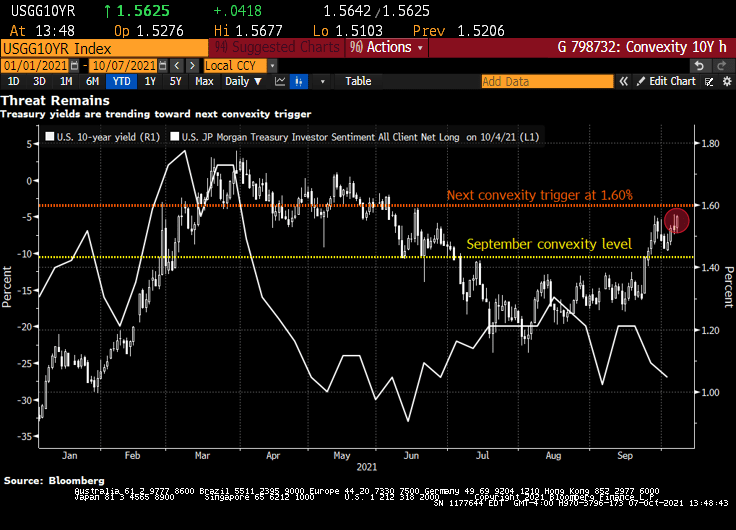
Bond investors are piling back into short positions, motivated not only by the specter of inflation but also by the risk that yields are approaching levels that will unleash a wave of new selling by convexity hedgers.
That level is around 1.60% in the U.S. 10-year Treasury yield, less than 10 basis points from its current mark, according to Brean Capital’s head of fixed income strategy, Scott Buchta. It’s the mid-point of “a key threshold” between 1.40% to 1.80%, an area “most critical from a convexity hedging point of view.”
Convexity hedging involves shedding U.S. interest-rate risk to protect the value of mortgage-backed securities as yields rise, slowing expected prepayment rates.
It’s already begun to pick up as yields stretched past the 1.40% level. Another wave is expected at around 1.6% — a point of “maximum negative convexity” in agency MBS, “where 25bp rallies and sell-offs should have an equal effect on convexity-related buying and selling,” Buchta says.
Signs that short positions are accumulating include Societe Generale’s “Trend Indicator.” Among its 10 newest trades are short positions in Japanese 10-year debt, German 5-year debt futures, U.K. 10-year gilts, U.K. short sterling and U.S. 2- and 5-year notes. Meanwhile, CFTC positioning data for U.S. Treasury futures show asset managers flipped to net short in 10-year note contracts in the process of dumping the equivalent of $23 million per basis point of cash Treasuries over the past week. Hedge-fund shorts also remain elevated in the long-end of the curve, as measured by net positions in Bond and Ultra Bond futures.
“Bond-bearish impulses remain in place,” says Citigroup Inc. strategist Bill O’Donnell in a note, citing tactical and medium-term set-ups. Traders should be aware of short-covering rallies in the meantime, however, he says.
“Potentially extreme short-term positioning and sentiment set-ups could easily allow for a counter-trend correction under the right conditions,” he said.
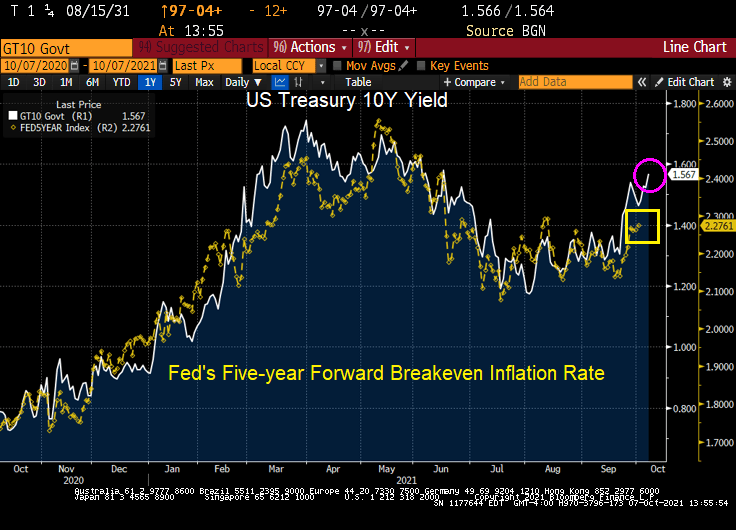
U.S. 10-year yields topped at 1.57% this week, the cheapest level since June, spurring the breakeven inflation rate for 10-year TIPS to 2.51%, the highest since May. Friday’s September jobs report could add fuel to this inflationary fire, rewarding bond shorts.
Here is a chart of the rising 10Y Treasury yield against The Fed’s 5Y forward breakeven rate.
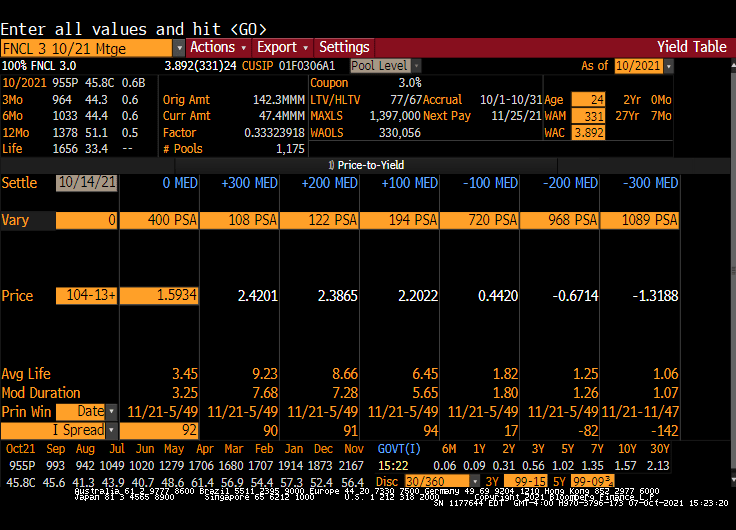
Here is a Fannie Mae 3% coupon MBS. Note the rise in Modified Duration with an increase in interest rates.
Well, Janet, we are headed there anyway with GDP crashing to a measly 1.33%.
The fear of not approving a debt ceiling increase (laughable since Democrats can do it on their own) has caused there to be a “little dipper” in the US Treasury actives curve. Meaning that the 1-month T-bill yield is higher than the 1-year T-bill yield.
The culprits? Declining auto sales, manufacturing, etc.
I have discussed soaring prices since Biden’s election (food, energy, housing, rent, etc). But another soaring price component is shipping costs. Up 315% since mid-February.
While Trump’s slogan was “Make American Great Again”, Biden and The Fed’s slogan should be “Make America Far More Expensive For The Middle Class.” But that won’t fit on a bumper sticker.
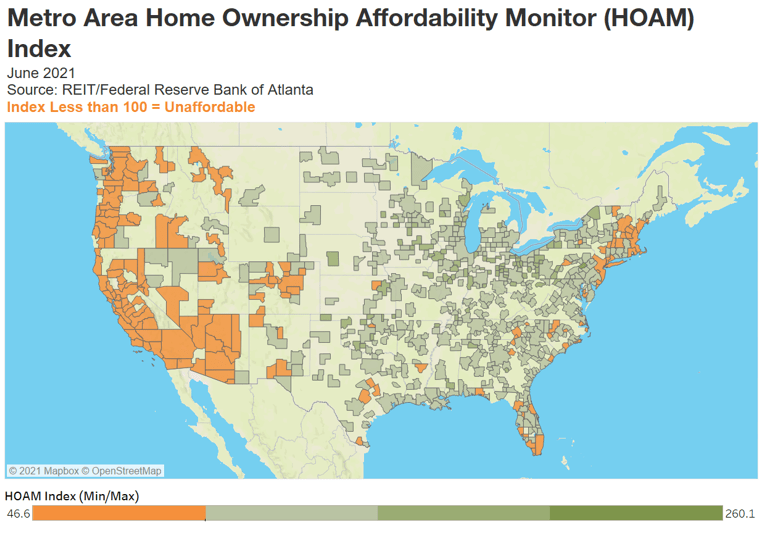
The national HOAM index stood at 92.2 in June, its lowest level since 2008.
National housing affordability fell 11.9 percent in June, the sharpest drop since 2014.
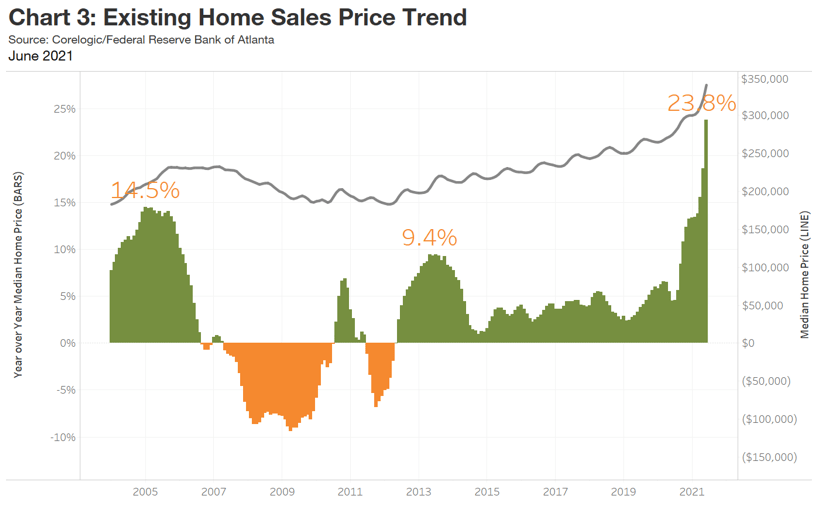
Home sale prices were up 23.8 percent over the past year.
On average, a median-income household would need to spend 32.6 percent of its annual earnings to own a median-priced home.
Although demand for housing remains strong, steadily declining affordability is beginning to affect buying decisions.
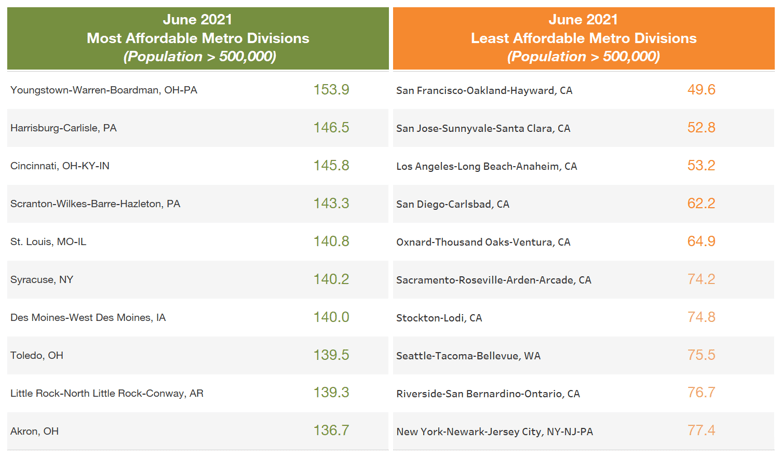
The latest reading of an Atlanta Fed measure and US housing trends show home ownership is becoming out of reach for many buyers and resistance to higher prices is building. More than 80 percent of US metro areas had a drop in affordability.
Where is housing most and least affordable?
ddd
Of course, the one chart that The Fed never includes is home price growth and Fed monetary policy.
So, if The Fed is so concerned with median-income households being priced out of housing markets, why are the still sticking with their unorthodox monetary policies?
Since Joe Biden took office in January 2021, we have seen several actions from The White House. First, was the cancellation of the Keystone Pipeline (making the US more energy dependent on others). Second, Biden waived US sanctions on Russian pipeline to Germany. Big winner? Russia. Big loser? US consumers trying to heat their homes.
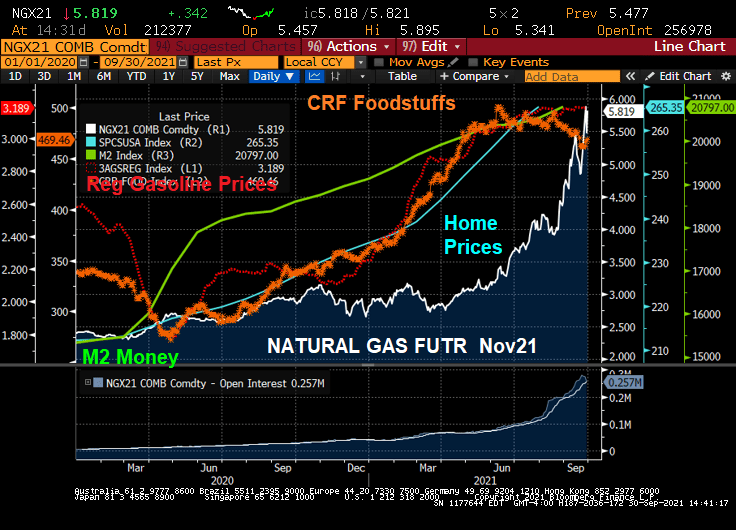
Here is a chart of natural gas prices since Biden took office in January.
Biden reminds me of Dwight Schrute from the TV show “The Office” as he loves to punish people. In this case, families trying to heat their home. And have his own currency, Schrute Bucks.
Perhaps The Federal Reserve should rename the US Dollar as “Biden Bucks.”
Can you say “All the king’s horses and all the king’s men ..” Or “All The Fed’s stimulus and all of Biden’s jobs bills ..”
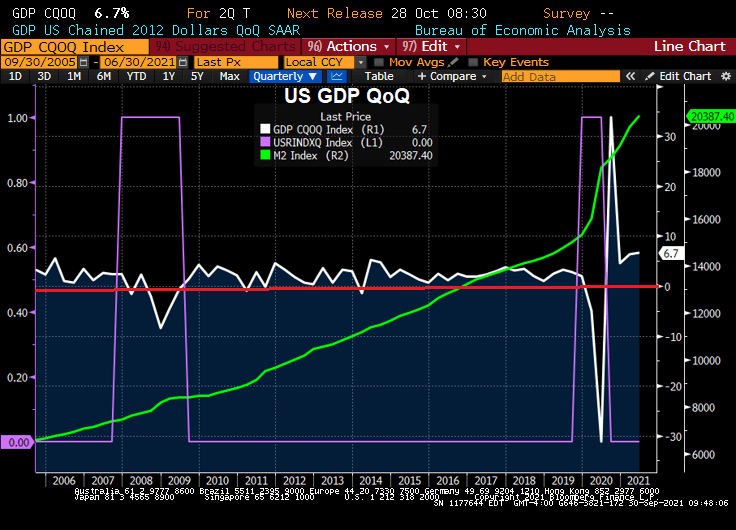
Yes, the Atlanta Fed’s GDPNow Q3 tracker slumped to 2.3% despite the massive stimulus coming from The Federal Reserve and the Biden Administration. Down from 13.7% GDP growth as of 5/5/2021.
Only a multi-millionaire like Powell would call it frustrating. Most US consumers would call it “devastating.”
Look at home prices, natural gas, gasoline and food prices since The Fed turned on the money pump to combat the Covid shutdown by government. Well, at least food price growth has slowed, but that is more that offset by natural gas (heating) costs skyrocketing.
Rent? That too has zoomed upwards, although Powell likely isn’t worried about his rent rising by 11.5%.
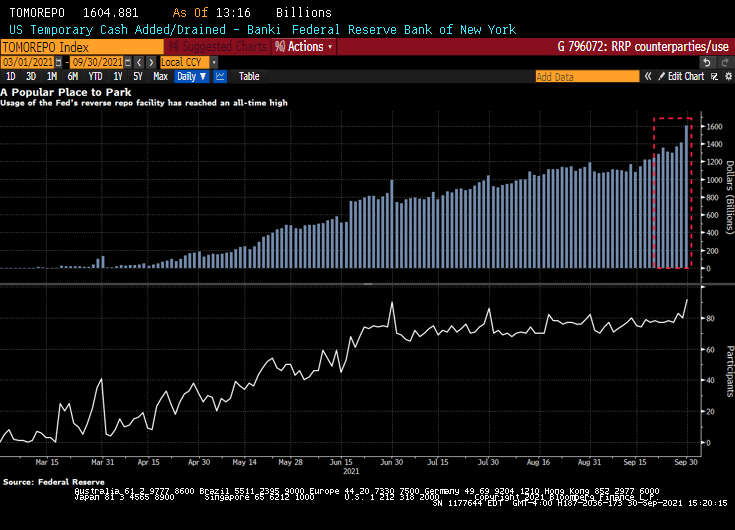
I wonder if Powell is frustrated by banks parking their money at the Fed’s reverse repo facility? Ninety-two participants on Thursday placed a total of $1.605 trillion at the Federal Reserve’s overnight reverse repurchase agreement facility, in which counterparties like money-market funds can place cash with the central bank. The previous record, set the day before, was $1.416 trillion. Thursday’s leap was the biggest one-day increase in usage since mid-June.
Biden blames “greed” for rising prices, Powell is “frustrated” by bottlenecks. But why pump trillions into the economy when you know there are bottlenecks? Or meatpacking firms are “greedy”?


You must be logged in to post a comment.