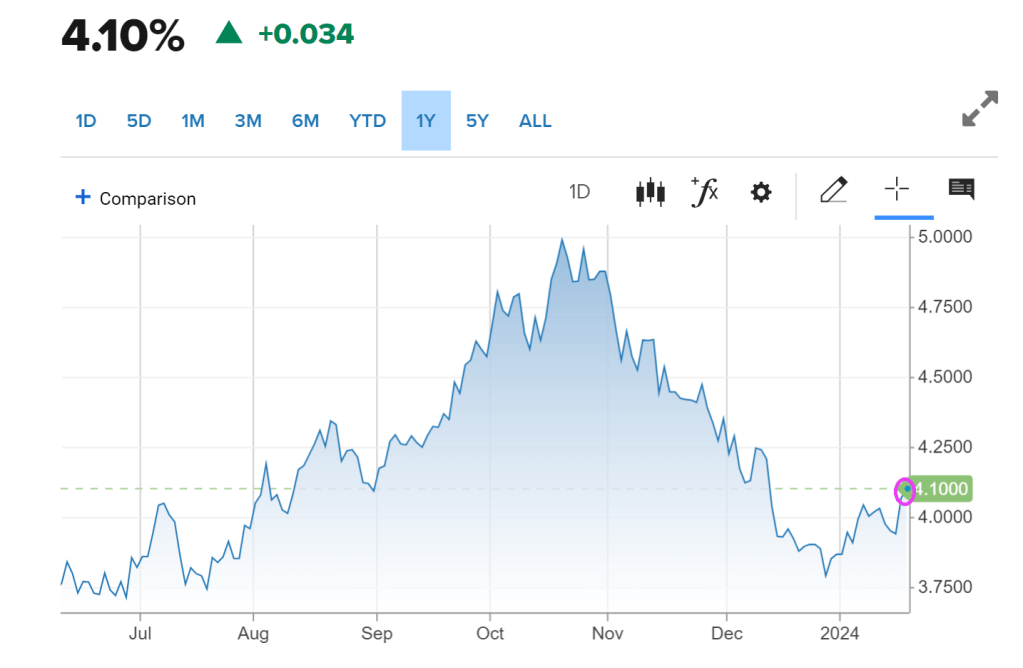
The yield on the 10-year Treasury note was recently up 4 basis points at 4.108% after briefly getting to 4.117%, the highest since Dec. 13. The 2-year Treasury yield rose by around 11 basis points to trade at 4.335%.
December’s retail sales data indicated strong consumer demand at the holidays. Retail sales increased 0.6% for the month, above economists’ estimates of 0.4%, as compiled by Dow Jones. Excluding autos, sales rose 0.4%, which also topped a 0.2% estimate.
On Tuesday, yields jumped after comments from Federal Reserve Governor Christopher Waller, who suggested that while the central bank will likely cut rates this year, it may take its time.
At the World Economic Forum in Davos, more European Central Bank members indicated that markets were getting ahead of themselves on rate cut projections.
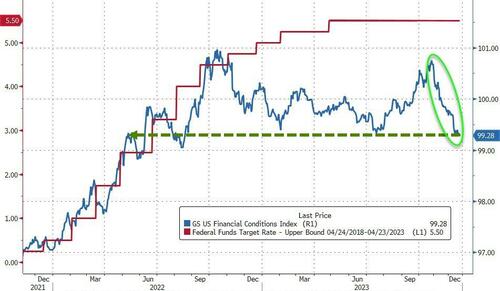
The president of the Dutch central bank, Klaas Knot, told CNBC Wednesday that the euro zone’s central bank looked at overall financial conditions, and that “the more easing the market has already done for us, the less likely we will cut rates.” Knot was referring to the fact that higher stock and bond prices in the fourth quarter of last year acted as the equivalent of easier interest rate policy, while lower prices act as the equivalent of tighter policy.
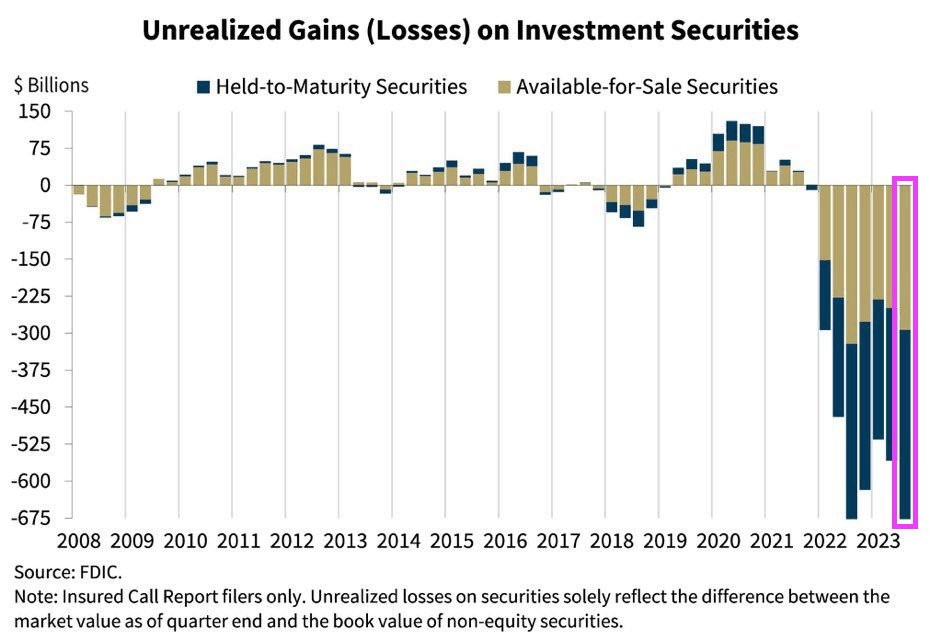
Rising interest rates are going to bite a big chunk out of The Fed’s massive ass (I mean balance sheet). Of course, The Fed sends the bill to Treasury. Gee, no wonder Biden/Yellen want so much money!
There is something wrong with letting aging politicians like Biden (81), Grassley (90), Pelosi (83), etc. borrow vast sums of money to spend when they will likely not be around for another 10 years.
You may remember that the Biden administration expected a significant deficit reduction from its tax increases and the expected benefits of its Inflation Reduction Act.
What Americans got was a massive deficit and persistent inflation.
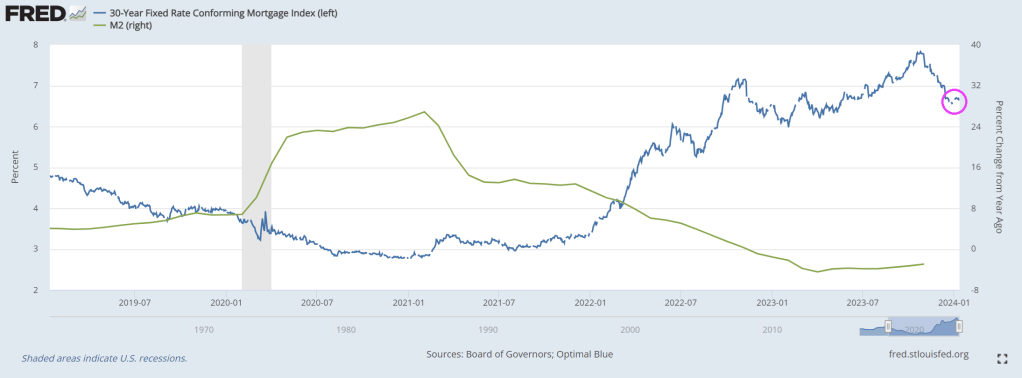
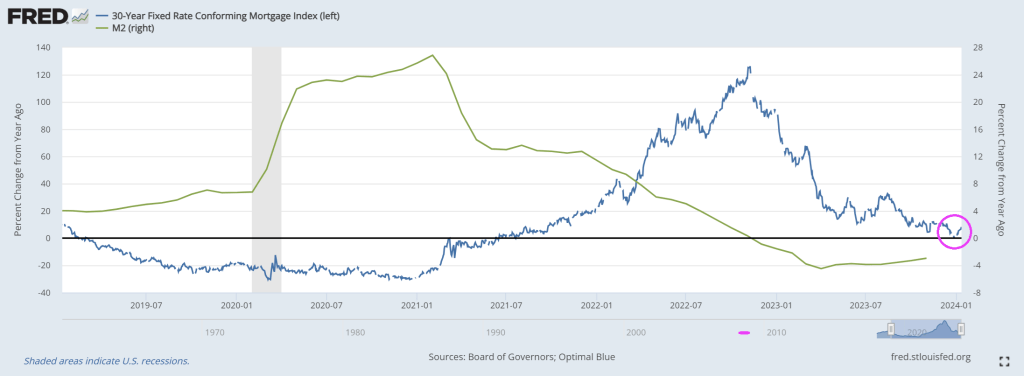
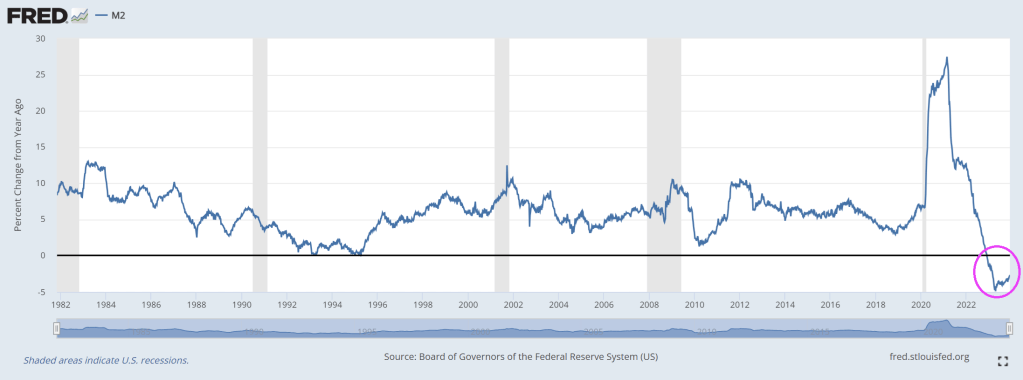
According to Moody’s chief economist, Mark Zandi, the entire disinflation process seen in the past years comes from exogenous factors such as “fading fallout from the global pandemic on global supply chains and labor markets, and the Russian War in Ukraine and the impact on oil, food, and other commodity prices.” The complete disinflation trend follows the slump in money supply (M2), but the Consumer Price Index (CPI) should have fallen faster if deficit spending, which means more consumption of newly created currency, would have been under control. December was disappointing and higher than it should have been.
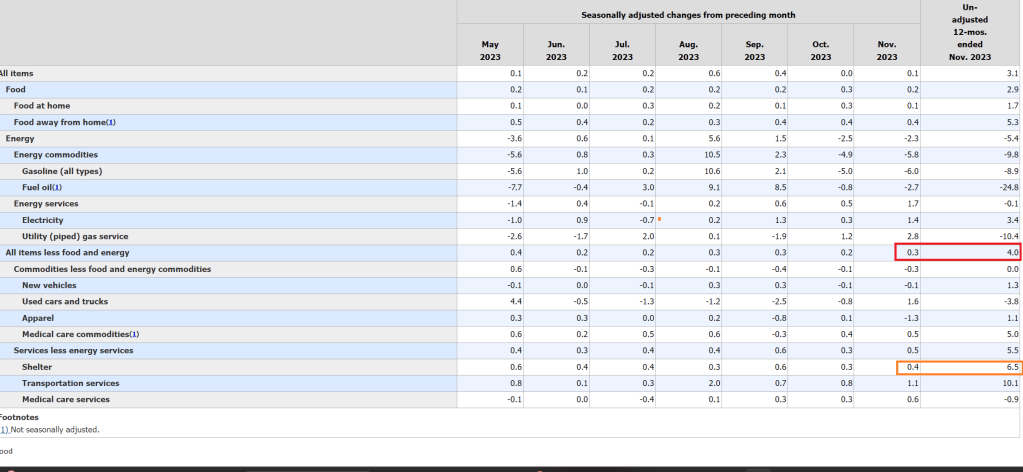
The United States annual CPI (+3.4%) came above estimates, proving that the recent bounce in money supply and rising deficit spending continue to erode the purchasing power of the currency and that the base effect generated too much optimism in the past two prints. Most prices rose in December, and only four items fell. In fact, despite a large decline in energy prices, annual services (+5.3%), shelter (+6.2%), and transportation services (+9.7%) continue to show the extent of the inflation problem.
The massive deficit means more taxes, more inflation, and lower growth in the future.
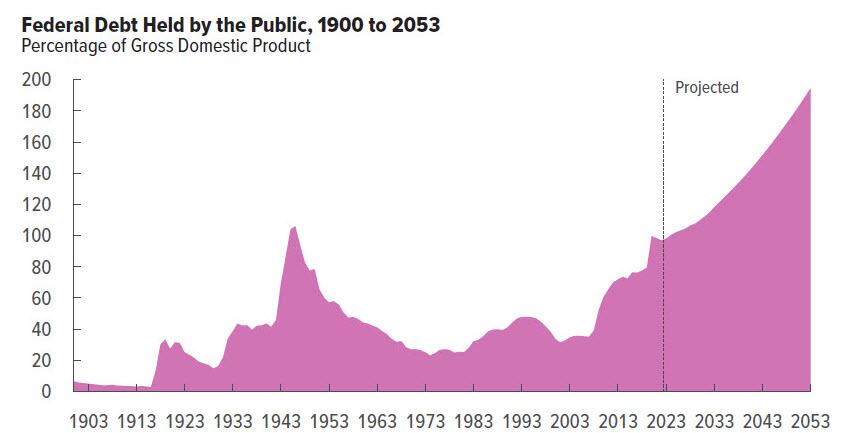
The Congressional Budget Office (CBO) expects an unsustainable path that still leaves a 5.0% deficit by 2027, growing every year to reach a massive 10.0% of GDP in 2053 due to a much faster growth in spending than in revenues. The enormous increase in debt will also lead to extremely poor growth, with real GDP rising much slower throughout the 2023–2053 period than it has, on average, “over the past 30 years.”
Deficits are not a tool for growth; they are tools for stagnation.
Deficits mean that the currency’s purchasing power will continue to vanish with money printing and that the real disposable income of Americans will be demolished with a combination of higher taxes and a weaker real value of their wages and deposit savings.
We must remember that, in Biden’s administration’s own estimates, the accumulated deficit will reach $14 trillion in the period to 2032.
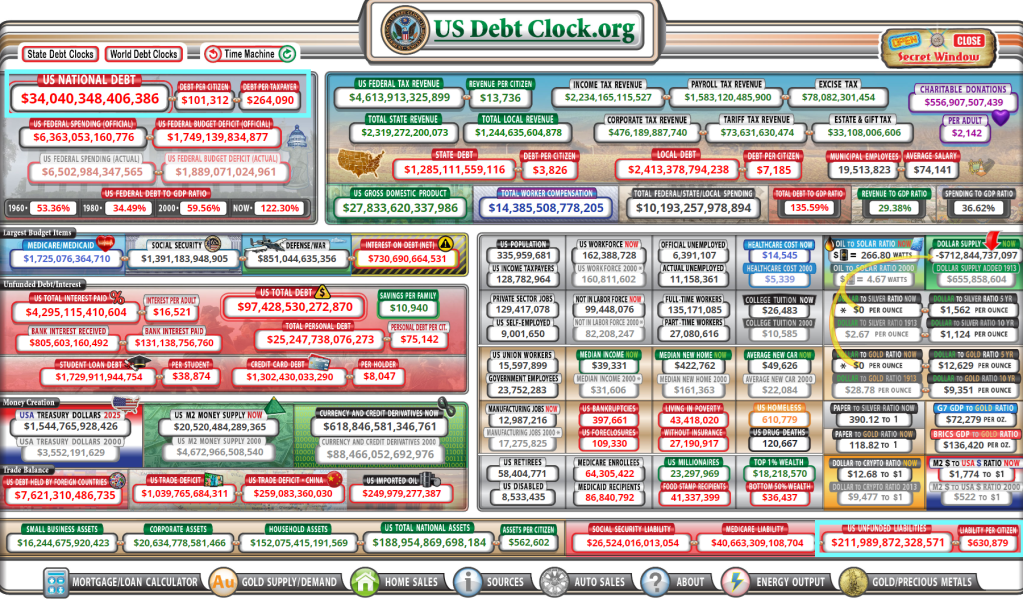
Yes, the US has $34 trillion in national debt and $212 trillion in promises made to keep the 99% quiet while the 1% gut the economy for their own wealth. Think Biden, Clintons, and various Congress Critters who suddenly become millionaires.
The Debt Star was born under Obama and weaponized under Biden/Pelosi/Schumer.
Yes, national debt rose under Trump too. Bear in mind that spending originates in The House and Trump was saddled with warhawks like RINO Paul Ryan and insider trading expert and warhawk Nancy Pelosi.
Well, we have news for you: if 2023 was bad, 2024 – an election year of course – is shaping up to be far worse.
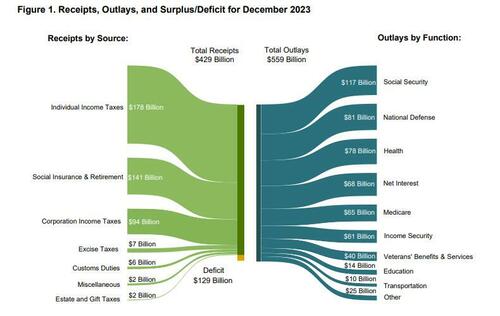
Moments ago the US Treasury reported the budget deficit picture for December and it will come as no surprise to anyone that the US has continued to spend like a drunken sailor, or rather, even more. As shown in the chart below, in the month of December, the US collected $429 billion through various taxes, while total outlays hit $559 billion…
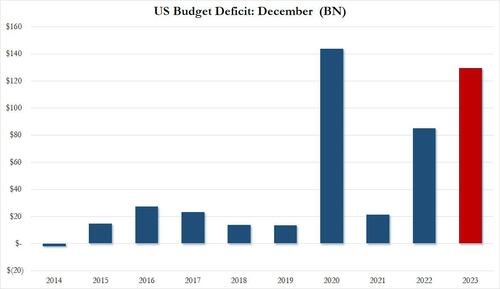
… resulting in a December deficit of $129.4 billion.This may not sound like a lot, but December is actually one of those months when the US deficit is relatively tame, or used to be.
As shown in the next chart, traditionally the December deficit was barely in the $10-20BN range… until 2020 when it exploded to an all time high of $140BN. And while it dropped sharply in 2021, it rebounded dramatically in 2022, and rose to just shy of the December crisis high last month!
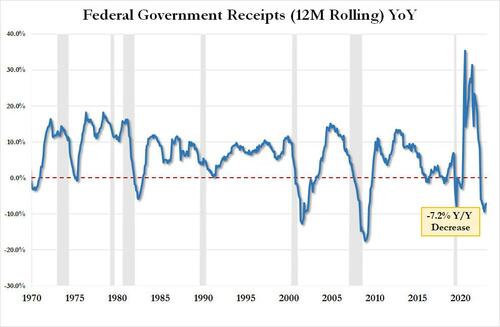
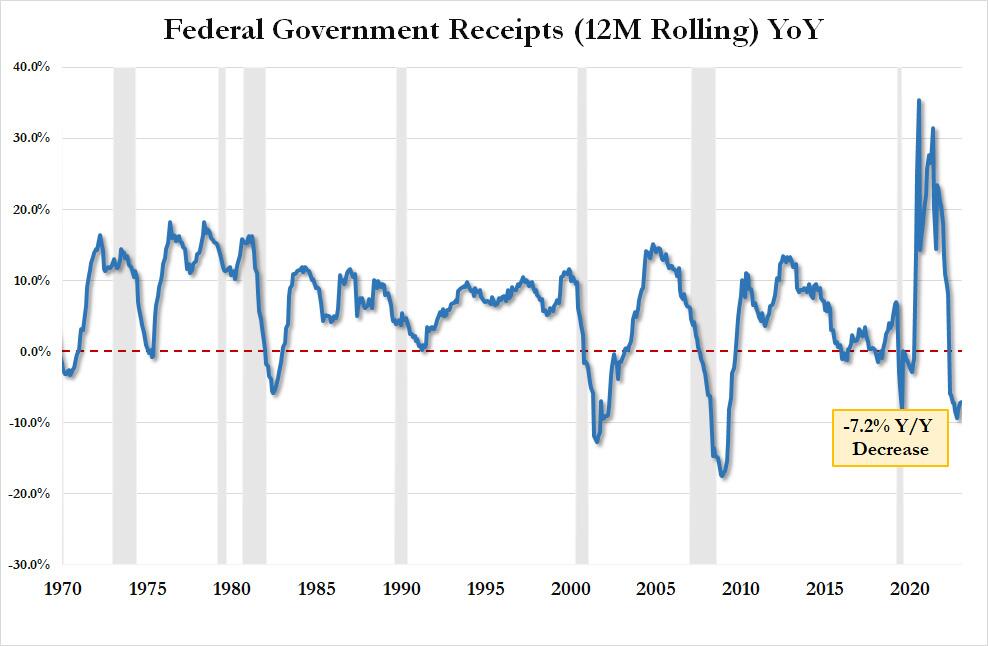
Here is some more context: tax receipts of $429.3BN in December were down 5.6% from the $454.9BN in December 2022 and down a whopping 11.8% from December 2021. On an LTM basis, US total tax receipts were $4.521TN, or down 7.2% YoY. This is now the 9th consecutive YoY decline in LTM tax receipts, something that historically has only taken place when the US was in a recession. As an aside, the “smart economists” were certain that the collapse in tax receipts would reverse after November when the postponed California taxes would be collected. Well, November has come and gone and the big picture is just as ugly.
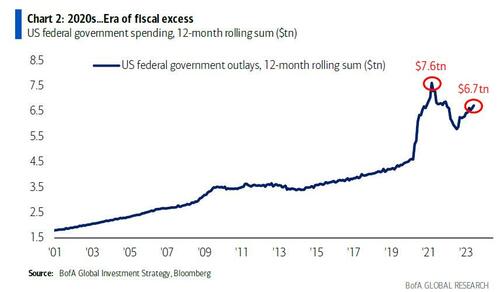
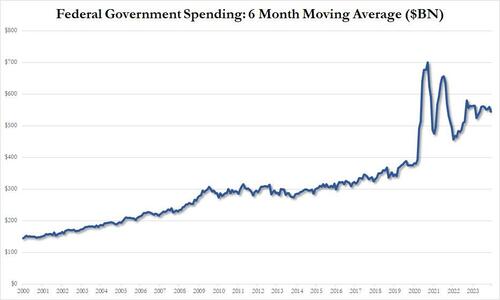
Looking at outlays, unlike tax receipts, there is danger of a decline… ever; and indeed in December the US spent a total of $559 billion, up 3.5% from the $540BN spent a year ago, and up even more from the $508BN in 2021. On a 6 month moving average basis, we are rapidly approaching the exponential phase even when accounting for the spending burst in 2020 and 2021.
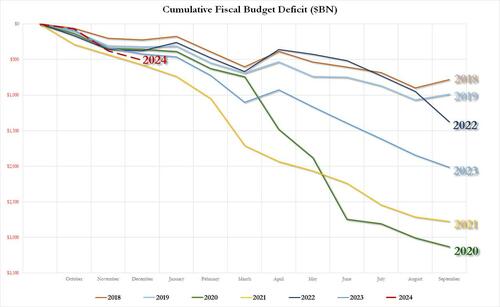
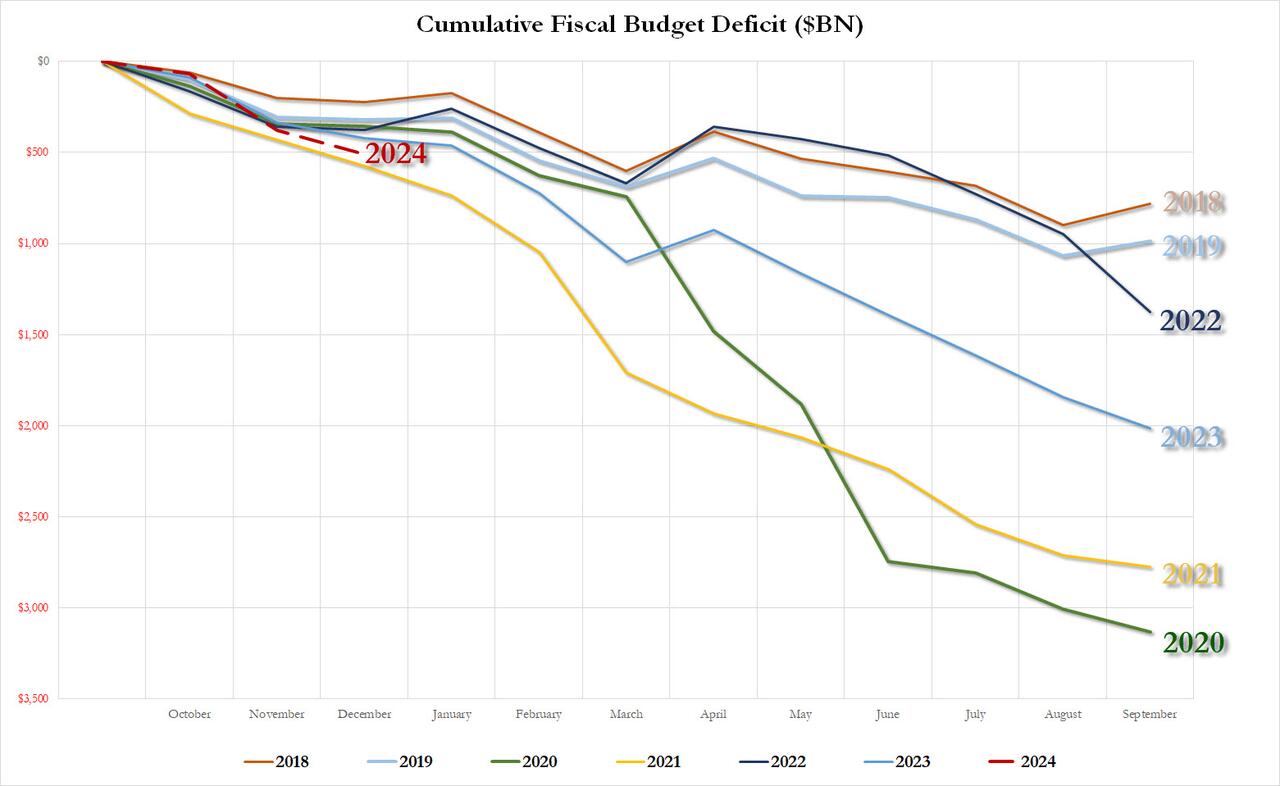
Putting it all together, we get the scariest chart of all: the YTD budget deficit three months into fiscal 2024 is already $509 billion, which would be the biggest deficit in US history after one quarter with the exception of the covid outlier year of 2021 when the US injected multiple trillions in stimmies.
As for the final, and most shocking, data point, the December budget deficit of $129.4 billion was more than $40BN higher than the $87.5BN median estimate, and was more than 50% higher compared to the $85BN December deficit in fiscal 2022.
Needless to say, this is completely unsustainable and assures fiscal collapse for the US, not if, but when. Then again, we already knew this thanks to the CBO which was kind enough to chart the endgame:
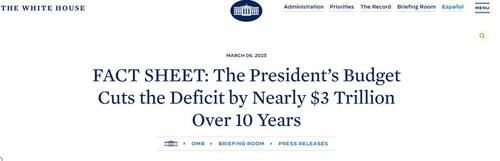
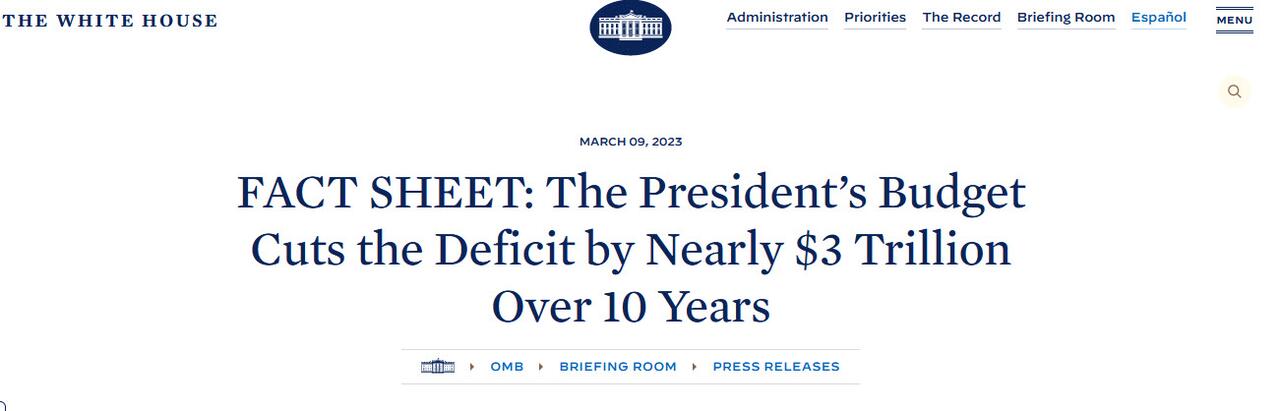
What is funniest about all this is that the US is on an accelerating path to ruin less than one year after the imposter in the White House published this laughable propaganda.
We can’t wait to see what really happens to the budget deficit over the next 10 years. Spoiler alert: there won’t be a happy ending.
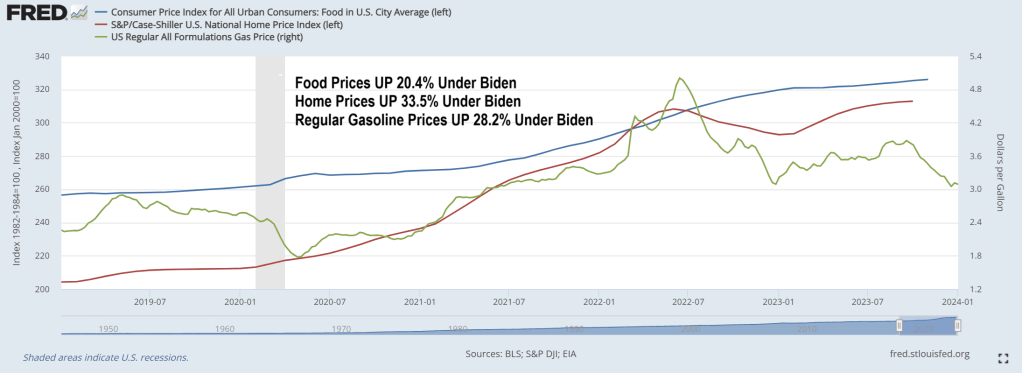
Bidenomics has taken the US economy to the underworld. Where households have to run up credit cards to ridiculous levels to cope with inflation under Bidenomics. Under Bidenomics, food prices are up 20.4%, home prices are up 33.5% and regular gasoline prices are up 28.2%. Whip out those credit cards!!!!!
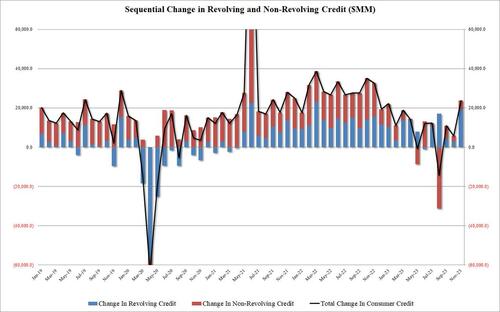
According to the latest monthly consumer credit report from the Fed, in November, consumer credit exploded higher by $24.75BN, blowing away expectations of a “modest” $9BN increase after the surprisingly subdued $5.8BN (upward revised from $.5.1BN) in October and the $4.3BN average of the past 6 months. This was the biggest monthly increase since last November, and was the first $20BN+ print since Jan 2023.
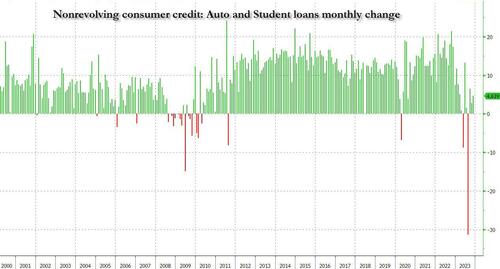
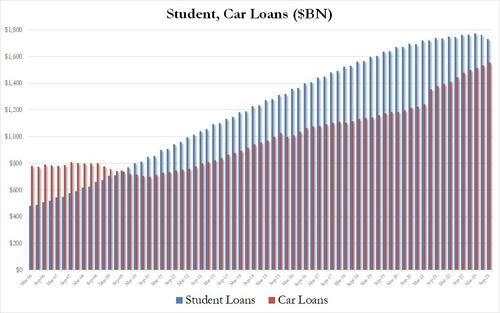
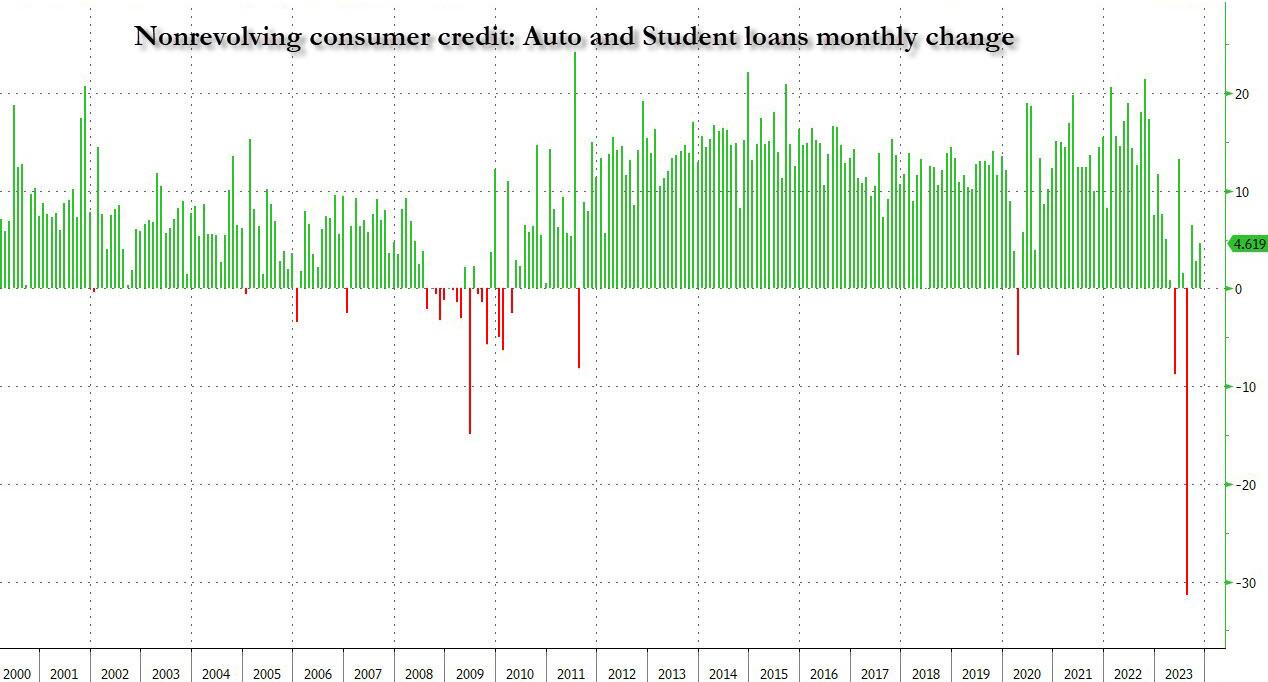
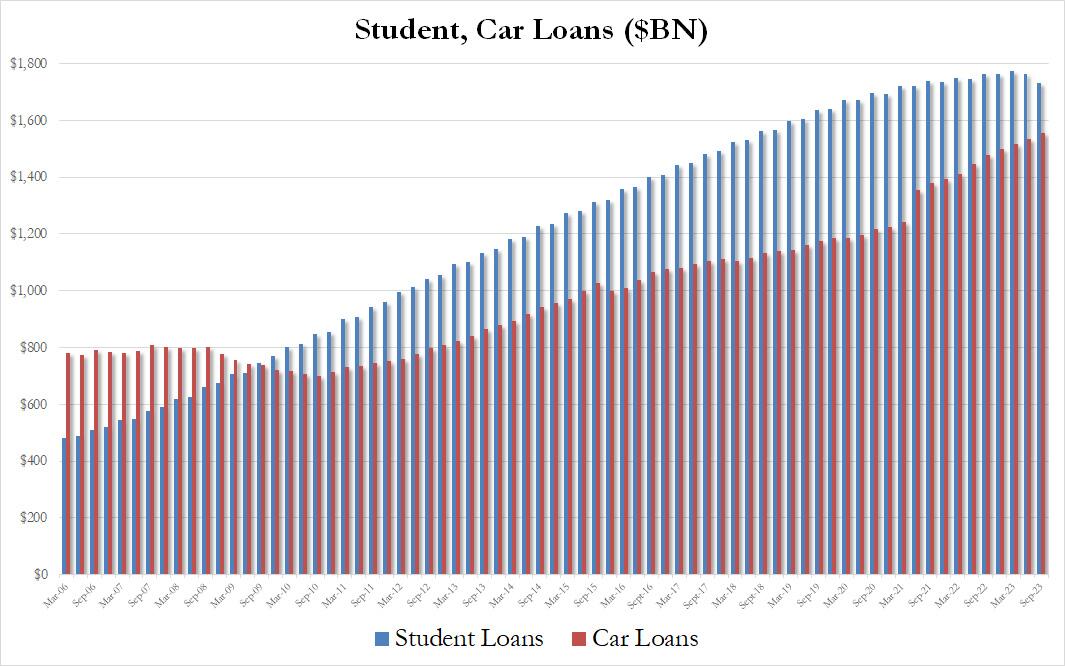
When looking into the details we find something remarkable: while non-revolving credit rose a modest $4.6BN…
… in keeping with the subdued increase in recent months as rates on auto loans make them prohibitive for most consumers while student loans are actually shrinking for the 2nd quarter in a row…
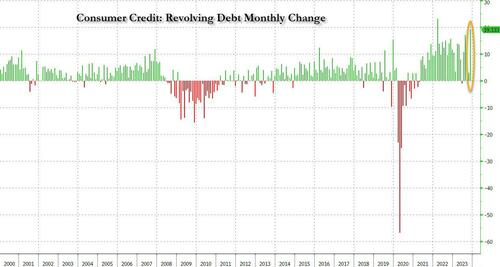
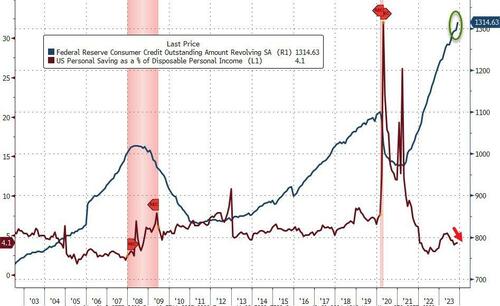
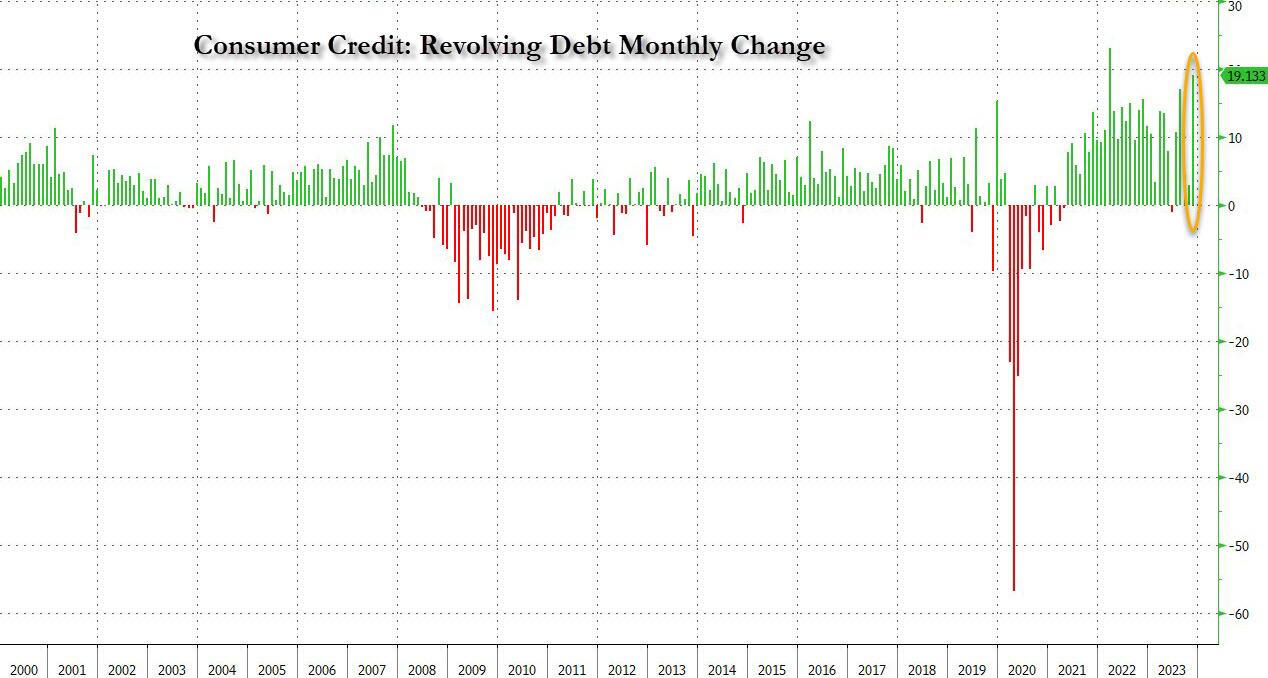
… what was the big shock in today’s data was the blowout surge in revolving credit, which in November exploded by a whopping $19.133BN, a record surge from the $2.9BN in October, and the second biggest monthly increase in credit card debt on record!
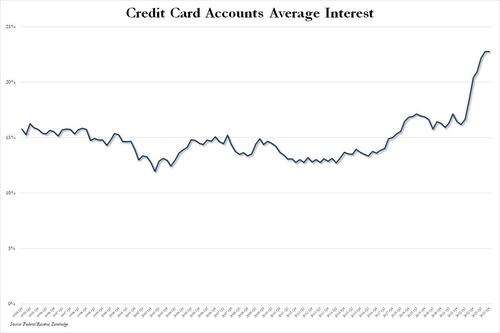
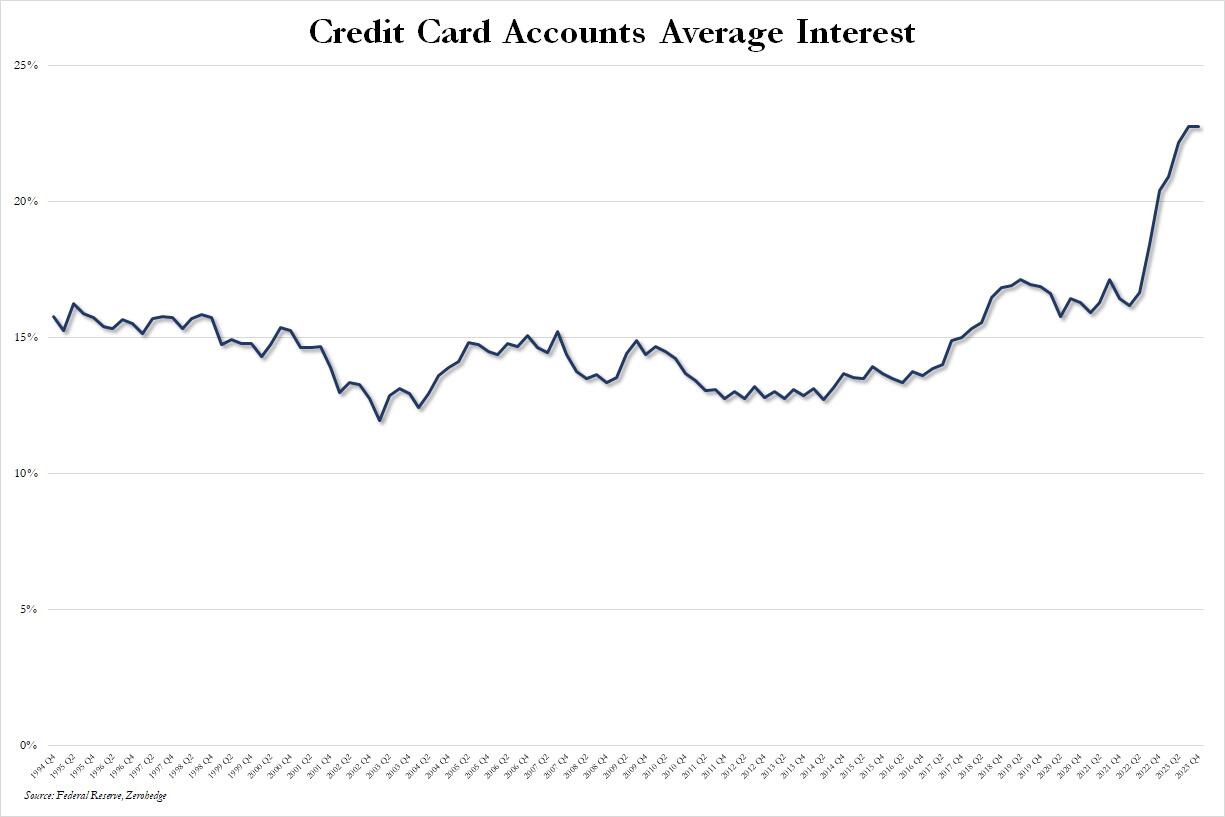
This, despite the average interest rate on credit card accounts in Q4 flat at a record high 22.75% for the second quarter in a row.
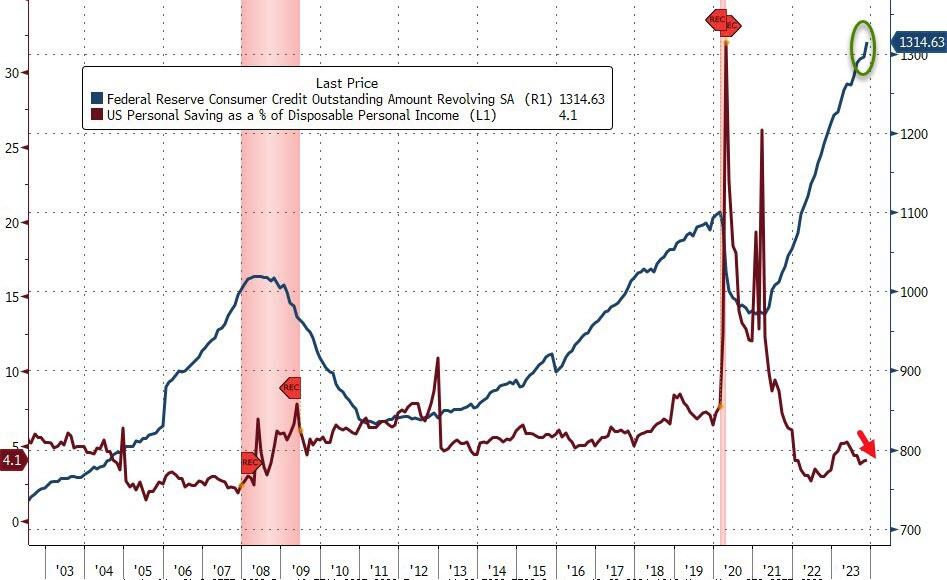
What is especially surprising about this conirmation that the bulk of holiday spending was on credit is that it takes place after several months of relative return to normaly, when consumers appeared increasingly reluctant to max out their credit cards due to record high rates, and at a time when the personal savings rate in the US has collapsed back near multi-decade lows in recent months.
Well, it now appears that Americans have once again done what they do so well: follow in the footsteps of their government and throw all caution to the wind, charging everything they can (and whatever they can’t put on installment plans which also hit a record late last year) including groceries, on their credit card, and praying for the best… or not even bothering to worry about what comes next.
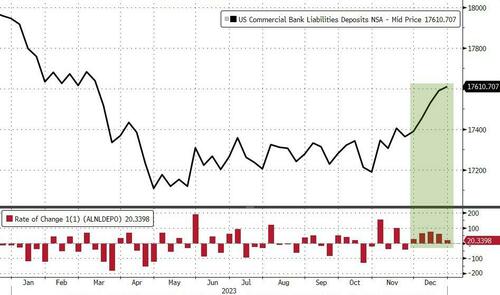
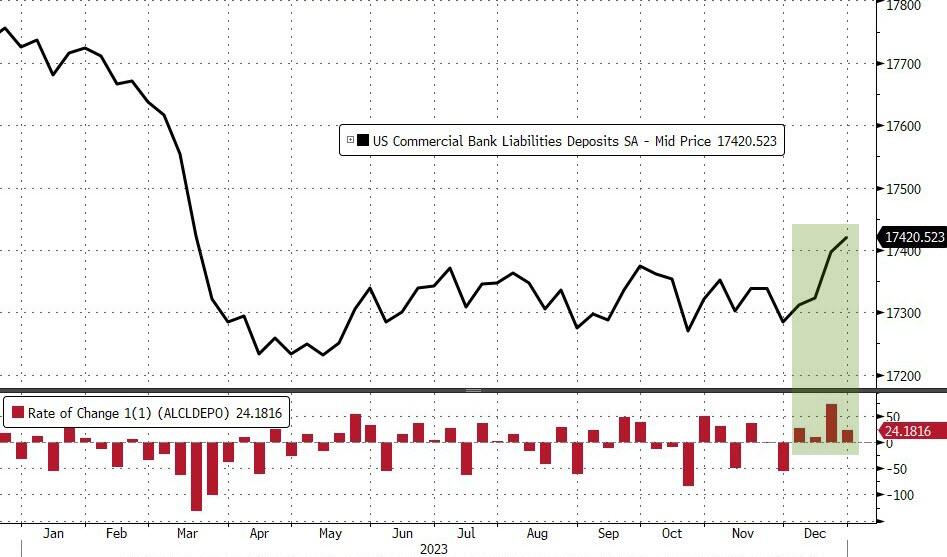
On a non-seasonally-adjusted basis, deposits rose almost in line, up $20.3BN (the fifth week of inflows in a row)…
Source: Bloomberg
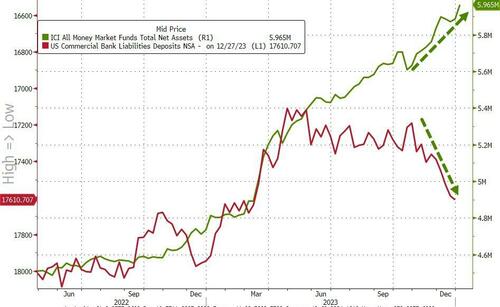
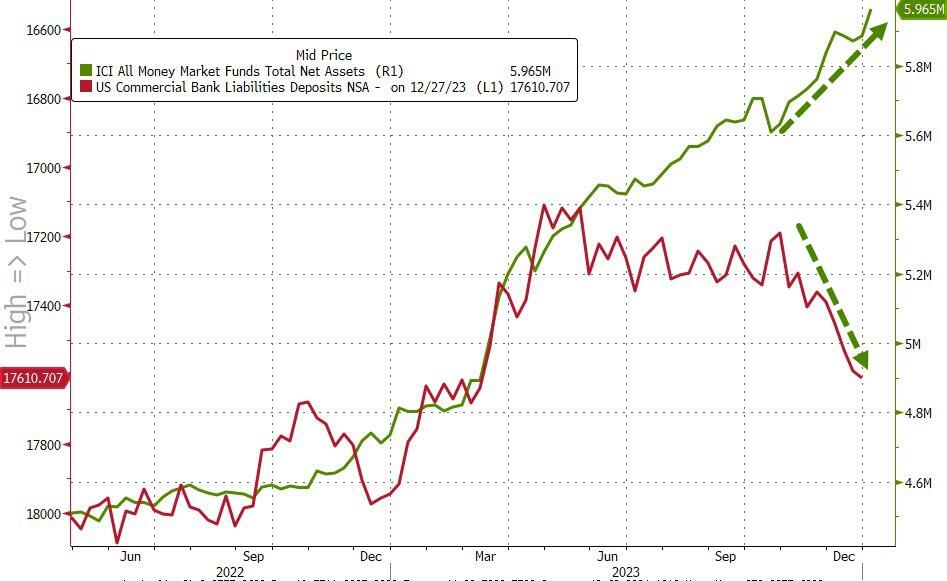
Interestingly the sizable deposit inflows are occurring alongside sizable money-market fund inflows…
Source: Bloomberg
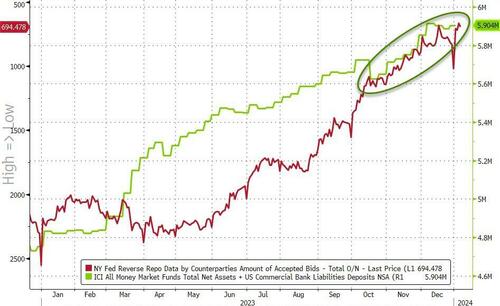
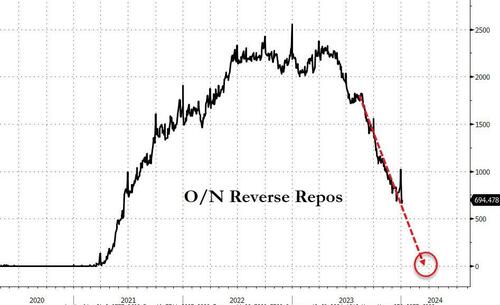
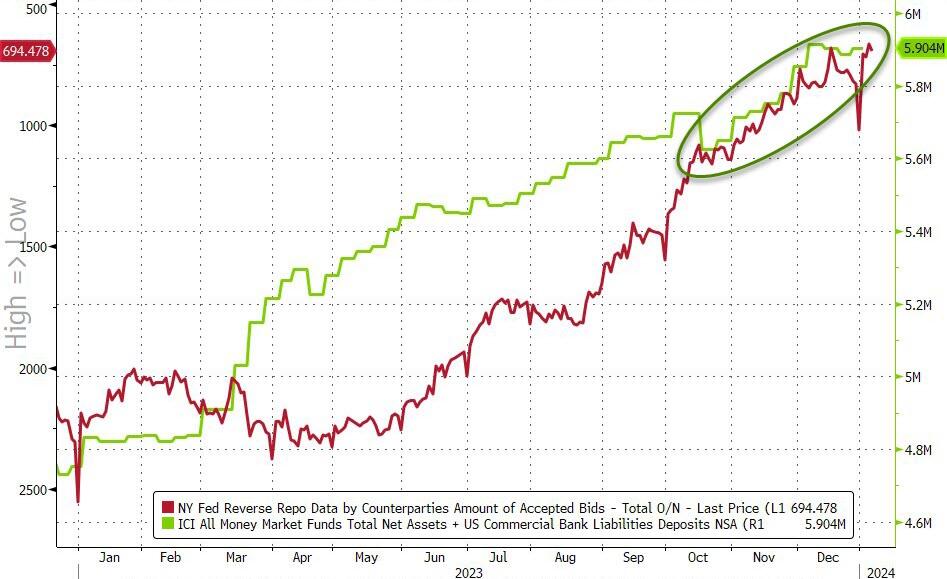
…now we know where all that reverse repo liquidation cash is going…
Source: Bloomberg
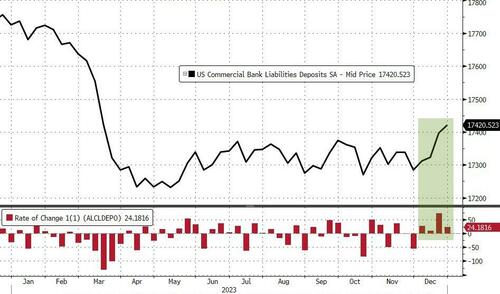
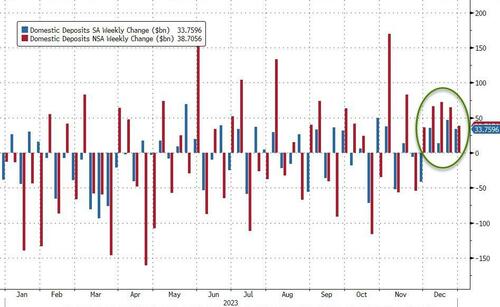
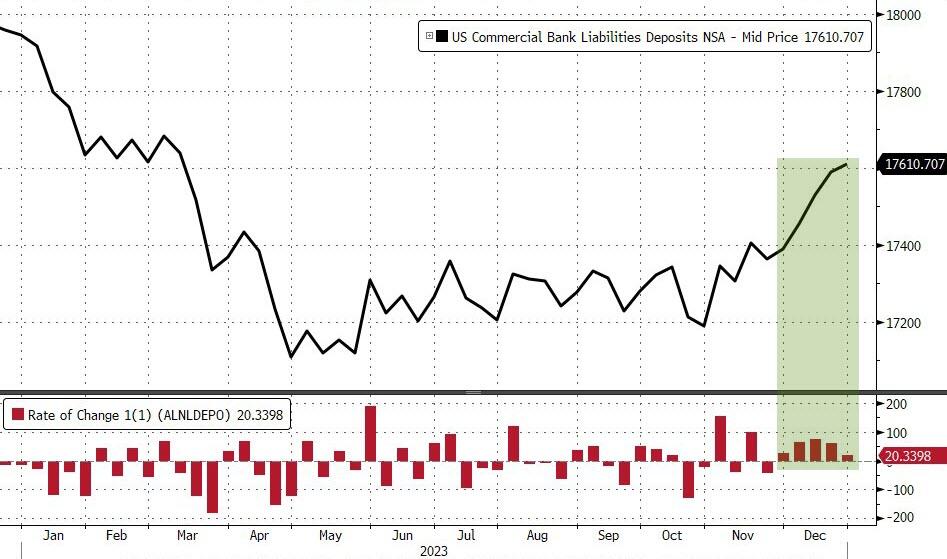
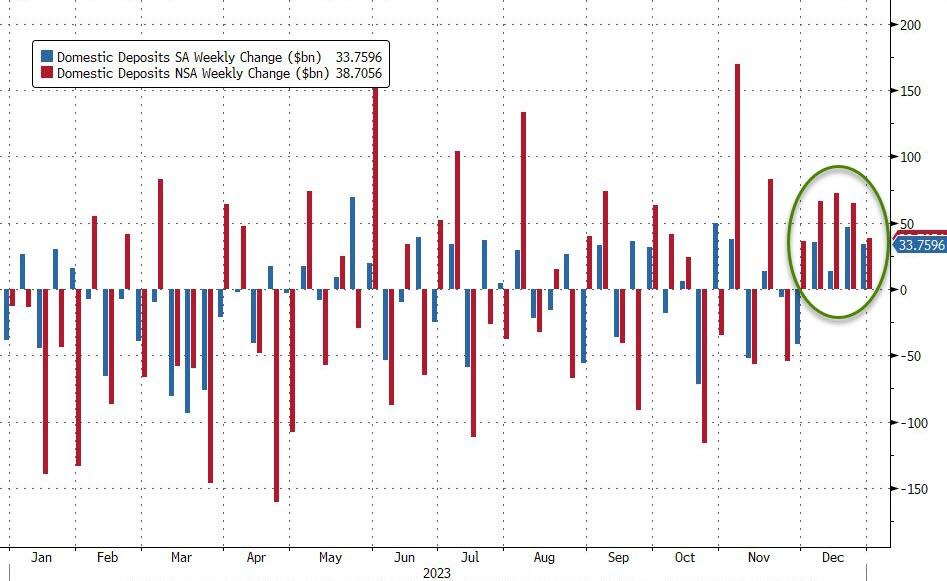
Excluding foreign bank flows, the picture is even rosier with domestic bank deposit inflows of $33.8BN (SA) and $38.7BN (NSA) – the 5th week in a row of NSA inflows…
Source: Bloomberg
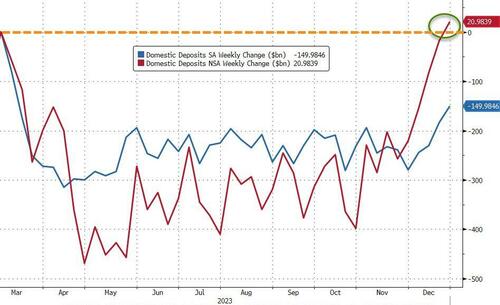
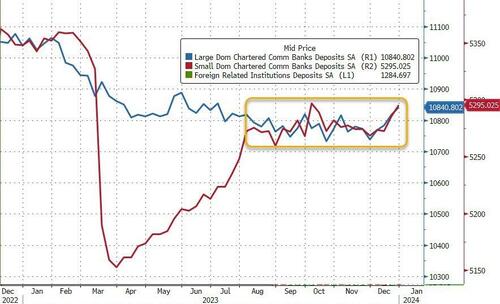
While it may surprise some, on an NSA basis, domestic bank deposits are now back above pre-SVB levels…
Source: Bloomberg
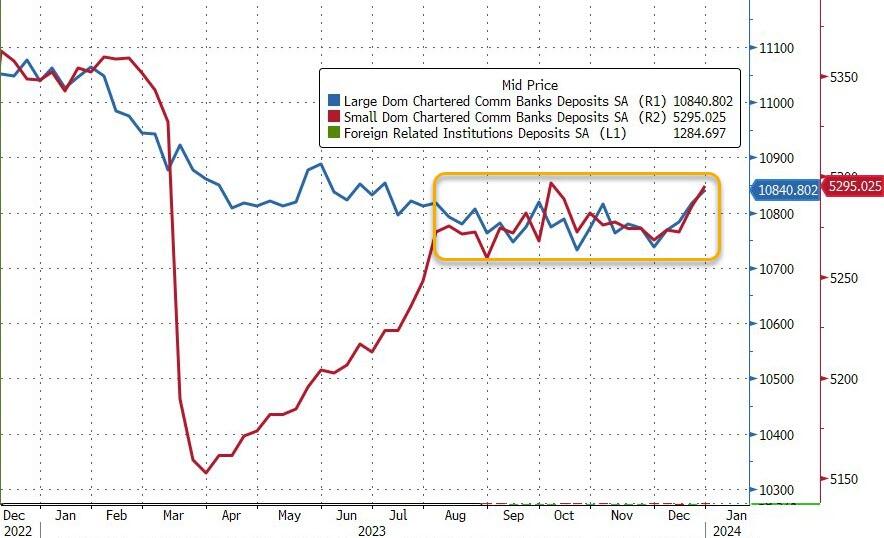
Large banks saw $24BN inflows last week and Small Banks $9.4BN (on an SA basis) and for the 5th week in a row both large and small banks saw NSA inflows (+$30BN and +$8.7BN respectively)…
Source: Bloomberg
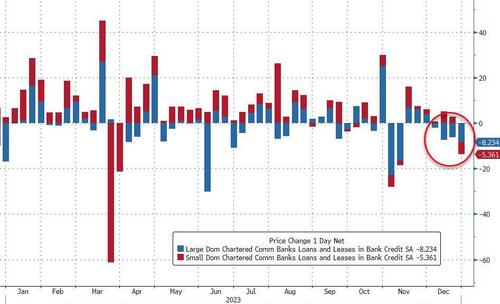
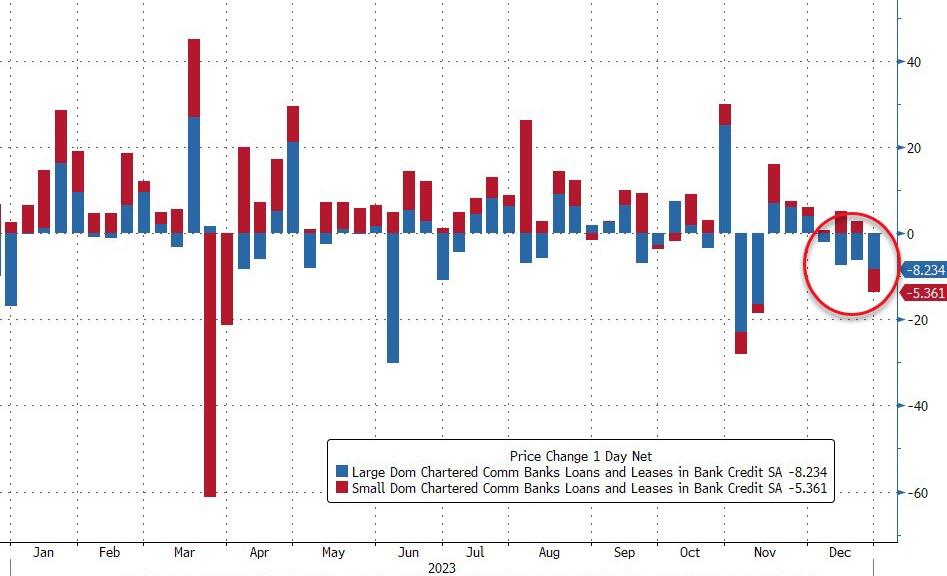
On the other side of the ledger, loan volumes continued to shrink (despite the deposit growth). Large bank loan volumes fell $8.2BN (the 4th week of falling loan volumes in a row)…
Source: Bloomberg
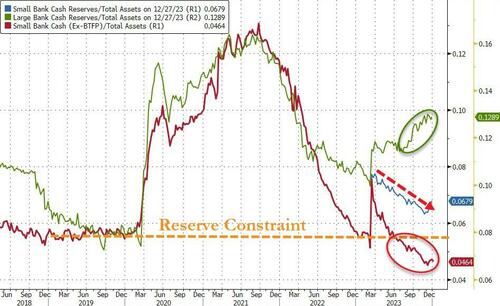
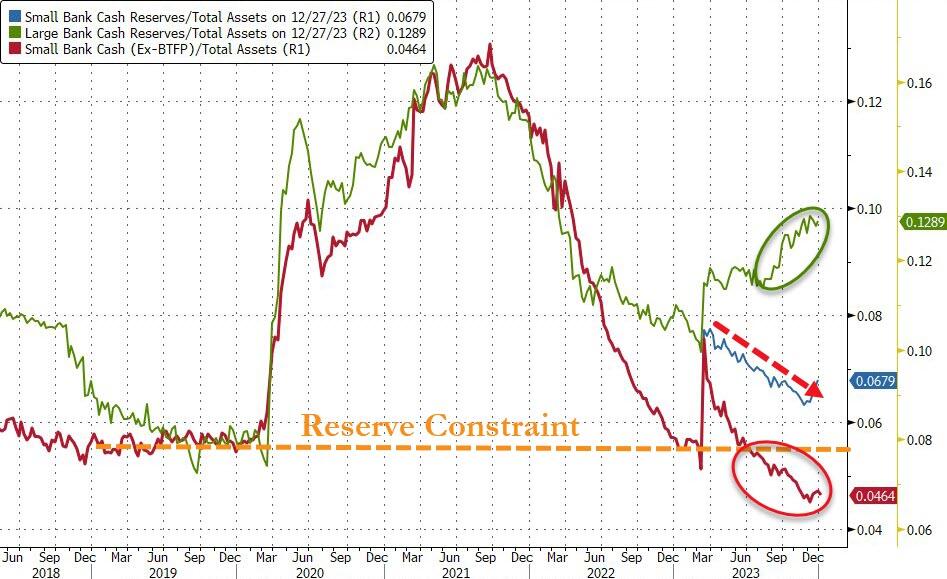
Which leave us continuing to highlight the fact that there is potential trouble brewing still as the key warning sign continues to flash red (Small Banks’ reserve constraint – blue line), supported above the critical level by The Fed’s emergency funds (for now)…
Source: Bloomberg
As the red line shows, without The Fed’s help, the crisis is back (and large bank cash needs a home – green line – like picking up a small bank from the FDIC).
All of which keep us wondering, are we setting up for another banking crisis in March as:
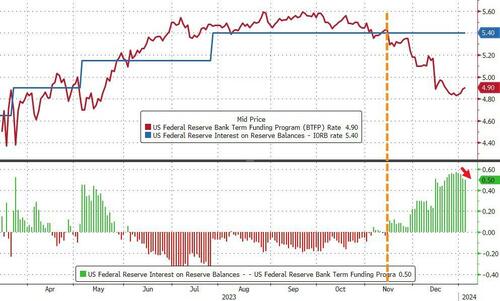
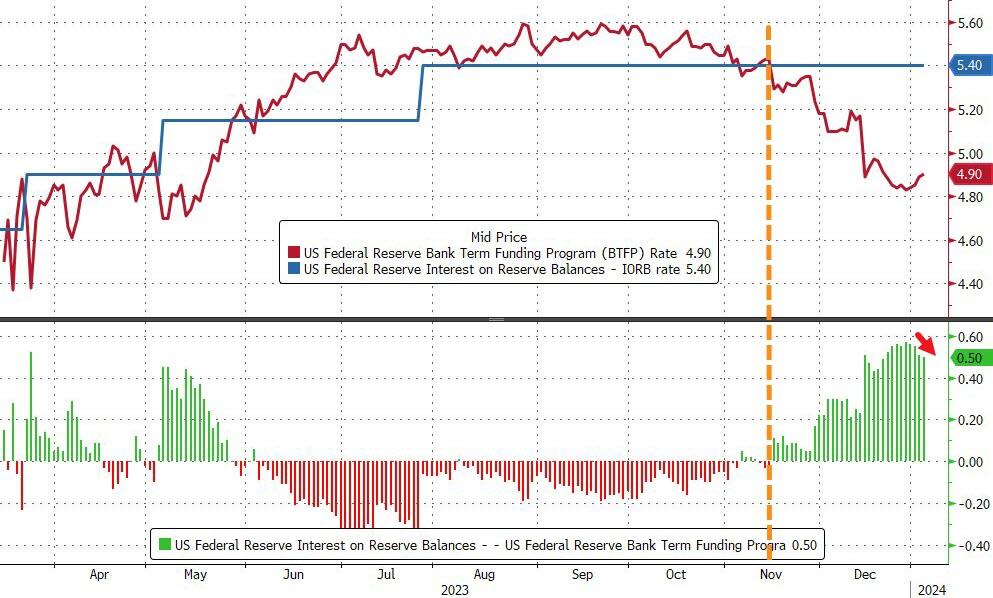
1) BTFP runs out…
It was only a 12 month temporary program, and it is going to be hard for The Fed to keep it alive. The BTFP-Fed Arb continues to offer ‘free-money’ (and usage of the BTFP has risen by $32BN since the arb existed), but the spread has narrowed a smidge from a peak near 60bps to 50bps today…
Source: Bloomberg
Which will make it hard for The Fed to defend leaving the facility open after March when its “temporary” nature is supposed to expire.
“In justifying the generous terms of the original program, the Fed cited the ‘unusual and exigent’ market conditions facing the banking industry following last spring’s deposit runs,” Wrightson ICAP economist Lou Crandall wrote in a note to clients.
“It would be difficult to defend a renewal in today’s more normal environment.”
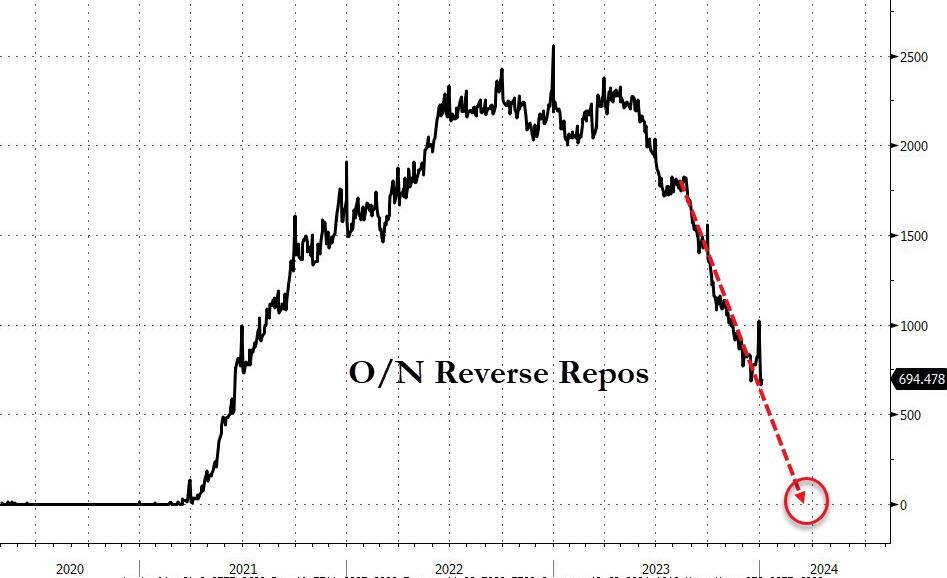
2) RRP drains to zero…
…at which point reserves get yanked which means huge deposits flight.
Source: Bloomberg
Is this the real reason why The Fed ‘pivoted’? It knows what’s coming??
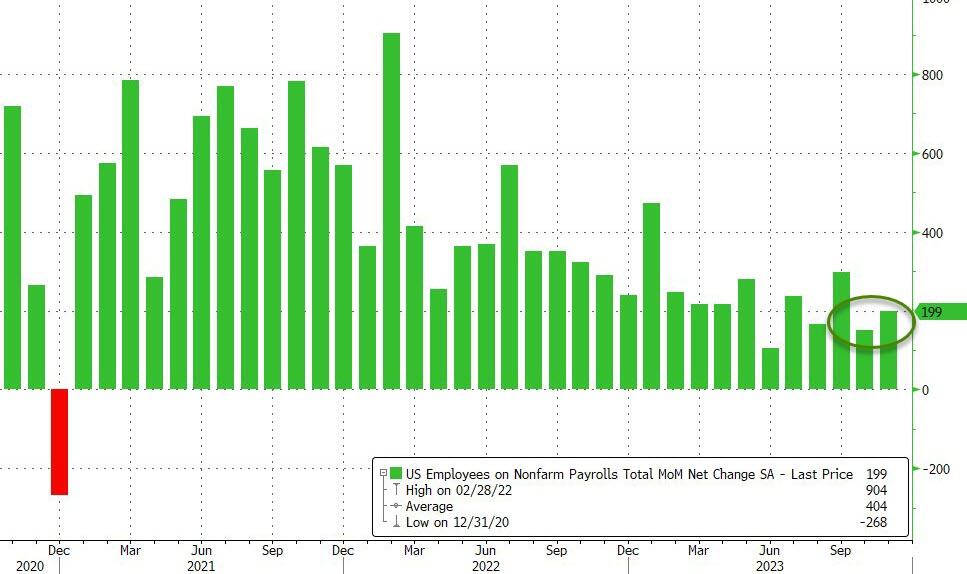
Several talking heads are salivating about the strong or solid jobs report in October. As if The Federal Reserve can’t read the jobs report. I call the report “Government gone wild!” since 51k government jobs were added in October.
Job gains occurred in health care, government, and social assistance. Employment declined in manufacturing due to strike actvity.
Total nonfarm payroll employment increased by 150,000 in October, below the average monthly gain of 258,000 over the prior 12 months. In October, job gains occurred in health care, government, and social assistance. Employment in manufacturing declined due to strike activity. (See table B-1.) Health care added 58,000 jobs in October, in line with the average monthly gain of 53,000 over the prior 12 months. Over the month, employment continued to trend up in ambulatory health care services (+32,000), hospitals (+18,000), and nursing and residential care facilities (+8,000). Employment in government increased by 51,000 in October and has returned to its pre-pandemic February 2020 level. Monthly job growth in government had averaged 50,000 in the prior 12 months. In October, employment continued to trend up in local government (+38,000). Social assistance added 19,000 jobs in October, compared with the average monthly gain of 23,000 over the prior 12 months. Over the month, employment continued to trend up in individual and family services (+14,000). In October, construction employment continued to trend up (+23,000), about in line with the average monthly gain of 18,000 over the prior 12 months. Employment continued to trend up over the month in specialty trade contractors (+14,000) and construction of buildings (+6,000). Employment in manufacturing decreased by 35,000 in October, reflecting a decline of 33,000 in motor vehicles and parts that was largely due to strike activity. In October, employment in leisure and hospitality changed little (+19,000). The industry had added an average of 52,000 jobs per month over the prior 12 months. Employment in professional and business services was little changed in October (+15,000) and has shown little net change since May.
Speaking of Govzilla, my favorite quote showing the stupidity of BIG government is … Biden’s climate envoy John Kerry. “We’ve got to cut down on farming due to ‘Climate Change’…or people are going to starve…”
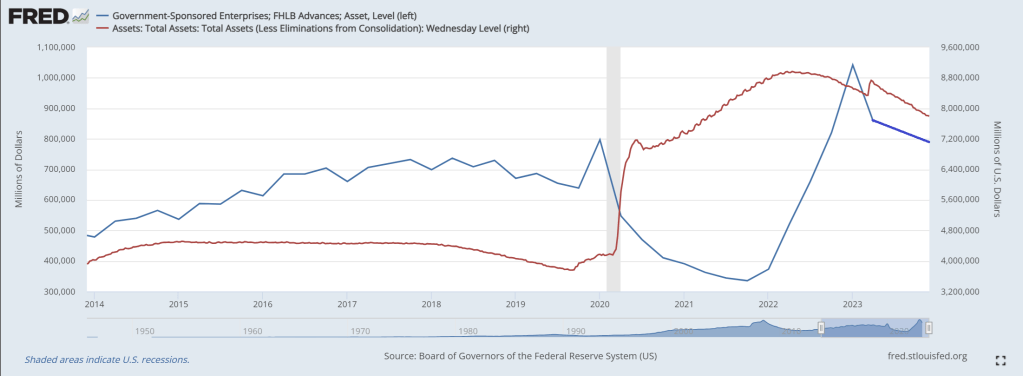
The Federal Home Loan Bank System (comprised of Federal Home Loan Banks or FLUBs) are a major source of American home loans and liquidity … at least until now.
According to a recently released report, the Federal Housing Finance Agency (FHFA) plans to propose rules that would curtail US banks’ borrowings from the Federal Home Loan Banks (FHLBs) to ensure they are not used as a “lender of last resort.” The announcement comes after the liquidity crunch in March spurred several banks to tap into the FHLB system, sending FHLB advances to a three-year high in the first quarter. During that quarter, when two large regional banks failed, FHLB advances totaled $804.39 billion, comprising 3.7% of banks’ total liabilities.
While totals have fallen since then, sitting at $602.62 billion, or 2.8% of total liabilities, in the third quarter, the FHFA is still seeking to impose limitations. Should the agency enact the new rules, banks’ liquidity options would be hindered. The FHFA wants Federal Reserve facilities to be used instead, but banks are reluctant to tap those because of the stigma attached to those sources, industry experts said.
“It is fair to argue that some banks have come to rely on FHLB funding as a crutch, and the ramp in lending to struggling banks during the mini-crisis in March is an area of continued debate,” Isaac Boltansky and Isabel Bandoroff of BTIG LLC wrote in a Nov. 11 note. “With that being said, there is still a clear stigma associated with tapping the Fed’s Discount Window and other facilities, which should be part of the conversation if the FHLB support will eventually be curtailed.”
Among the various rules the FHFA plans to propose is requiring that certain members have at least 10% of their assets in residential mortgage loans or equivalent mission assets, including assets that qualify as Community Financial Institution collateral, on an ongoing basis in order to stay eligible for FHLB financing.
The leading FLUB borrower? Columbus Ohio’s own JP Morgan Chase!
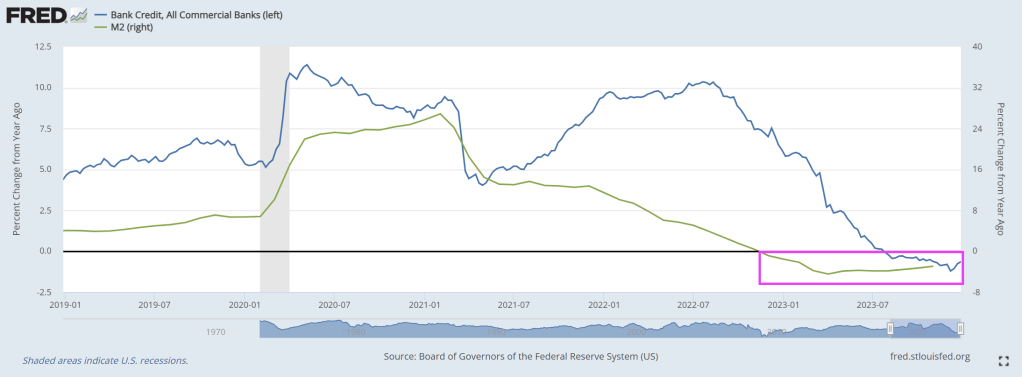
The problem is that bank credit growth has been contracting for several weeks now. 18th straight week of negative credit growth.
As FLUB advances decline with Fed balance sheet shrinkage.


You must be logged in to post a comment.