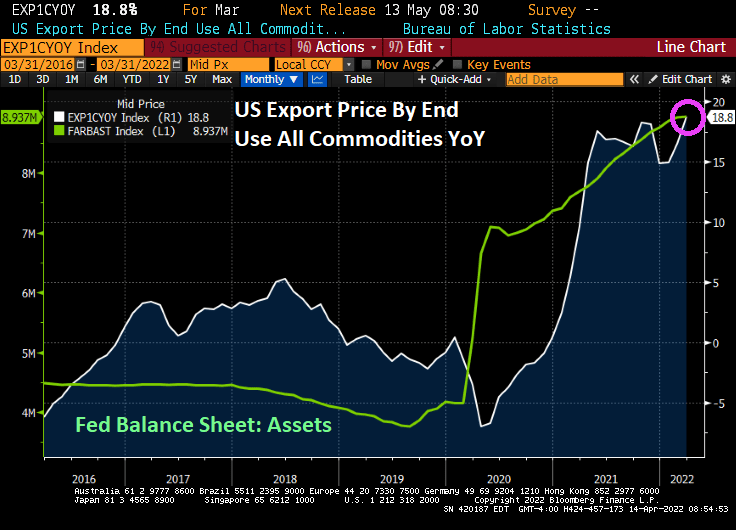
Export prices by end us YoY is up to 18.8%, the highest in recorded history (or since 1983 when they started recording export prices).
Import prices by end use rose to 12.5% YoY.
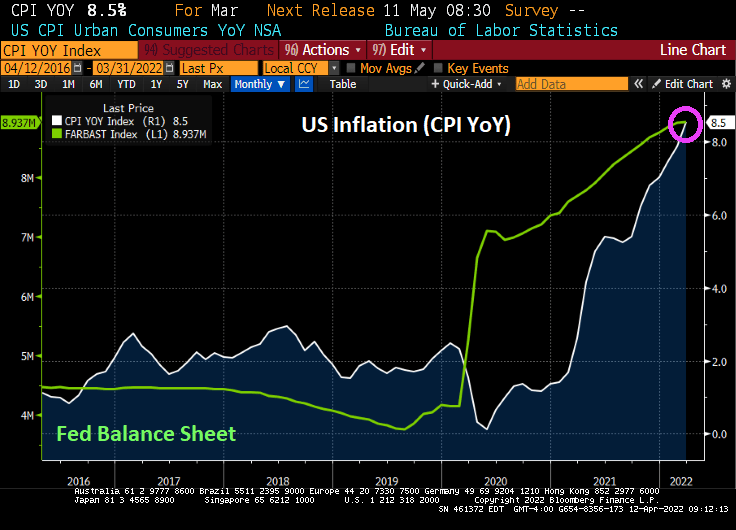
Unrelated to US export and import prices, the MBA’s mortgage credit availability index slumped with the Covid outbreak and the explosion of The Fed’s Balance Sheet. As I have said before, nothing has been the same since Covid.
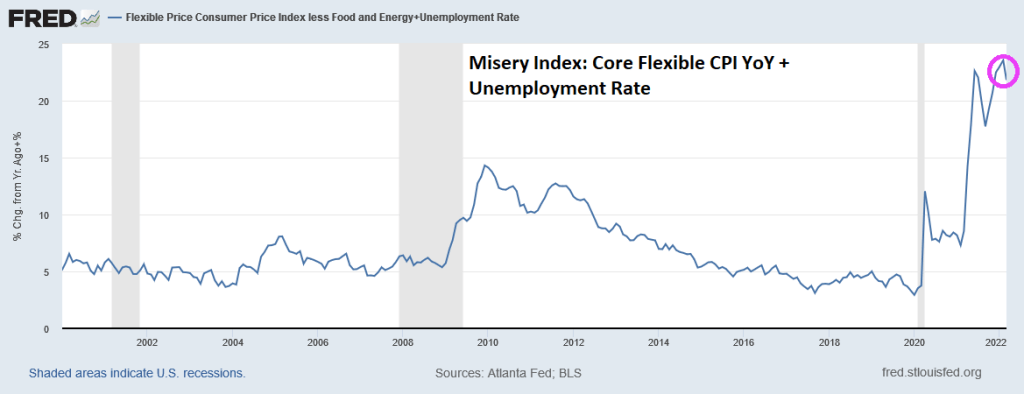
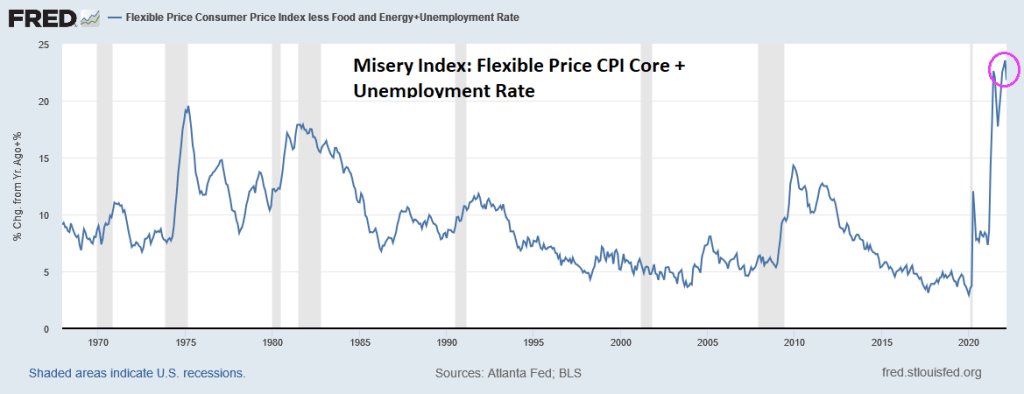
The Federal Reserve’s two goals of price stability and maximum sustainable employment are known collectively as the “dual mandate.” Unfortunately, inflation is running away (bad) from employment gains (good). Sort of like “The Good, The Bad and The Ugly.” But just the Good and The Ugly combine to create the Misery Index.
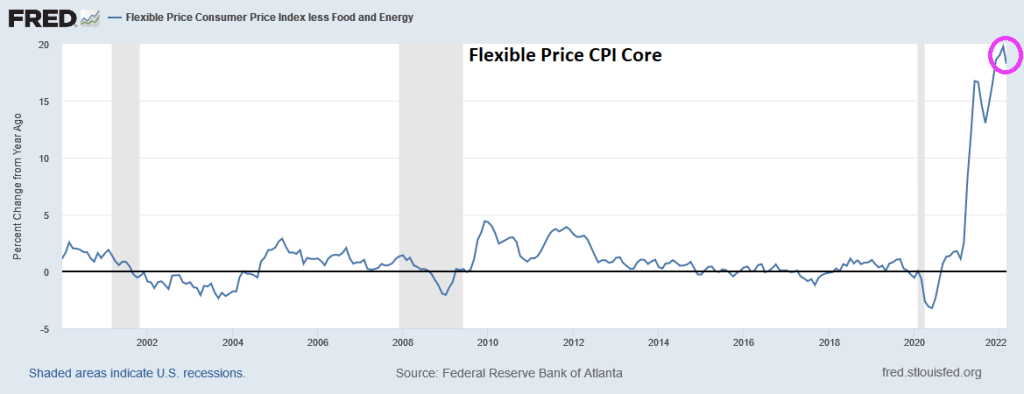
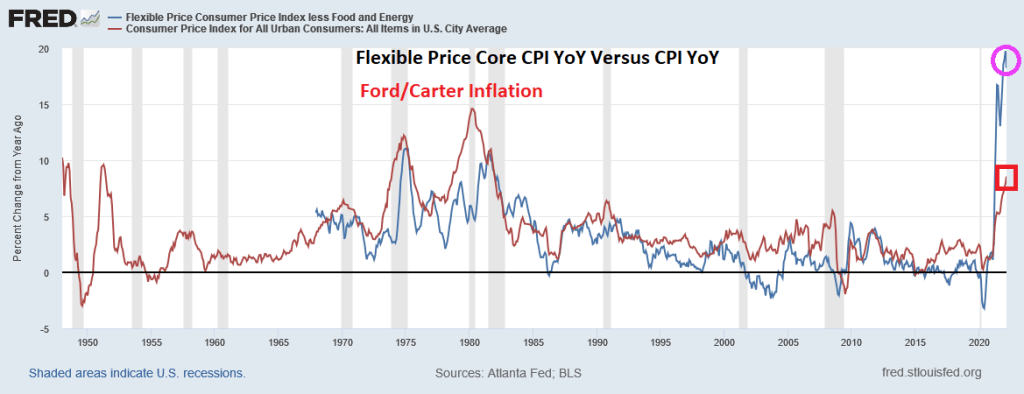
Here is the Atlanta Fed’s CORE flexible CPI YoY for March. The good news? Flexible Core CPI YoY was a little lower than the historic high reading in February. The bad news? We are still talking about 21.82%+ rise in prices (down from 23.56% in February).
If I use the Atlanta Fed’s flexible consumer price CORE index combined with the U-3 unemployment rate, we see that March’s inflation report plus U-3 unemployment is generating a misery index that was last seen in July 2008 during The Great Recession. Unless we consider the July 2021 reading of 31.3%, so we have seen two horrible misery index readings under Biden.
If we look at the Misery Index since 1967, we now have the GOAT (Greatest of All-time) Misery.
Now, inflation under Presidents Ford and Carter (red line) were higher than the flexible core price index (blue line) in the 1970s and 1980. But flexible core price CPI YoY is substantially higher than March’s CPI growth of 8.5%.
The bottom line is that inflation losses are far outweighing the employment gains, resulting in elevated misery.
US real average weekly earnings growth YoY is down to -3.60%. That is the lowest since 2007 and is worse than The Great Recession and financial crisis of 2008.
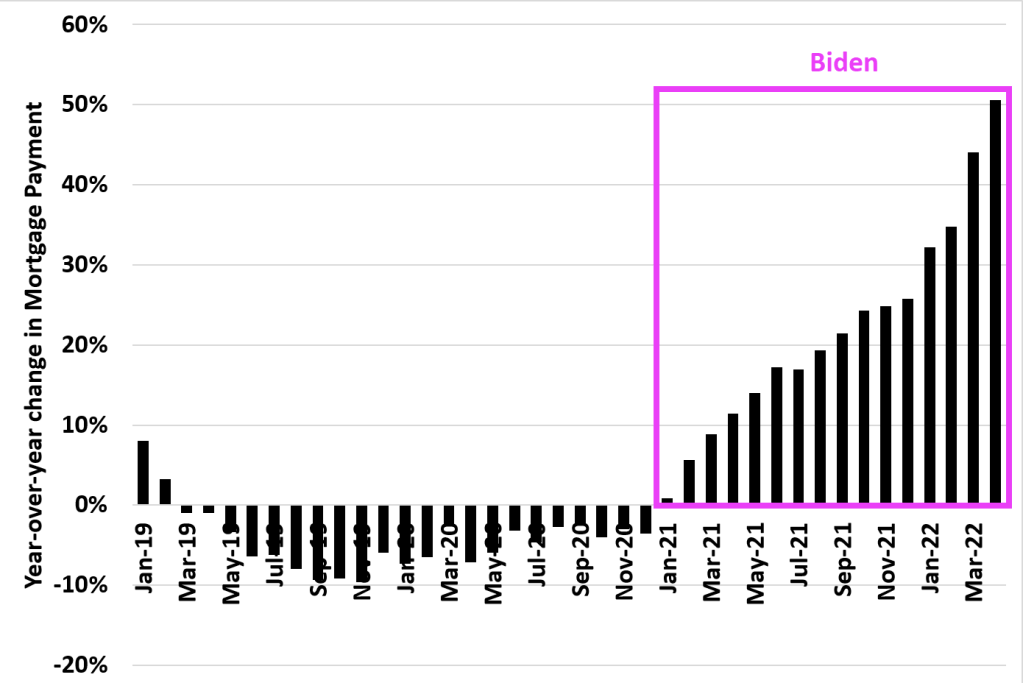
And look at this chart of mortgage payments under Biden. The US was actually experiencing DECLINING mortgage payments YoY in 2019 and 2020. But under Biden’s leadership, mortgage payments have increased by 50% making housing even MORE unaffordable for the middle class and lower-income households.
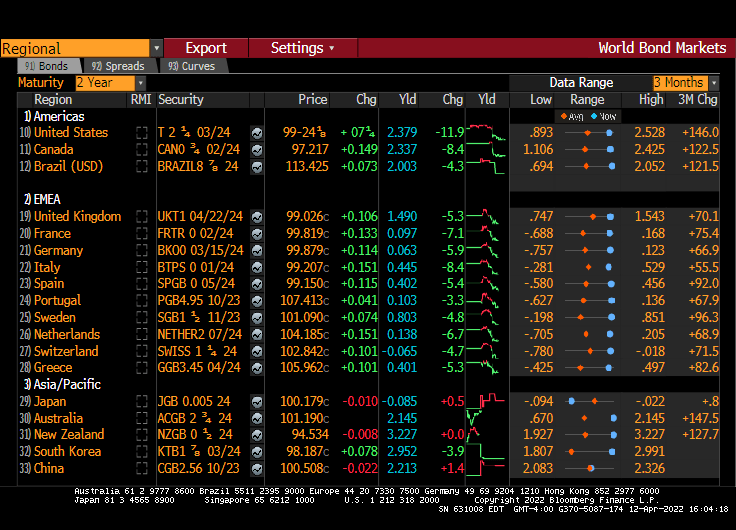
And now for something kind of scary. The US today suffered a 12 basis point decline in the 2-year Treasury yield, generally a bad sign for the economy. As if we needed more bad news for today.
Highest inflation in 40 years, worst wage growth since 2007 and rising mortgage payments. We will need all the luck we can get.
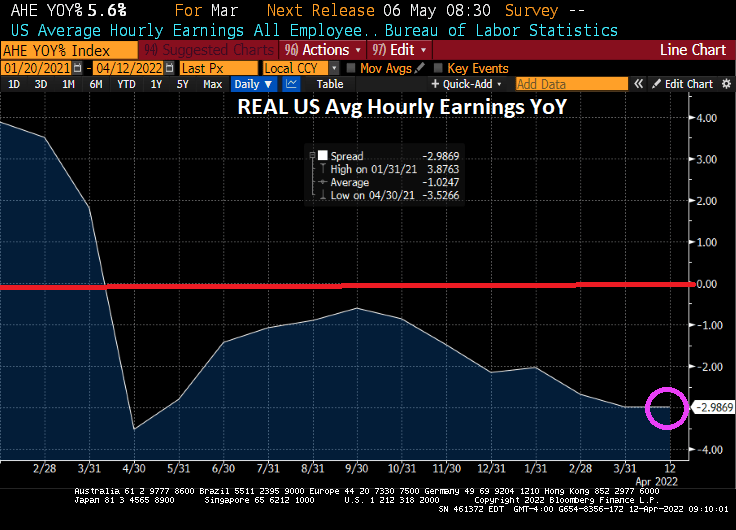
With 8.5% YoY inflation, REAL average hourly earnings growth fell to -3% YoY.
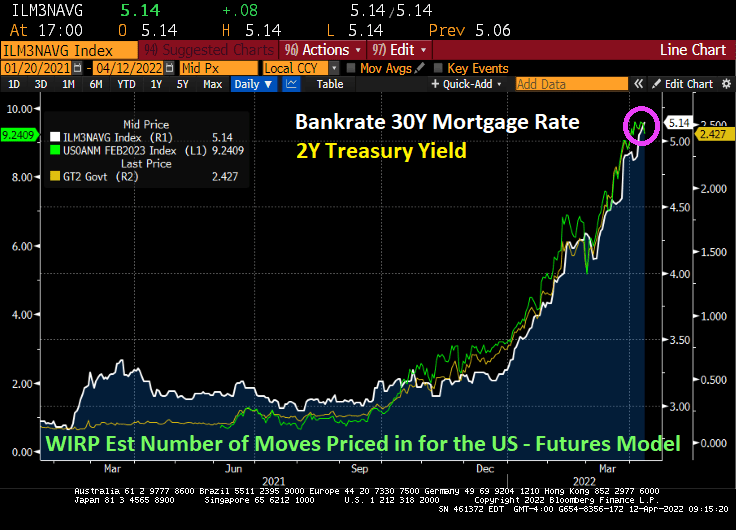
And with The Fed intent on extinguishing their part of the inflation, Bankrate’s 30Y mortgage rate rose to 5.14%.
Energy is the biggest culprit (fuel oil up 70.1% YoY) thanks to the double whammy of 1) Russia’s invasion of Ukraine and 2) Biden’s restrictions on oil and natural gas production. Food at home is up 10% YoY.
Here is a colorful chart of MoM growth in prices.
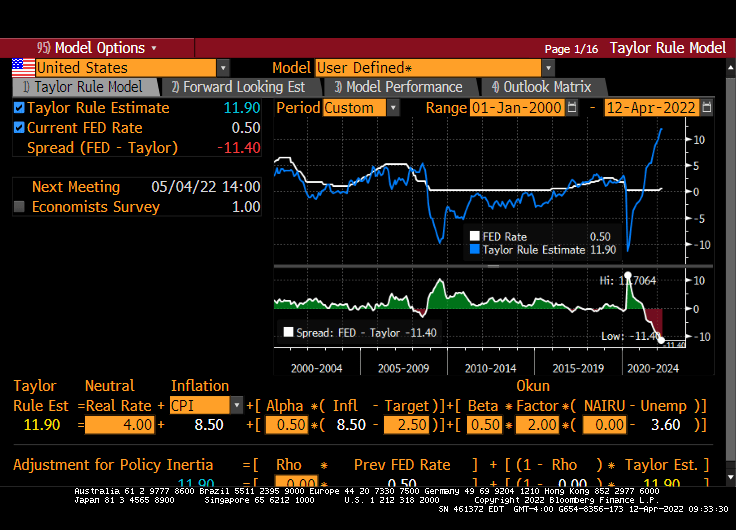
The Taylor Rule model now says that The Fed Funds Target Rate should be 11.90%. Hence, Fed Stimulypto is still in place with the signal that rates will increase.
How about WTI Crude and Brent Crude soaring over 4% today?
Once again, the Four Horsemen of the Inflation Apocalypse (Biden, Powell, Pelosi, Schumer) overstimulated the economy and financial markets with excessive monetary stimulus (Powell) and excessive Federal spending (Biden, Pelosi, Schumer) where demand soared for products and supply naturally hasn’t caught up.
As we are painfully aware, The Fed’s exaggerated monetary flood combined with Federal stimulus spending has led to horrible inflation.
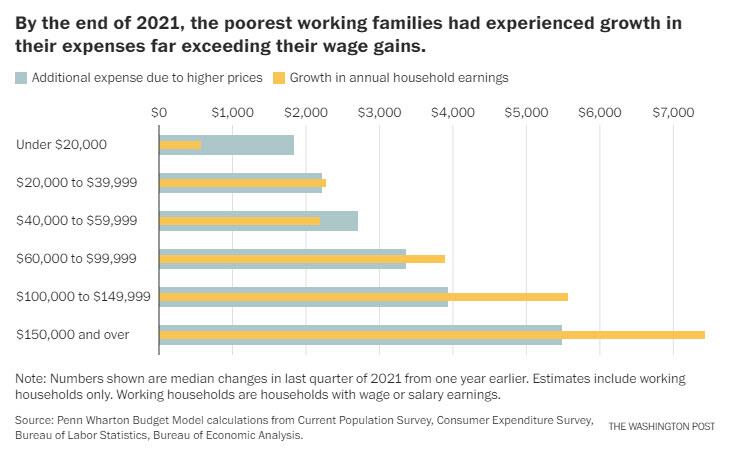
Yes, despite what government talking heads say, Federal stimulus increases demand for goods, the supply is generally slow to respond resulting in rising prices. Then government policies driving up energy prices also leads to highers prices. Throw in Federal Reserve monetary stimulypto and we have this chart from hell from Penn-Wharton. The chart shows that households earning less that $60,000 experience higher expenses due to rising prices than their gain in earnings.
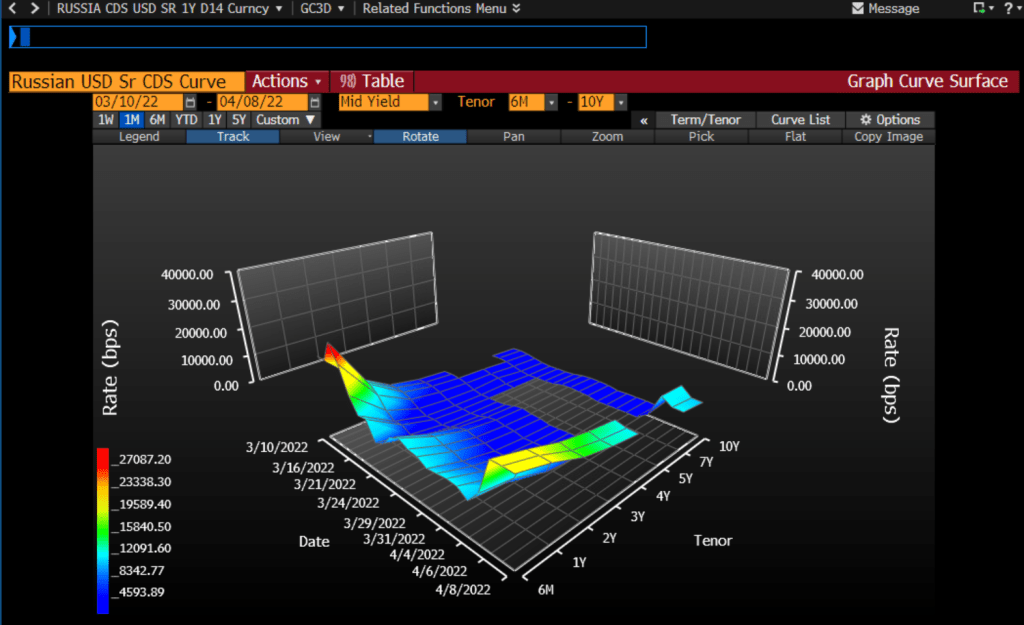
Another chart from hell is the Russian USD Credit Default Swap (CDS) curve. It is spiking at over 20,000.
The one-year Russian CDS is currently at a whopping 20,336 indicating that there is about a 99% of a Russian default over the coming year. As someone who lived through the 1998 Russian credit default scare on Wall Street, this will send a shock wave through credit and Treasury markets.
On the US Treasury front, this chart shows how steeply sloped the US Treasury actives curve has become. Steep until 3 years, then flat. I call this chart “T-Dazzle!” T-Dazzle because I can’t believe how badly the Biden Administration and The Federal Reserve are screwing up the country.
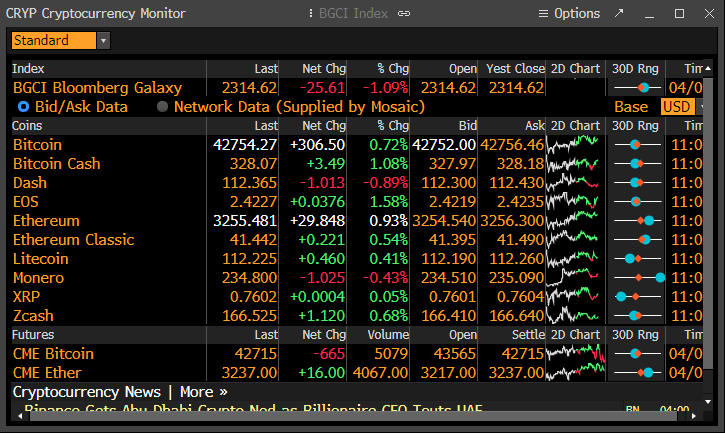
Crude oil? WTI Crude is back to almost $100 per barrel while Brent Crude is at $102.78 per barrel. Wheat is up 3.22% thanks largely to problems related to Russia invading Ukraine (Europe’s bread basket) and a dismal Chinese wheat harvest.
Cryptocurrencies, the alternatives to the US fiat dollar, are rising (in particular, Bitcoin and Ethereum).
Of course, I have to finish up with the soaring 30-year mortgage rate.
As the US Treasury 2-year yield hits 2.507% (up from 0.128% when Biden was installed as President) and the number of Fed rate hikes over by February 2023 hits 9.6, Bankrate’s 30-year mortgage rate breached the 5% mark at 5.04%.
The most recent data from on existing home sales show YoY sales in negative territory as The Fed begins in monetary fireball tightening.
St Louis Fed’s Bullard said The Fed is “behind the curve.” Ya think??
The Fed’s minutes from the most recent meeting indicates that The Fed will shedding $95 billion a month from it swollen balance sheet. At almost $9 trillion mostly populated by Treasuries will be the first asset to run-off the balance sheet (there is almost $1 trillion of Treasuries maturing in 2022 and $856 billion maturity in 2023, etc), The Fed plans to shrink the balance sheet while, at the same, raising The Fed Funds target rate from it near zero levels.
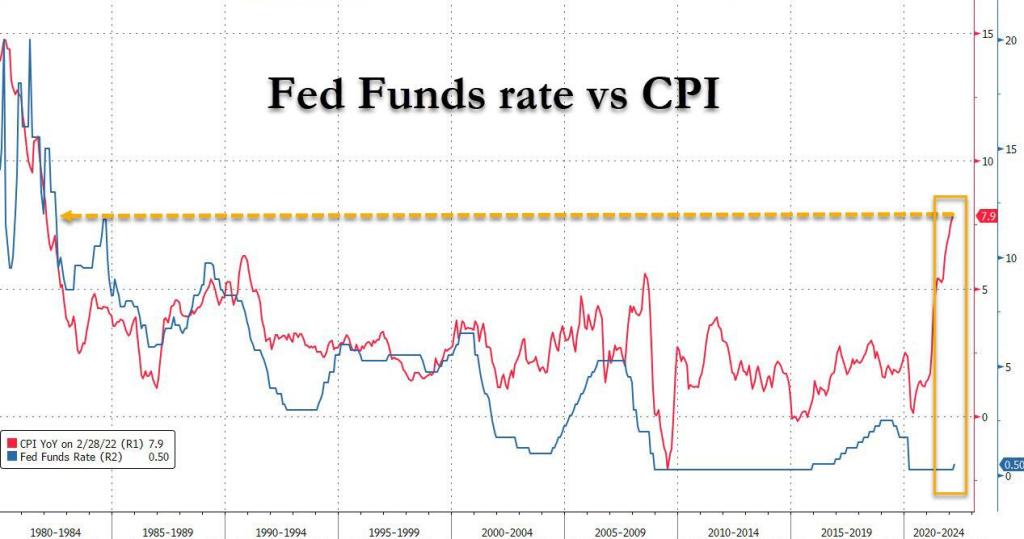
The Federal Reserve has ignoring rules like the Taylor Rule since the financial crisis of 2008-2009, but seemingly are paying attention to the Taylor Rule because of 7.9% inflation. The Taylor Rule is suggesting a 20.42% Fed Funds target while the current target rate is 0.50%. Now THAT would be a real shock to the economy.
The 10-year Treasury term premium, the amount by which the yield on a long-term bond is greater than the yield on shorter-term bonds, remains steeply negative (white line) as The Federal Reserve steps up its attack (aka, monetary tightening). Meanwhile, the 10Y-2Y curve actually rose into positive territory.
Historically, the 10-year Treasury Term Premium declines before a recession.
Meanwhile, 3 month Treasury bill to Overnight Indexed Swaps spread is crashing to the lowest level since 2017.
But with inflation raging at the fastest pace in 40 years, the REAL 10-year Treasury yield remains negative at -5.236% while the REAL 30-year mortgage rate is -3.01%. Both were in positive territory when Biden was installed as President.
Speaking of interest rates, the infamous PIGS (Portugal, Italy, Greece, Spain) are all seeing surges in their 10-year sovereign yields. Sweden, while not a PIG has the largest spike today at 13.8 BPS.
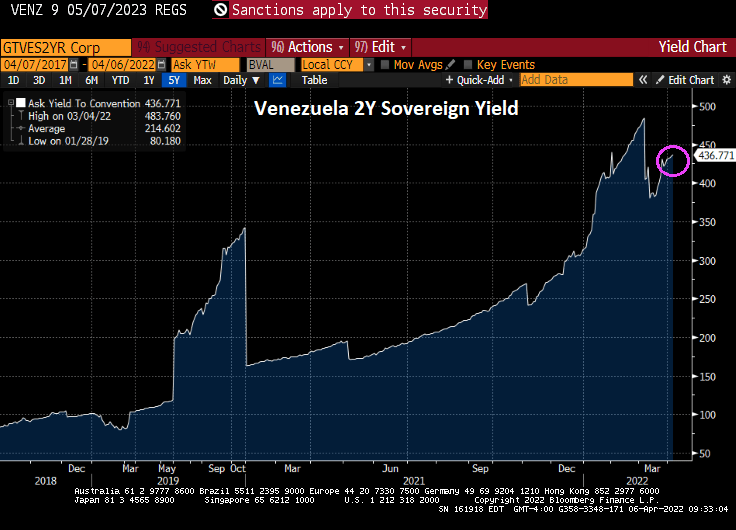
Actually, the biggest spike in sovereign yields occurred in Ukraine where their 2-year yield popped +205.8 BPS. But Lebanon has the highest 2-year yield at 162.29%. Turkey is in third place in the sovereign demolition derby at 23.52%. Sadly, Poland’s 2-year yield is up 16 bps today.
But the winner of the sovereign debt demolition derby is …. drumroll … VENEZUELA! At 436.77%.
I am really surprised that Biden hasn’t adopted Maduro’s fashion sense.
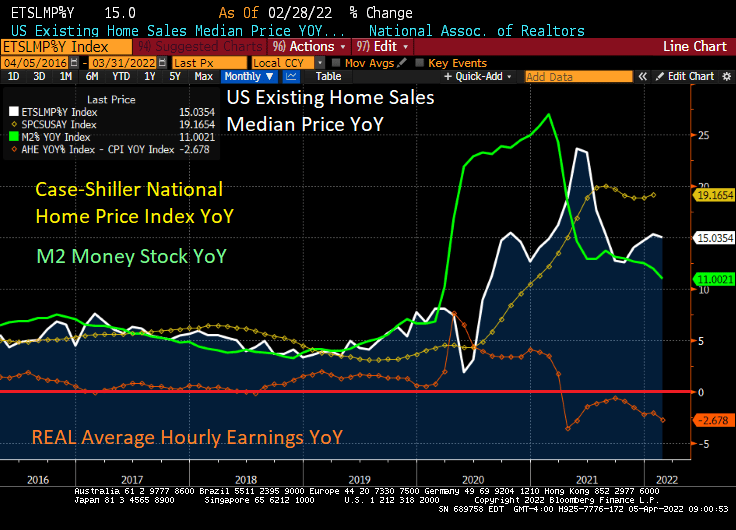
CoreLogic’s Home Price Insights revealed that home prices rose 20% YoY in February despite REAL average hourly earnings declining -2.678% YoY. THAT is euphoria! Or Stimulypto, as I like to call it.
No, The Federal Reserve still hasn’t removed its staggering monetary stimulus. Notice that M2 Money Stock is still growing at a torrid 11% pace.
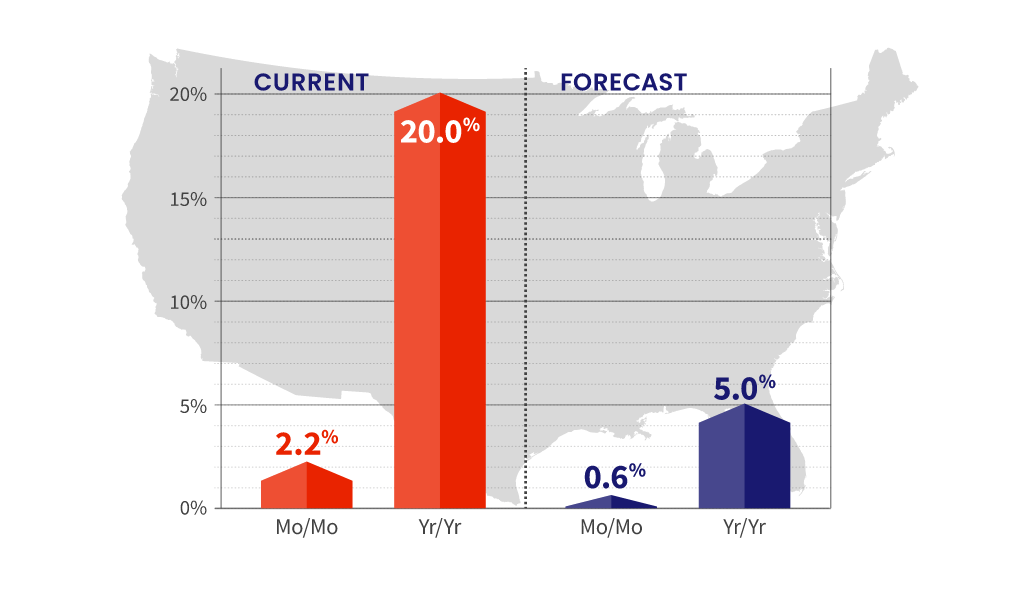
20% YoY home price growth in February? CoreLogic has increased their forecast of home price growth to 5%, likely because The Federal Reserve is imitating a sloth in removing its monetary Stimulypto.
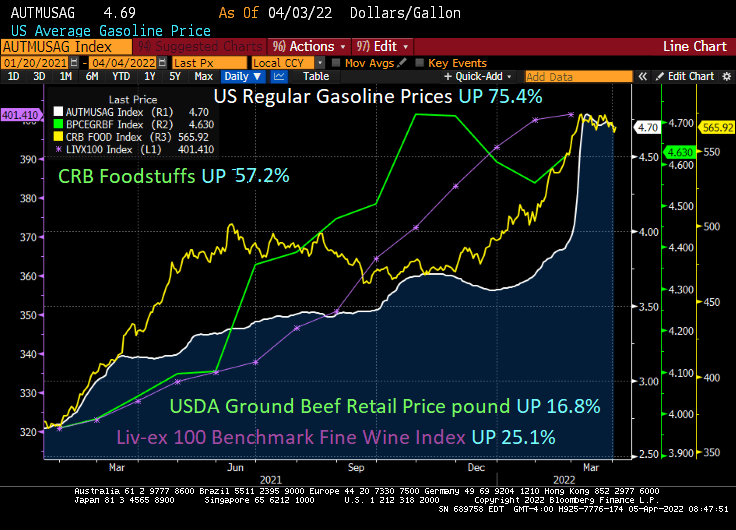
Of course, there are other assets growing at lightning speeds. US Regular gasoline prices are UP 75.4% under Biden. Foodstuffs are UP 57.2% since Biden was installed as President. At least ground beef is only up 16.8% while the fine wine index is up 25.1%.
Speaking of wine,Hitching Post II in Buellton, CA must be suffering from rising food and grape costs too (I highly recommend eating there and using their HP Magic Stuff at home). Not to mention their spectacular wines. Roast artichokes anyone??
Its official! I submitted my resignation from George Mason University effective June 1, 2022. I will miss teaching the students, past and present.
But back to the US Treasury yield curve. It remains in reversion (meaning shorter-term Treasuries have higher yields than longer-term Treasuries, usually a sign of impending recession. The Fed has actually started quantitative tightening (QT) and the growth rate of Treasury note and bond purchases has slowed to a crawl.
Meanwhile, Bankrate’s 30-year mortgage rate rose slightly to 4.91%.
Meanwhile, President Joe “The Big Guy” Biden has ordered carmakers to increase their average fuel economy to about 49 miles (78.8 kilometers) per gallon by 2026. Of course, this is intended to kill-off gasoline-powered autos and make all cars electric or hybrid like the Toyota Prius.
This can be the Democrat’s midterm election slogan: “Making living in the USA unaffordable!”
The middle-class unaffordable Ford F-150 Lightning at nearly $100,000. Thanks Joe!
Alternatively, you can buy a Buick Envision (made only in Shanghai China) with up to 24 city / 31 highway MPG. Well, kiss that baby goodbye under Biden’s new MPG mandate.
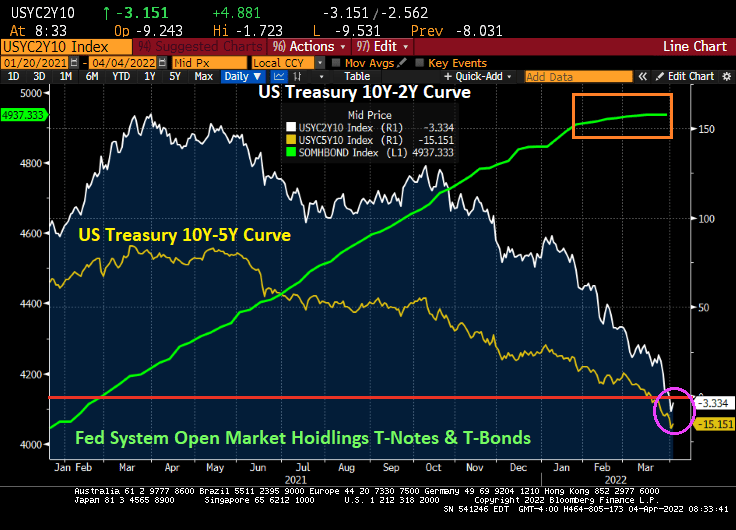
Consider what has happened since President Biden was elected. The S&P 500 total return index (green index) has risen thanks to The Federal Reserve’s balance sheet expansion (orange line) with COVID. Until 2022 when the expectation of Fed rate hikes surged from 3 in late December 2021 to 9.4 expected rate hikes over the next 12 months (yellow line).
The US Treasury total return index (white line) has gotten crushed with The Fed’s signals of rate hikes and quantitative tightening (QT). Call it “White Line Fever.” The commodity total return index (blue line) has surged as The Fed’s expected rate hikes have risen from 3 to 9.4 in 2022.
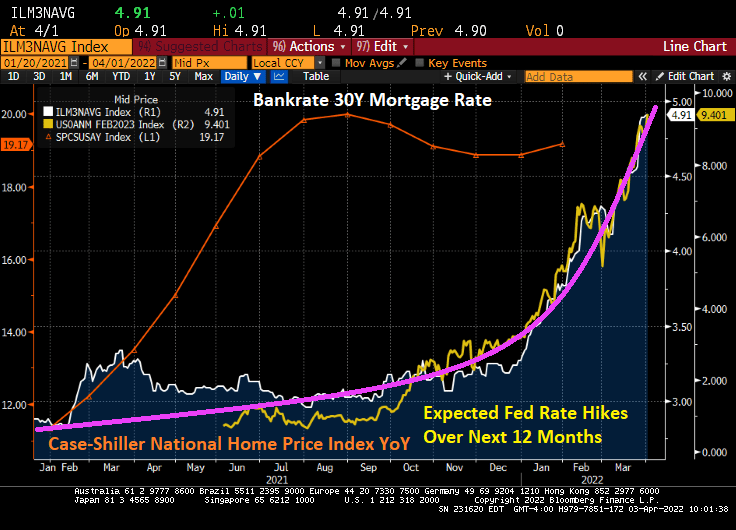
Is The Fed causing a Great Reset in housing? In 2022, we see the surge in Fed rate hike expectations leading the 30-year mortgage rate to be nearly 5%. The last Case-Shiller home price index was for January and it was still raging at 19.17% YoY growth. Let’s see if The Fed’s QT will slow down home price growth. But home prices are growing at 4x 30-year mortgage rates.


You must be logged in to post a comment.