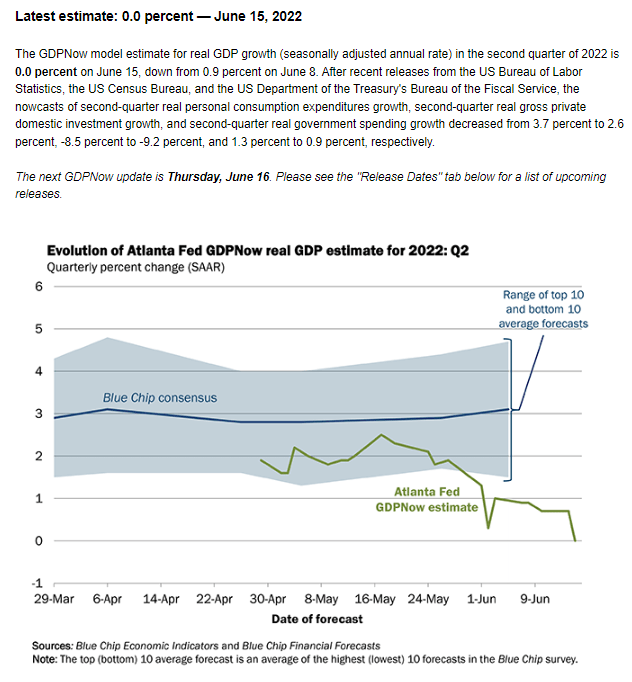
US home prices are still skyrocketing as The Federal Reserve kept its massive foot on the monetary accelerator pedal.
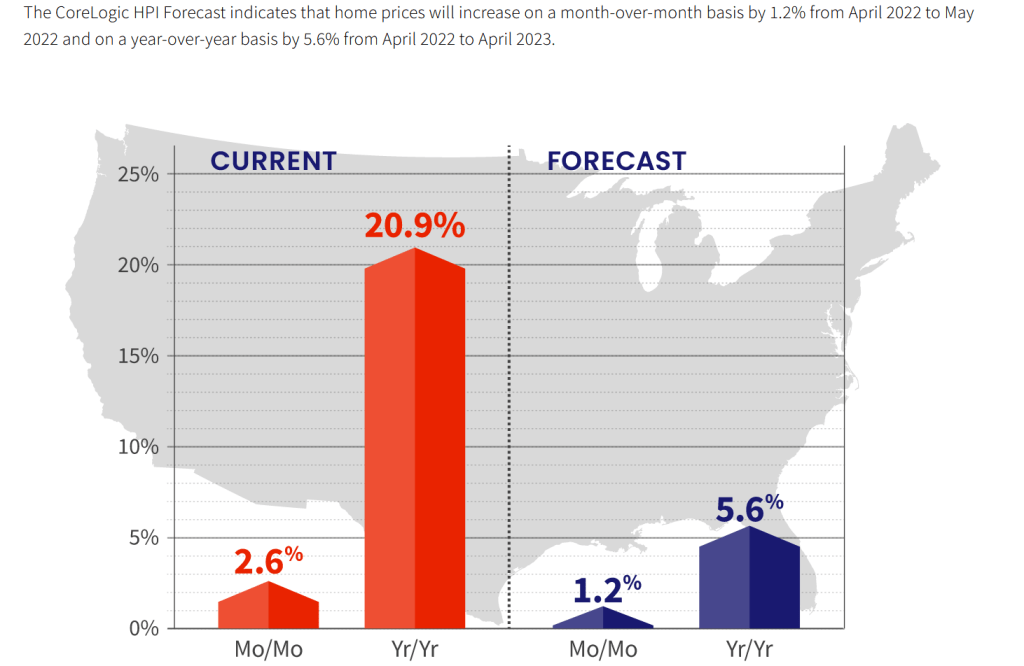
CoreLogic’s home price index grew at a 20.9% YoY pace in April, but is expected to slow to 5.6% YoY in late 2022.
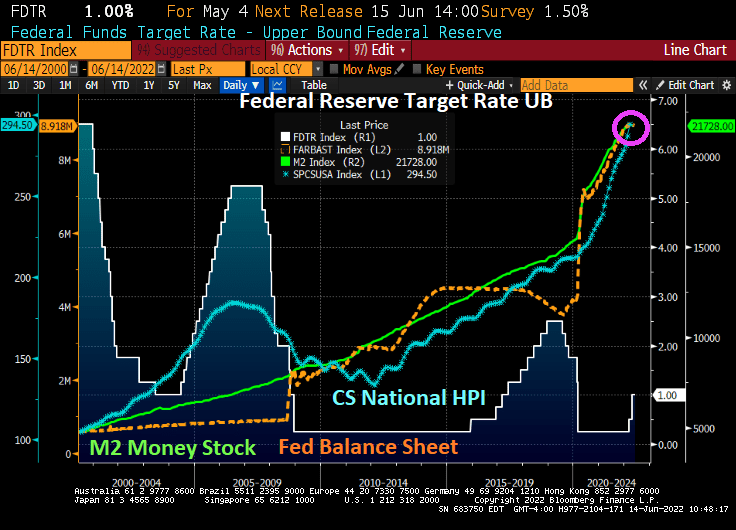
Remember peeps, The Fed still have its staggering monetary stimulypto in place.
The Fed is signaling its withdrawal of stimulus, causing mortgage rates to soar.
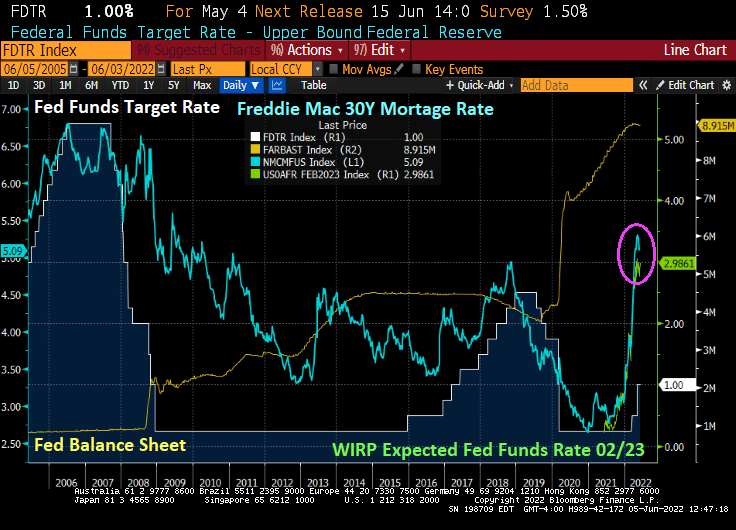
Given the slowdown of the US and global economy, we shall see if The Fed keeps to its tightening plans. As of today, the market is expecting The Fed to raise its target rate from 1% to 3.819% by February 2023. That is a 291% increase in The Fed’s target rate.ng
The Fed trying to tame inflation (caused by The Fed and Biden’s energy policies and Congressional spending) is like Curly trying to eat oyster stew.
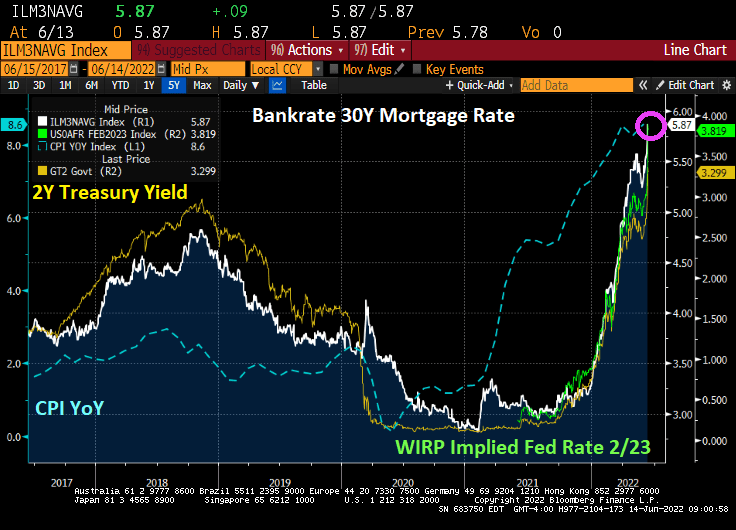
The US Treasury 10Y-5Y yield curve has gone into negative territory (which usually occurs before a recession). At the same time, US mortgage rates are climbing like Tom Cruise in “Top Gun: Maverick” to 5.87% as The Fed tightens its choke hold on markets.
The 10Y-5Y Treasury curve typically goes negative before a recession.
And then we have today’s PPI report (Producer Price Index), rising 10.8% YoY as M2 Money stock starts to decline a bit.
Here is a better view of mortgage rates under Biden/Powell.
The Federal Reserve is making up for Bernanke and Yellen’s “too slow to remove” Fed stimulus policies (QE1 – QE3) and Powell’s Covid-related QE4. Now The Fed is trying to remove the stimulus in a (misguided) attempt to cool inflation. Remember, the dramatic rise in prices was caused by more than Fed stimulypto, it was also caused by Biden’s executive orders driving up oil, gasoline and natural gas prices and the massive Federal spending bills signed by Biden.
The result of The Fed’s jawboning about undoing Fed stimulypto is take away the punch bowl. But the results are troubling. Both the total return indices for US Treasuries and Agency Mortgage-backed Securities (MBS) have declined dramatically since inflation has been rising (highest in 40 years) and The Fed is expected to crank their target rate by February 2023 to 3.448% (The Fed Funds Target Rate currently stands at 1%). That is almost a 250 basis point rise in the target rate in 8 months.
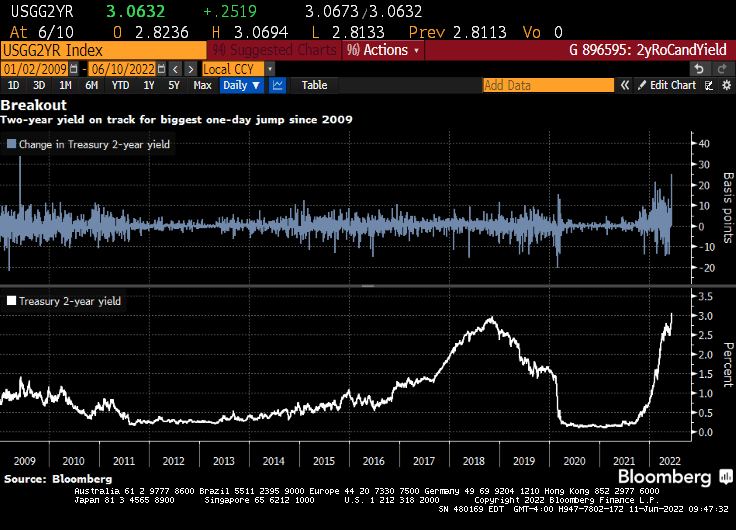
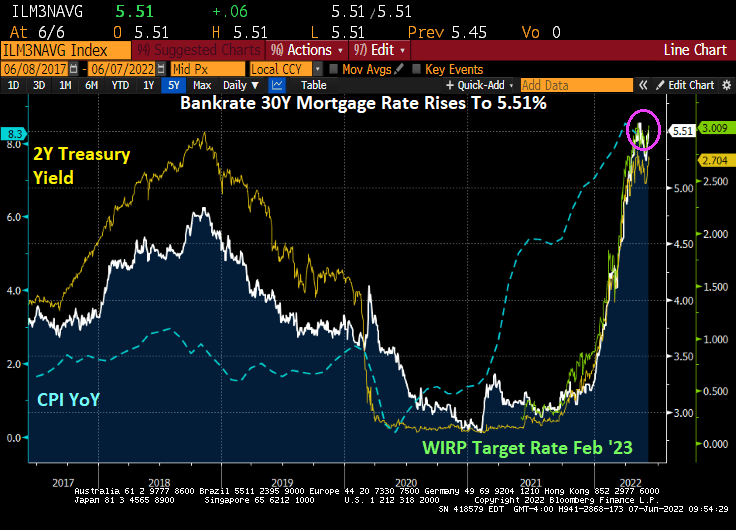
While the 10-year rate is rising rapidly, the 2-year Treasury yield is REALLY rising fast.
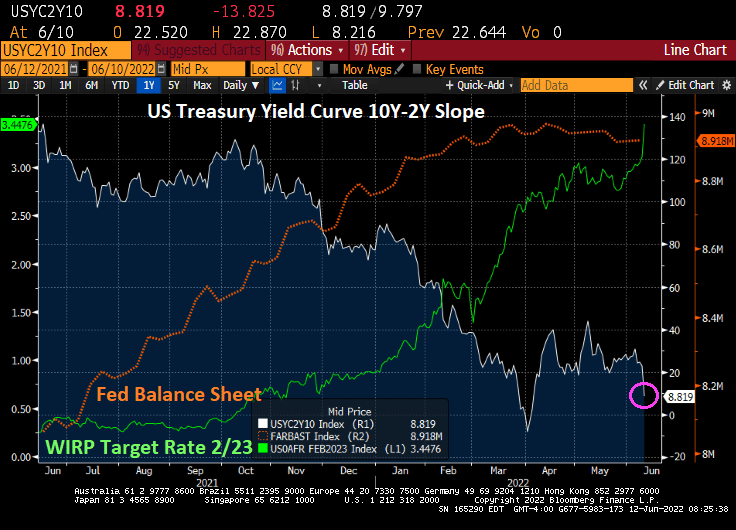
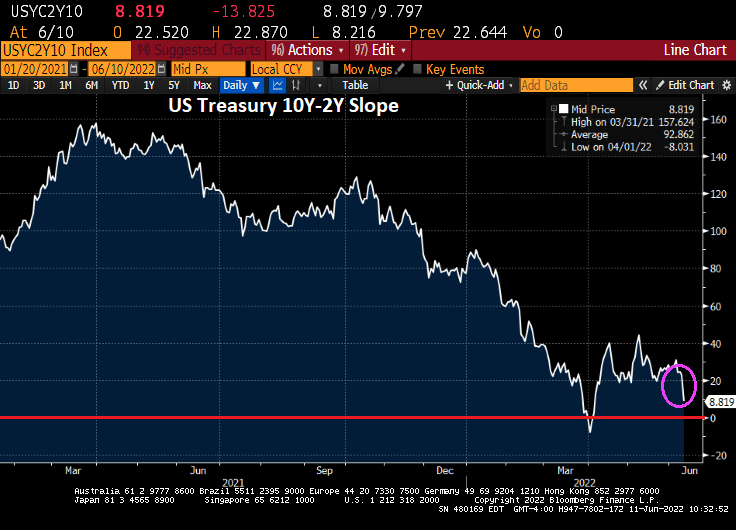
And the yield curve (10Y-2Y) is down to +8.819 basis points as The Fed signals tightening.
And with rising 10 and 2Y Treasury yields, we are seeing the fastest rise in mortgage rates since 1981.
The CPI news on Friday was so awful that it changed the bond market’s view of Fed trajectory, and the weakest sector broke. In bond jargon, MBS went “no-bid.”No buyers for MBS. Then a few posted prices beyond borrower demand, not wanting to buy except at penalty prices. (Courtesy of Cherry Creek Mortgage)
Despite what Treasury Secretary Janet Yellen has said, Friday’s inflation report demonstrated that inflation is no longer transitory. And with that realization, there was a dearth of bidders for Agency Mortgage-backed Securities (Agency MBS) on Friday.
As a result, agency MBS 2.5% dropped to under $90 as markets expect The Fed to keep raising rates to combat inflation.
Duration of the FNCL 2.5% agency MBS has been extending with growing inflation. Duration was under 1 on August 2, 2021 but is now 7 times greater at almost 7.
Note to Yellen: inflation seems be permanent, not transitory. Or at least inflation will remain high for the foreseeable future, crushing the life out of Agency MBS.
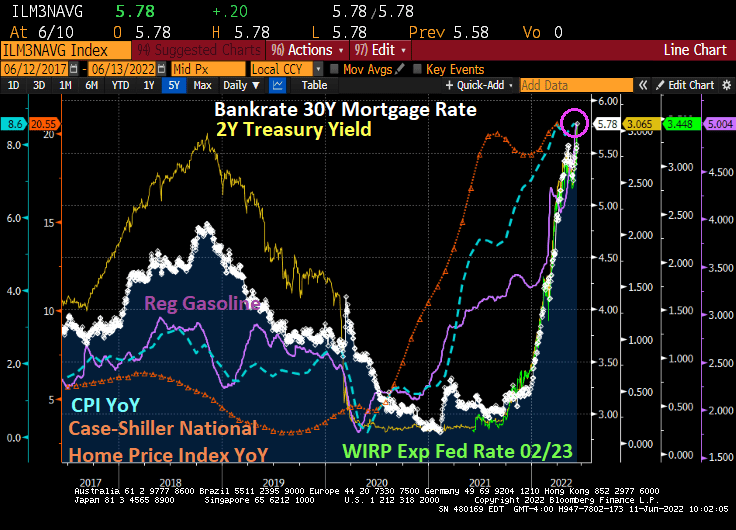
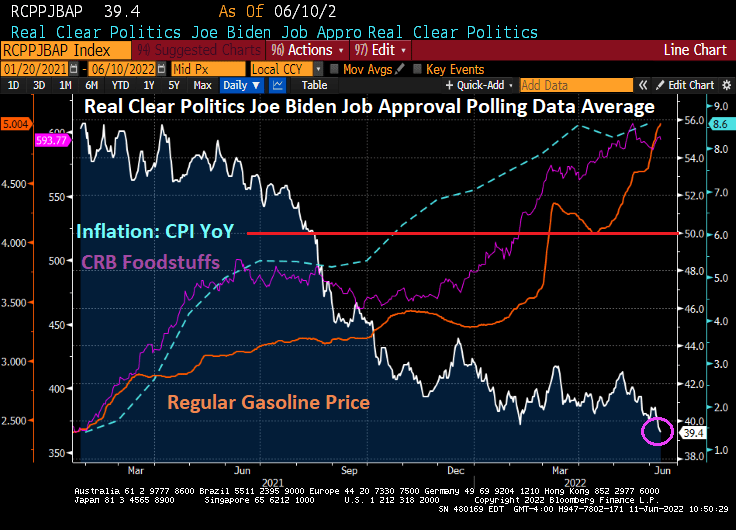
Regular gasoline prices have breached the $5 a gallon barrier, the highest in recorded history. And it is even worse in states like California where regular gas prices have been above $7 per gallon.
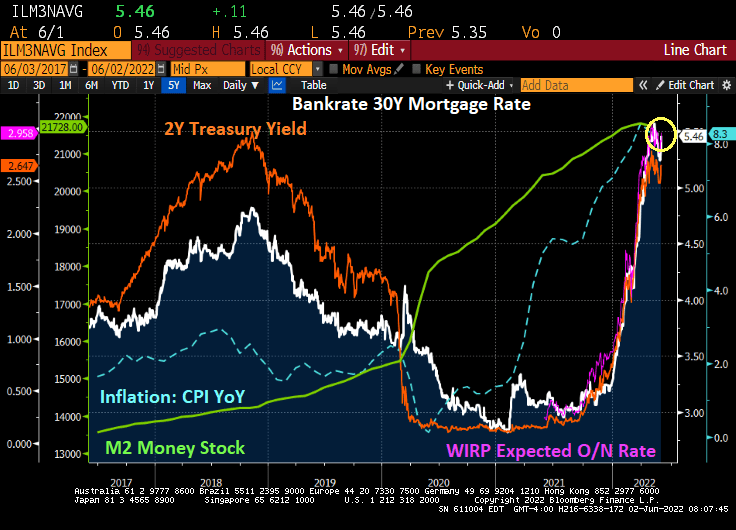
Bankrate’s 30-year mortgage rate is now 5.78%, the highest since 2008. And rising really fast as The Fed tightens the monetary noose.
Speaking of noose tightening, the 2-year US Treasury Note yield is rising awfully fast.
The US Treasury 10Y-2Y curve slope just flattened to 8.819 bps and challenging the 0% grade awfully fast.
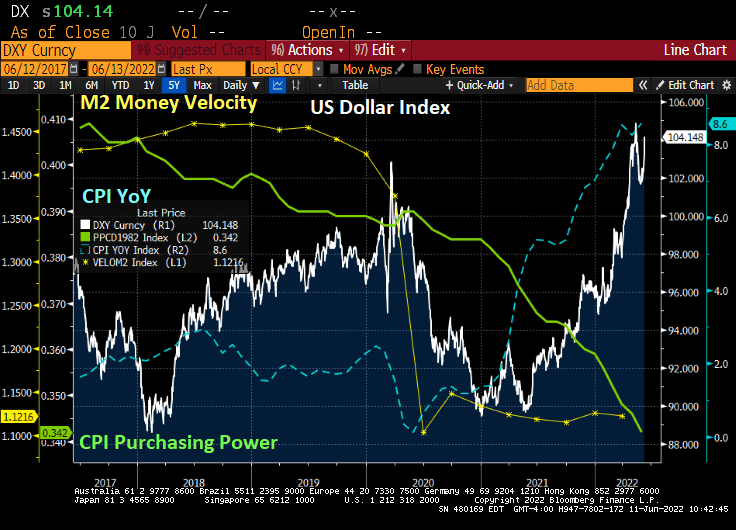
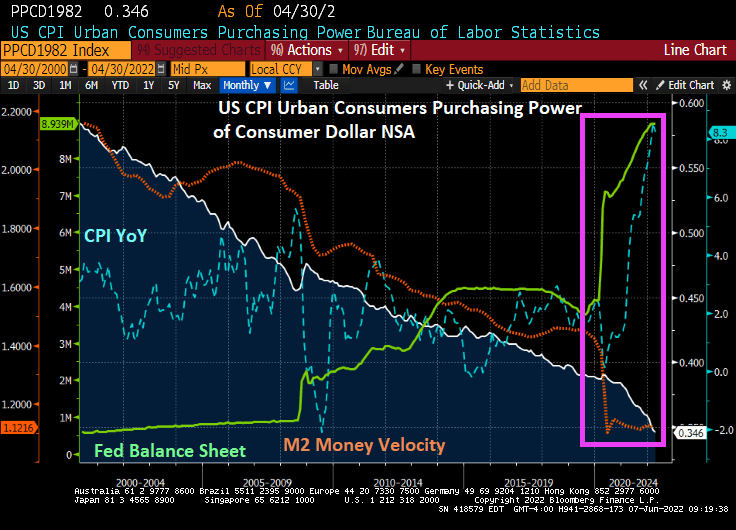
The US Dollar is soaring as US inflation soars, consumer purchasing power (green line) collapses along with M2 Money Velocity.
There is little doubt that soaring inflation, gasoline and food prices have hurt Biden’s popularity as well as the Democrats popularity ahead of the upcoming mid-year elections. People for the most part vote with their wallets.
According to estimates by Bloomberg Economics, US households will spend $5,200 more this year than they did last year on the same consumption basket.
That breaks down to $433 extra in expenditures every single month. That is what is called “the inflation tax.” And it hurts.
Here is my version of their chart since 2000 where you can seen the seismic shift in the balance sheet (toxic green slime line), particularly with The Fed’s response to Covid. The Fed is signaling a tightening in monetary policy to help reduce inflation (blue line).
But notice that M2 Money Velocity (GDP/M2) is now near the all-time low along with consumer purchasing power.
How BIG is The Fed’s balance sheet? Try more that a third of size of US GDP.
And as The Fed signals its inflation-fighting intentions, mortgage rates have shot up to 5.51%, the highest mortgage rate since June 2009.
Meaning that The Fed has kept monetary stimulus in play for too long since late 2008 helping to lower mortgage rates from over 6% in November 2008 to 2.98% in November 2021. Then came “The Missouri Boat Ride” as The Fed signaled monetary tightening, leading to mortgage rates skyrocketing to their highest level since 2010.
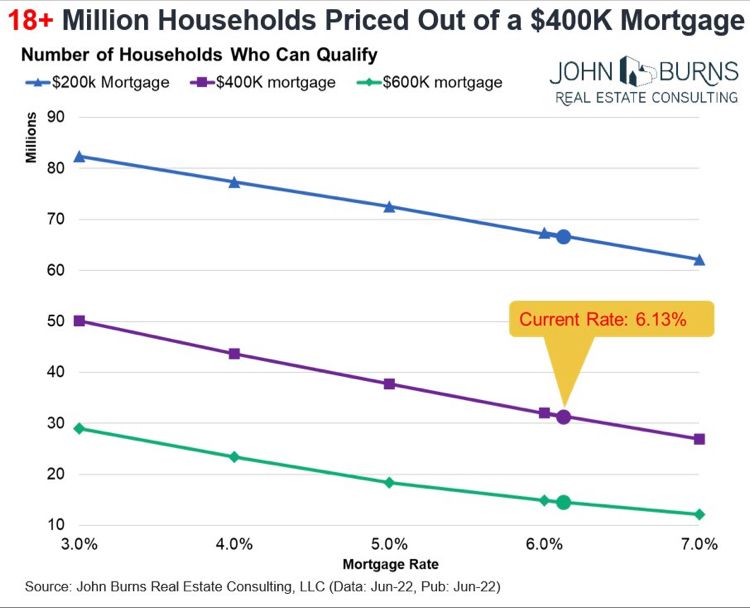
The result of rising home prices AND mortgage rates? Housing acquisition prices (home prices * 30 year mortgage rates) have skyrocketed.
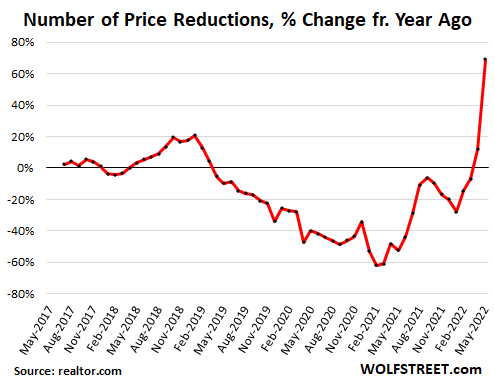
Between rising home prices and rising mortgage rates, we see that number of prices reductions increasing at nearly 70% YoY (chart courtesy of WolfStreet.com).
Of course, Congress and the media will never ask Janet Yellen (former Fed Chair [2013-2018] and current Treasury Secretary) WHY she kept massive monetary stimulus around for so long. Or why current Fed chair Powell did the same with Covid-related monetary stimulus.
Instead of President Ronald Reagan saying ““Mr. Gorbachev, tear down this wall” we need someone to tell President Biden and Federal Reserve Jerome Powell to “Stop driving up prices and making housing unaffordable.” Unfortunately, The Fed thinks that raising interest rates will temper price increases — it won’t. But it could tamper home price growth.
So what we are left with is soaring home prices AND soaring mortgage rates, leaving this scary chart. The housing cost index has risen 114.5% under Biden.
Its only going to get worse from here.
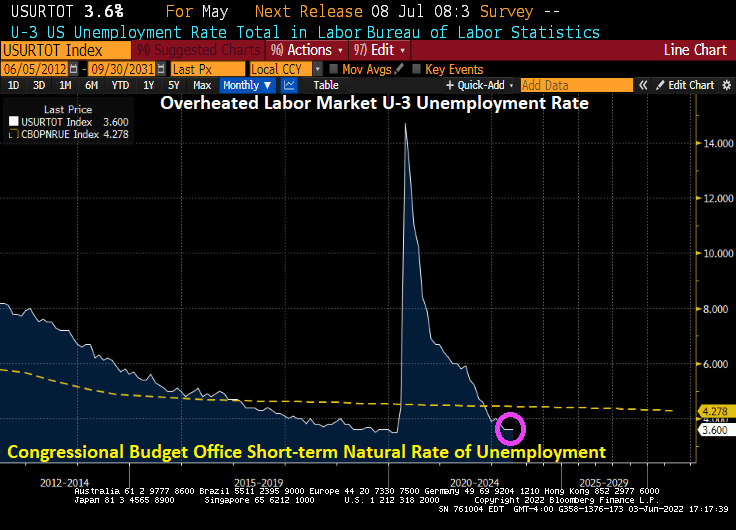
Today’s jobs report for May showed that the U-3 unemployment rate remained the same as April, 3.60%. However, that is lower than the NATURAL rate of unemployment of 4.445% indicating that the labor market is overheated. Historically, The Fed has tightened monetary policy by raising rates when this has happened. So, look for The Fed to keep raising rates.
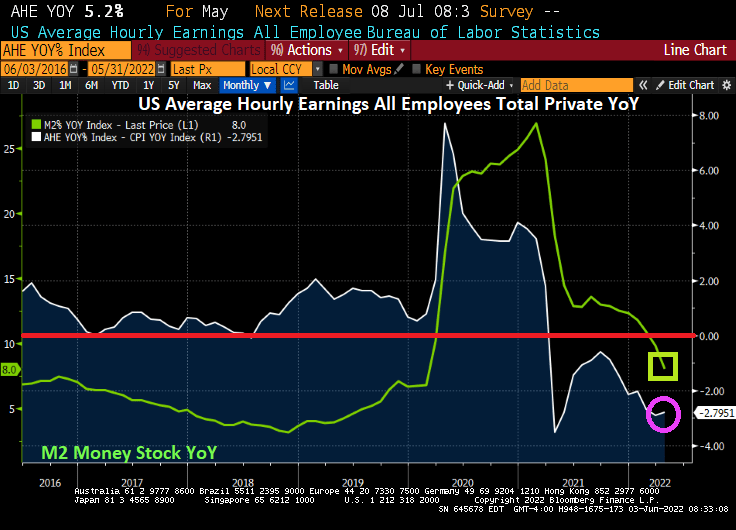
As I have mentioned before, REAL hourly wage growth is negative since March 2021, just after Biden signed his executive orders canceling drilling on Federal lands and cancelling the Keystone Pipeline. Later, he canceled off-shore drilling permits and Alaska drilling. Now we have REAL average hourly wages declining at -2.8% YoY as The Fed has been reducing M2 Money supply YoY.
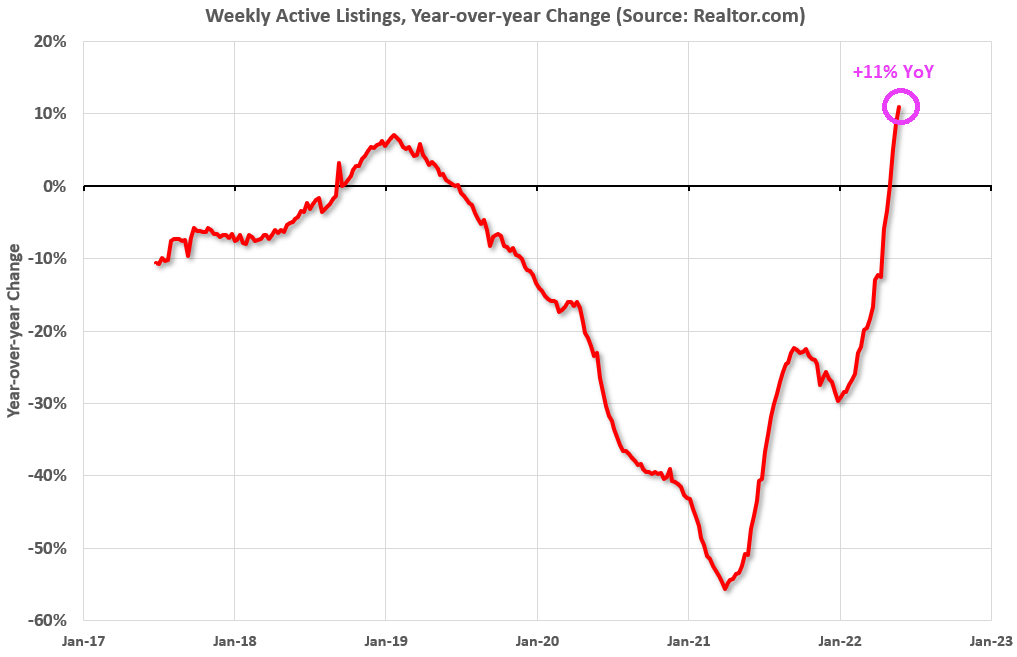
Listings of homes is up 11% YoY, the highest in several years.
Let’s see how the housing market does with soaring mortgage rates.


You must be logged in to post a comment.