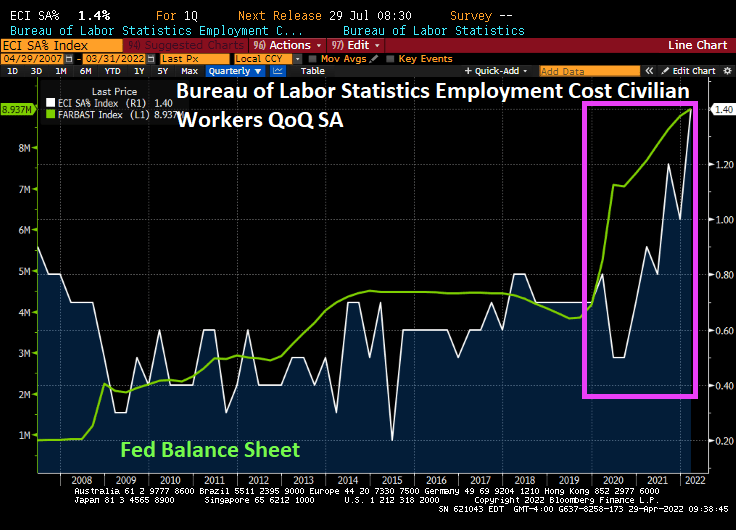
Not only has The Federal Reserve driven M2 Money Velocity to near historic lows, but now we find out that the Employment Cost Index just rose to a historic high.
Of course, a variety of minimum wage laws have helped drive up employments costs. Don’t tell lawmakers that minimum wage laws lead to higher inflation since they typically deny responsibility for anything. But I can almost picture the 4 Horsemen of the Inflation Apocalypse (Powell, Biden, Pelosi, Schumer) sitting around asking “What we can do to make inflation worse?”
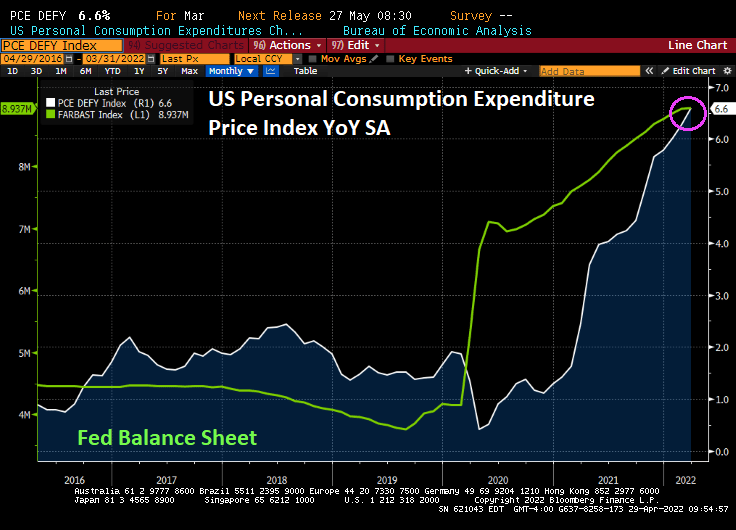
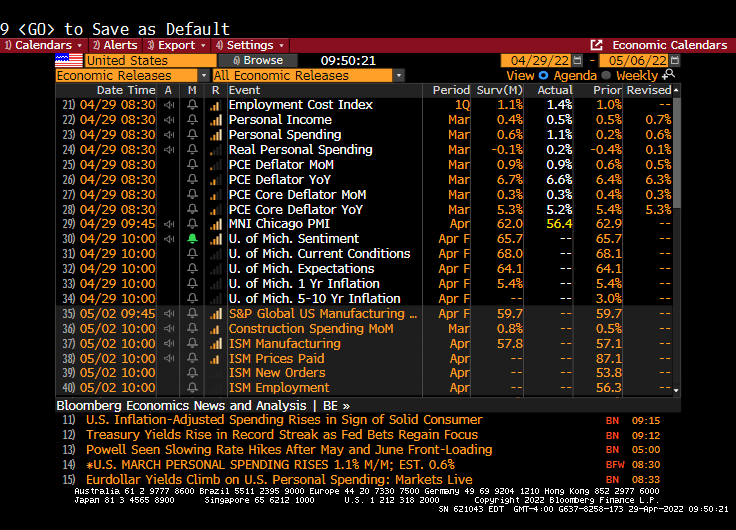
We did see the PCE Deflator YoY rise to 6.6%, the highest since 1982, the highest in 40 years.
Personal spending increased to 1.1% in March, probably panicking buying over further inflation.
A PCE Deflator of 6.60% leads to a Taylor Rule estimate of 9.05% for The Fed Funds Target Rate.
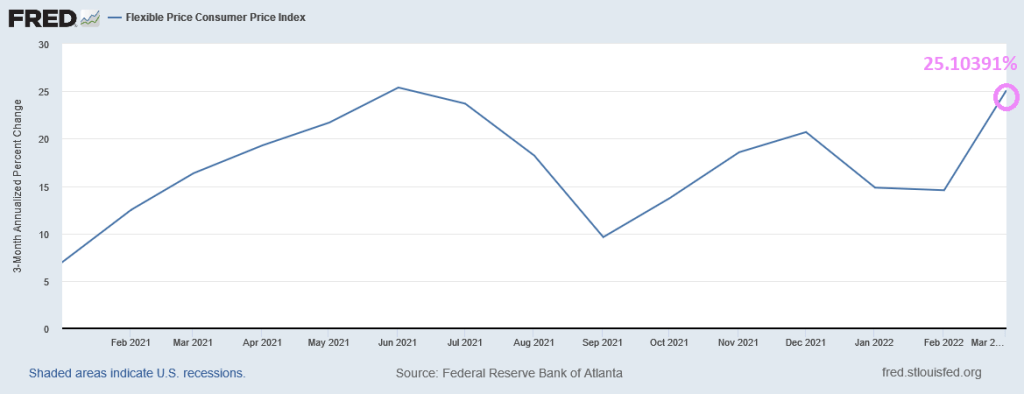
While headline inflation is growing at 8.6% YoY in March, flexible price inflation grew at a terrifying 25% YoY rate.
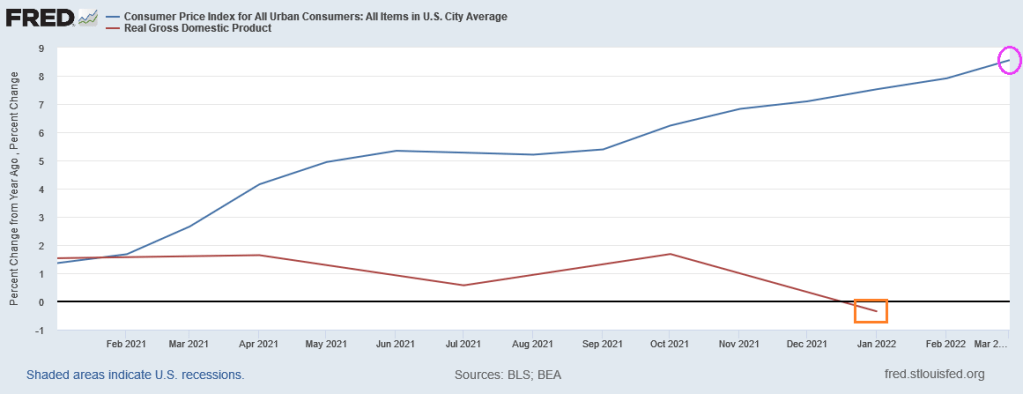
Even with headline inflation of “only” 8.56% YoY, today’s Q1 real GDP growth checked in at -1.4% QoQ. Clearly, Bidenflation isn’t help the economy or anyone else.
Diesel prices have skyrocketed under Biden.
Instead of Shoeless Joe, we have Clueless Joe as President.
Particularly if you are a pension fund and hold US Treasuries and Agency Mortgage Backed Securities.
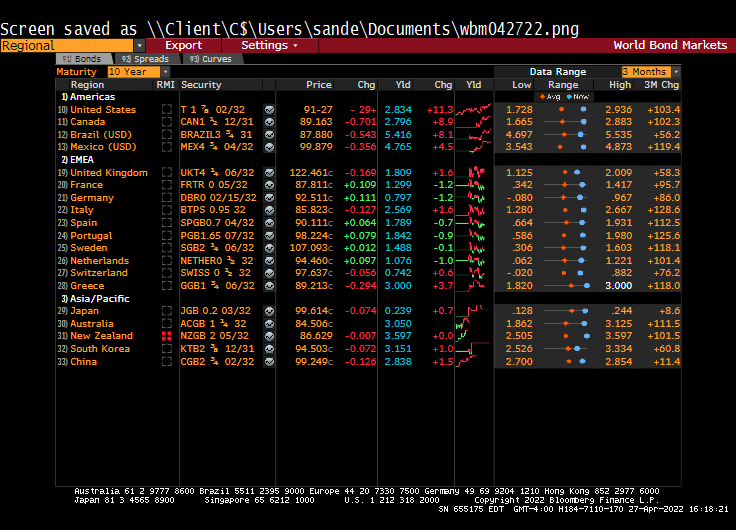
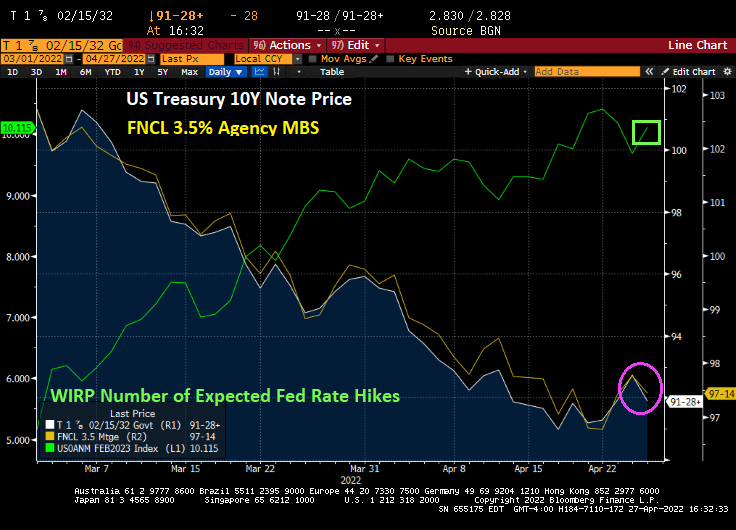
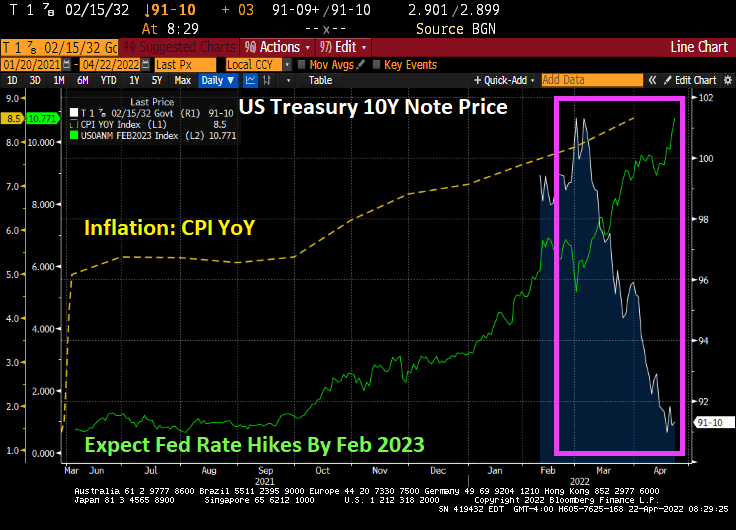
The bad news is that the 10-year US Treasury Note declined in price, sending the yield up over 10 bps today.
As The Fed is projected to raise its target rate over 10 times by February 2023, 10-year Treasury Note prices and agency MBS 3.5% prices continue to decline.
Heartaches in heartaches. US GDP growth for Q2 has stumbled to 0.446% as The Fed is launching quantitative tightening (QT) to fight the inflation that they caused in the first place.
According to the Atlanta Fed’s GDPNow real-time GDP tracker, US GDP growth has stumbled to a meager 0.446%. Despite the massive stimulus from The Federal Reserve and Washington DC’s massive fiscal stimulus.
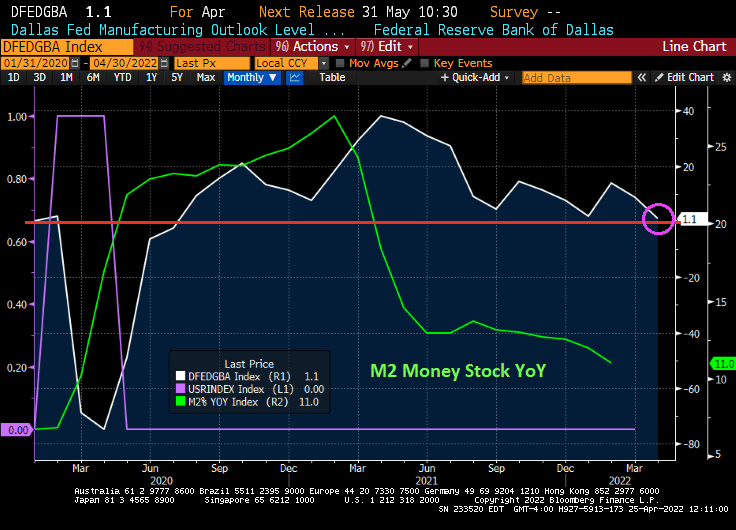
M2 Money stock YoY skyrocketed during the Covid mini-recession, peaking at 21% during February of 2021. The Dallas Fed manufacturing outlook grew to 38.1 in March 2021.
However, as M2 Money growth has slowed 11%, the Dallas Fed manufacturing outlook has plunged to near zero.
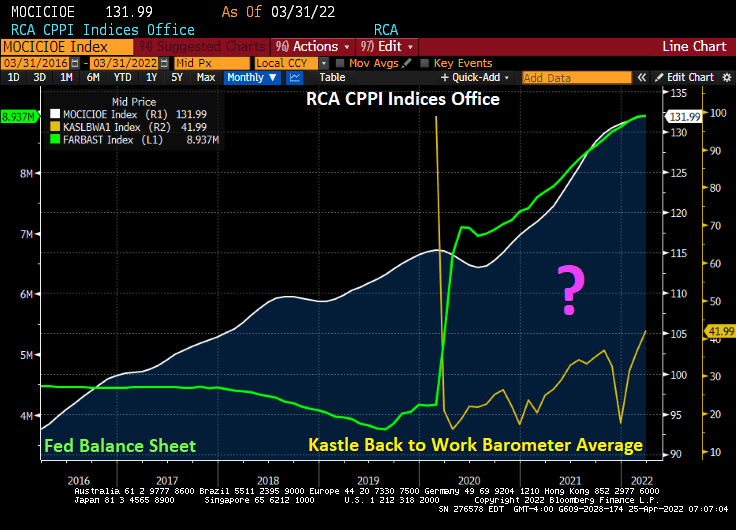
Do you want to see a magic trick? Like how governments shut down the US economy resulting in collapsing office occupancy rates while the price of office buildings rose dramatically (+16.3% since Q2 2020)?
Kastle’s “Back to work barometer” is showing that the 10 city average occupancy rate in the US is now only 42.8% as remote working has caught on. And the fear of yet another Covid mutation is keeping office occupancy below 50%.
Even Washington DC, home of Dr. Anthony Fauci, has only a 37.5% occupancy rate. Of the top 10 cities, Austin TX has the highest office occupancy rate at 62.4%.
So, the magic trick is not why America is so slow to return to the office, but why commercial office prices are rising so fast. Ah, Federal government STIMULYTPO! Aka, The Federal Reserve has been overstimulating the economy since 2008 and particularly since 2020 and Covid.
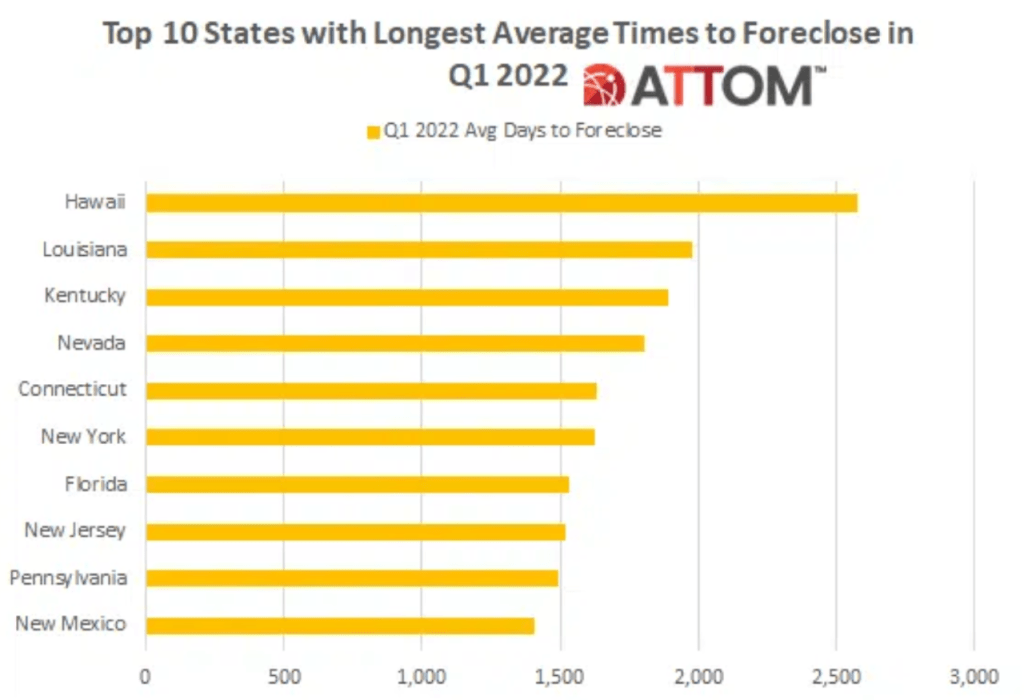
Speaking of a magic trick, here is how government’s make the average time to foreclosure up to over 7 years in Hawaii and 4.4 years in New York. In simple terms, you can buy a home in New York, never make a mortgage payment and live rent free for an average of 4.4 years.
So, the government’s magic trick is to 1) shut down local economies in fear of Covid, 2) provide excessive fiscal and monetary stimulus to combat the shutdown, 3) watch office building prices soar with stimulus as office occupancy remains below 50%.
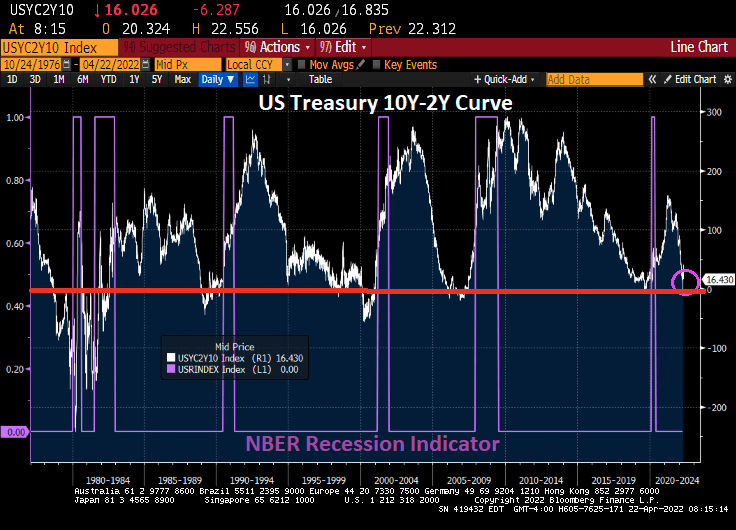
Do you want to see a magic trick? Watch The Fed try to tighten monetary easing and NOT crash the economy.
Update for 04/25/2022. 10Y Treasury yields DOWN 8.7 bps.
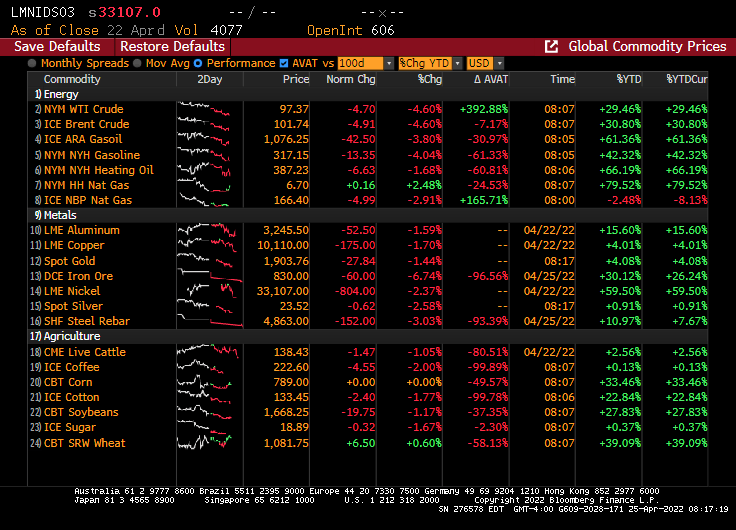
And commodities are tanking. WTI oil is down 5%, iron ore is down almost 7%.
And the Dow is diving with increased expectations of Fed monetary tightening, but the expectations (green line) have been declining this morning.
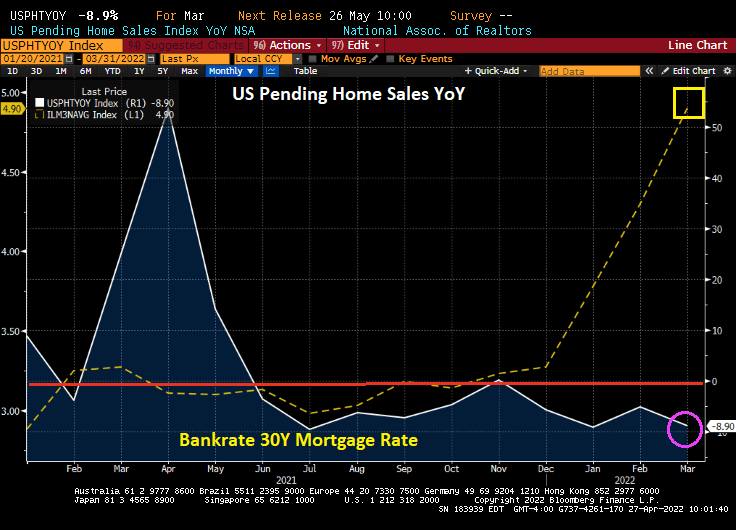
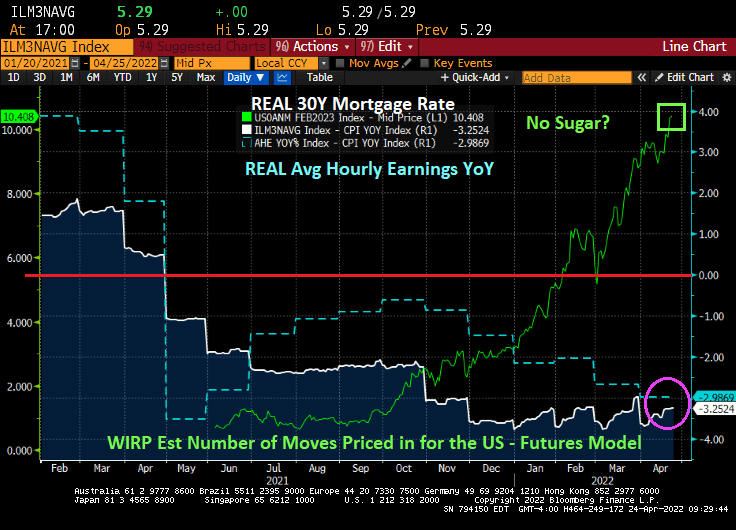
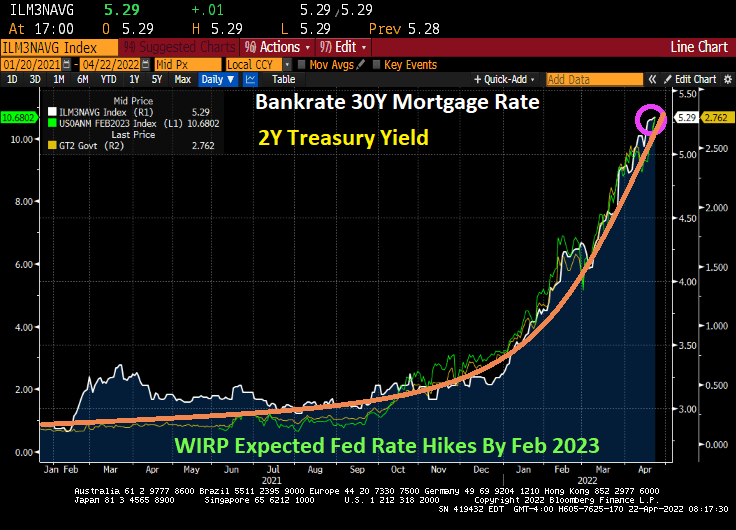
As The Fed sings “No sugar tonight” exemplified by the number of expected Fed rate hikes by February 2023 has grown to 10.4. Mortgage rates are now the highest since 2009, but inflation is the highest in 40 years. The result? The REAL 30-year mortgage rate is -3.25%.
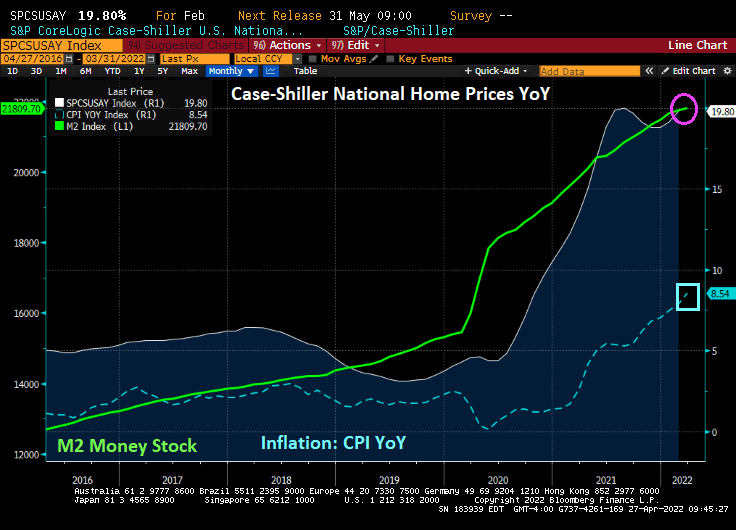
REAL average hourly earnings are now a terrible -2.99% YoY thanks to the worst inflation in 40 years. REAL home prices are growing at 11.8% YoY.
Traders are betting that even with the Fed boosting its target for the federal funds rate by 2.5 percentage points this year to 3% won’t be enough to get the inflation rate back down to 2% over the next decade from around 8.5% currently.
In nominal terms, mortgage rates are seemingly trying to rise to 2007 levels (6.5%). But the gap between the 30-year mortgage rate and Fed Funds target rates is back to 2009 levels.
Talk about Fed and Fed government OVER stimulypto! Even REAL US home prices grew at 12% YoY pace while the REAL Fed Funds Target rate is -8.04%.
US President Biden went green and signed executive orders on his first day to limit oil and natural gas exploration of Federal lands and offshore (also, killed the Keystone Pipeline), helping to drive up energy prices and food prices. These orders begat inflation (also caused by the massive Covid relief by the Federal government). The highest inflation in 40 years begat The Federal Reserve signalling a tightening of Fed monetary policy … to fight the problem caused by The Fed in the first place … too much monetary stimulus for too long. Fiscal and monetary fanaticism and ignorance is forever busy and needs feeding
There was an interesting article on MarketWatch entitled “Bond rout exposes Social Security’s insanity.” The headline was “Every dollar of yours that’s invested in the Social Security trust fund is invested in low-yielding government bonds.”
Yes, another disastrous consequence of The Fed’s lax monetary policy since 2008, helping to push Treasury yields extremely low. And REAL Treasury yields into negative territory.
But here we sit today with The Fed threatening to trim their balance sheet and raise rates … to combat the inflation they helped create in the first place. Now we have the 10-year Treasury Note price falling like a paralyzed falcon with expected hate hikes going above rate hikes by February 2023 (based on Fed Funds Futures prices).
Most pension funds also invest heaving in US Treasuries, along with agency Mortgage-backed Securities (AgencyMBS).
Under President Biden’s Reign of Error, inflation is the highest in 40 years. But Powell and The Fed are still overstimulating the economy, and Congress is contributing to the inflation disaster with short-sighted political policies and spending (flooding the economy with stimulus spending helping to drive up prices). Even Democrat US Senator Elizabeth Warren gets it.
Here is Biden’s inflation scorecard in one chart. Under Inflation Joe, foodstuffs are up 58%, gasoline is up 72%, diesel fuel is up 154%, and green energy element Lithium is up 645% (no wonder electric car manufacturer Telsa is raising their prices 10%). Of course, The Federal Reserve keeps on expanding its balance sheet, UP 50.3% under Inflation Joe.
House price growth is up 69% and the 30-year mortgage rate is UP 83.3% and currently is at 5.28%. The orange line is the growth path.
Yes, prices have risen even more after Russia Invaded Ukraine on February 24, 2022. But most of the inflation was baked-in prior to the Russian invasion. Sorry Jen Psaki, but you are wrong about inflation being all Putin’s fault.
We have Federal Reserve of St Louis President James “Bully” Bullard saying that The Fed could raise rates by 75 basis points in May, the Japanese Yen to Dollar is crashing as mortgage rates continue to soar.
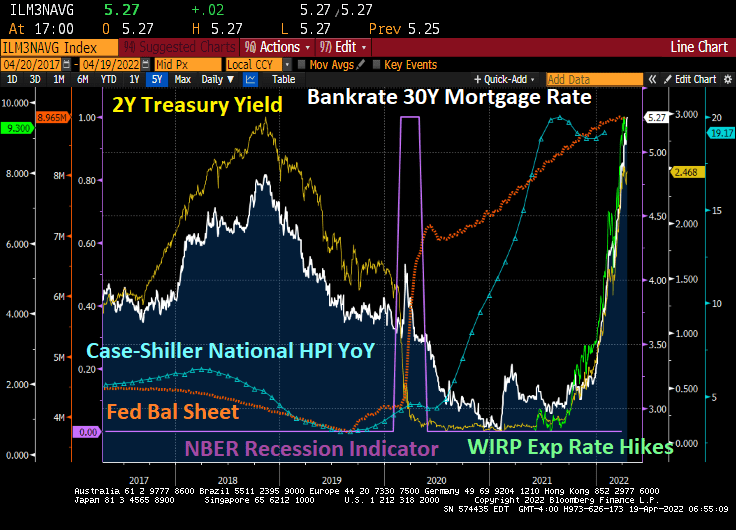
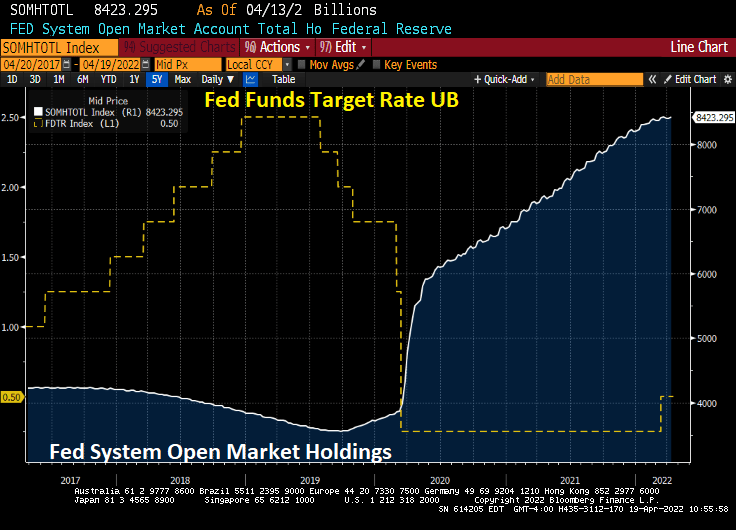
Here is a nice summary of The Fed’s massive balance sheet expansion in reaction to Covid (orange line) and the resulting soaring of home prices. Then The Fed signals that they will remove the “punchbowl” and mortgage rates have boomed. And not in a good day.
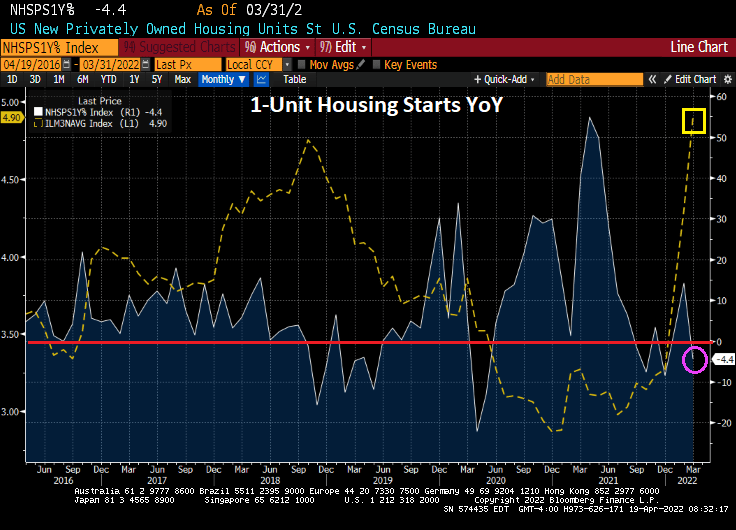
Today we have the US housing starts report. In a nutshell, 1-unit housing starts (single-family detached) declined -4.4% YoY as mortgage rates skyrocket.
5+ unit (aka, apartment stats rose 7.49% MoM in March while 1-unit starts declined by -1.72% MoM. 1-unit permits fell by -4.81% MoM while 5+ units starts rose by 10.89% MoM.
Soaring home prices coupled with soaring mortgage rates equals … apartment living.
Bear in mind that The Fed STILL have massive monetary stimulypto outstanding!!


























You must be logged in to post a comment.