Inflation Joe And Slow-Walking Jay! REAL Fed Funds Target Rate Lowest In History As Bidenflation Crushes Middle Class And Low Wages Workers (REAL Home Price Growth Is Now LOWER Than The Peak Of The 2000s House Price Bubble!)

Inflation Joe and Slow-Walking Jay. The bullies of the middle class and low-wage workers.

As inflation crushes the middle class and low wage workers, we see that the REAL Fed Funds Target Rate (based on headline inflation) is the lowest in history. Notice that the REAL Fed Funds Target Rate tends to hit its lowest negative reading DURING recessions, although The Fed has had a poor track record since the Dot.com bubble burst and the 2001 recession meaning that the REAL Fed Funds Target rate has been in negative territory (that is, the rate of inflation has exceeded The Fed Funds Target Rate for much of the post-2000 era).
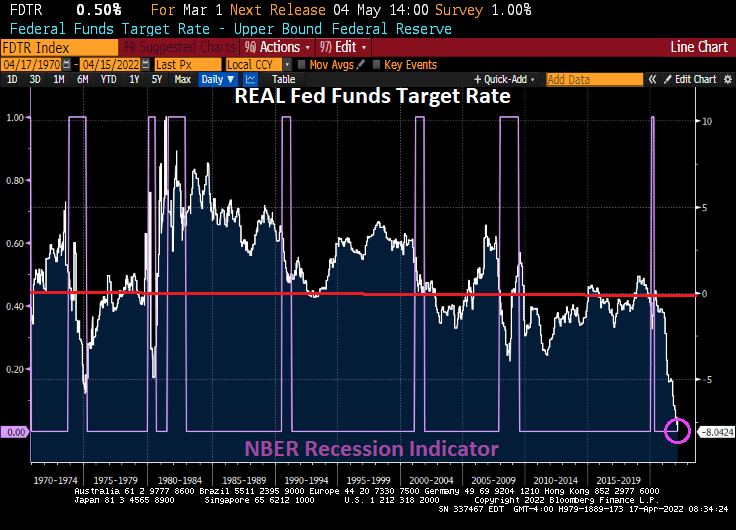
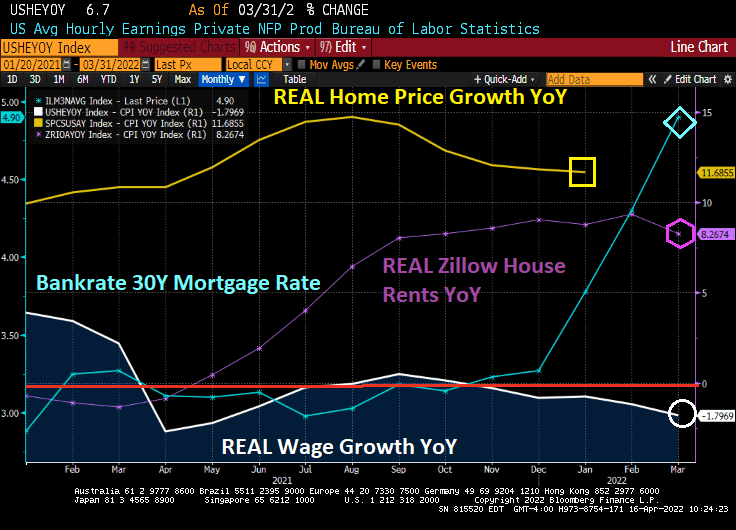
The “good” news? Inflation caused by The Fed’s negative interest rate policy (NIRP?) has actually led to REAL home price growth to slow 11.6855% YoY, lower than the peak of the 2005-2007 house price bubble.

With The Fed’s OVERSTIMULATION of markets with historically low REAL Fed Funds Target Rate, we can see that the US unemployment rate is overheated (that is, below the Congressional Budget Office (CBO) Short-term Natural Rate of Unemployment. Yes, it appears that Slow Walking Fed Chair Jay Powell should be raising The Fed’s target rate AND removing (at least) the Covid monetary stimulus.

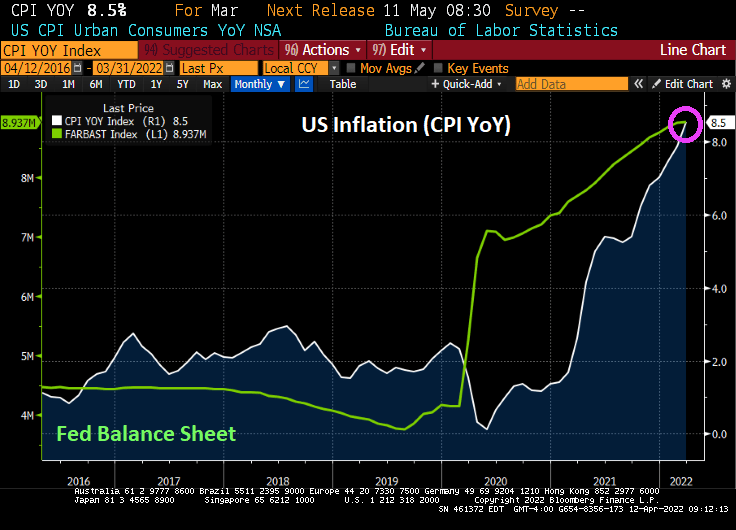
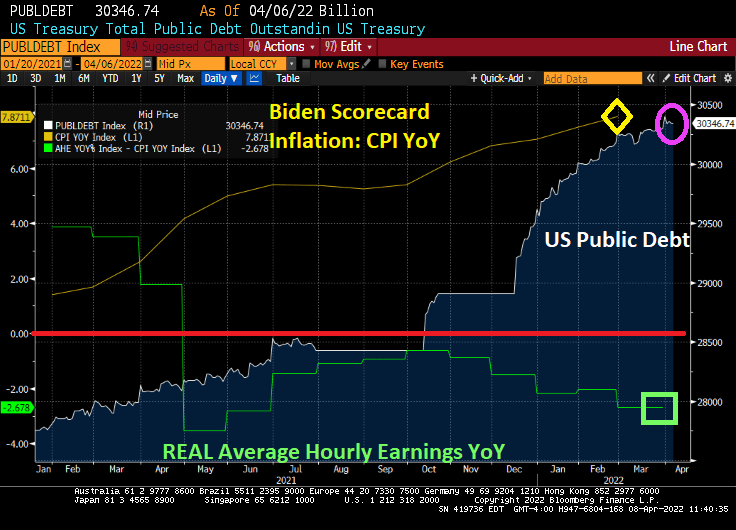
Inflation Joe is a career politician, so it is not surprising that he is trying to blame Russia for the horrid inflation in the US. However, inflation grew from 1.4% when Biden took office to 7.9% when Russia invaded Ukraine. The latest inflation report was 8.5%, so Russia is only partly to blame for rising prices since February 24, 2022. The rest is due to Inflation Joe, Slow Walking Jay and Congress.

Again, Congress helped drive prices through the roof by massive Federal spending (aka, Covid stimulus “relief”). Hence, the Four Horsemen of the Inflation Apocalypse is appropriate. And now Biden is once again pitching massive government spending (Build Inflation Back Better?).

Here is Joe Biden and his inflation bat, Lucille.

Have a peaceful and pleasant Easter Sunday.
The Big Short 2? Subprime Credit-Driven Bubble Versus Fed Loose Policy Driven Bubble (Will The Fed Burst Yet Another Housing Bubble? Michael Burry Thinks Not)

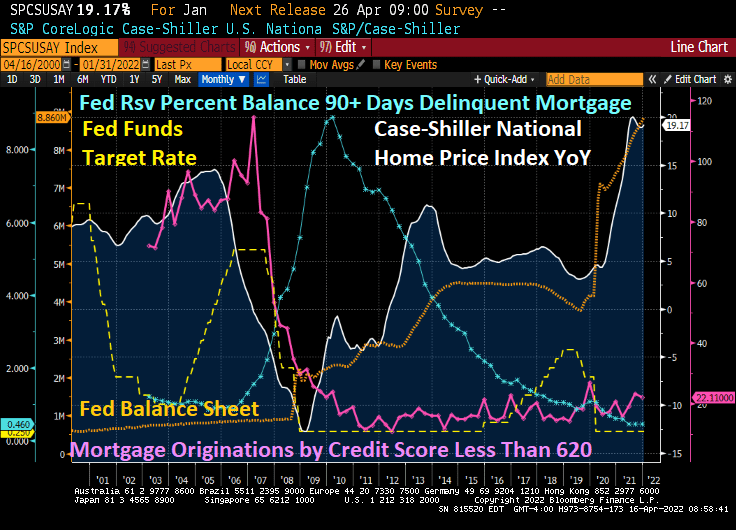
The book and movie “The Big Short” revolved around the 2005-2007 housing bubble driven by lending to borrowers with subprime credit (and little or no underwriting). As we know, Bear Stearns, Lehman Brothers and other investment banks too large positions in subprime asset-backed securities (SABS) that became highly toxic once the demand for high-yield subprime ABS dried up. The decline in US home prices coupled with soaring 90-day mortgage delinquencies led to the failure of Bear Stearns and Lehman Brothers along with Fannie Mae and Freddie Mac being put into conservatorship by their regulator.

Fast forward to today. Mortgage originations by credit scores of 620 or less have shriveled while home price growth YoY is even higher than the subprime mortgage crisis of 2005-2007. So, is the US facing another “Big Short” scenario? Yes and no.
The answer is no in that lenders have tightened their credit box sufficiently so that investment banks are no longer buying large quantities of subprime credit paper. The answer is yes if we consider that the current housing bubble is fueled by extraordinary monetary stimulus due to Covid (as well as rampant Federal government stimulus spending).

Following the Federal Reserve of Dallas’ lead, here is a chart of REAL home price growth YoY against REAL average hourly earnings YoY. I added REAL Zillow house rents YoY as well.

Look at the affordability gap during the Subprime Bubble of 2004-2006 and then the Fed Bubble of 2020 to today. Both bubbles show a disconnect between REAL home prices and REAL wages. REAL Zillow home rents are not as high as REAL home price growth, but still how a huge gap in rent affordability.

So, what can upset the apple cart? How about Jay and The Gang jacking up mortgage rates making home affordability even worse (unless it slows home price growth).
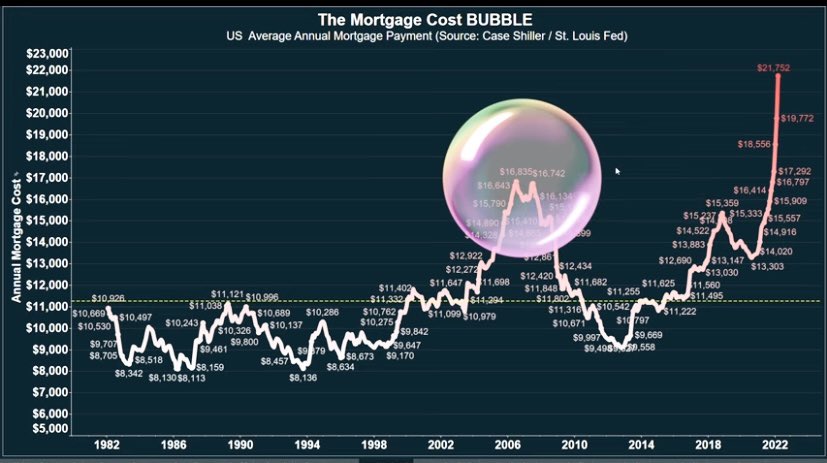
Thanks to The Fed’s propose quantitative tightening, mortgage rates are soaring and mortgage costs along with them. Mortgage costs, thanks to The Fed driving up housing prices AND mortgage rates, are substantially higher than during the subprime mortgage housing bubble.

The Fed’s whipsaw approach helped crash home prices during the subprime mortgage crisis by dropping rates too fast at first (helping to ignite a housing bubble) then raising rates too fast (helping to crash housing prices).

Now, Michael Burry of The Big Short fame (portrayed by Christian Bale) thinks that The Fed has no intention of fighting inflation meaning that he doesn’t think The Fed will raise rates all that much. “The Fed’s all about reloading the monetary bazooka. So it can ride to the rescue & finance the fiscal put,” Burry added.

Yikes! Time for investing in cryptocurrencies like Bitcoin and Ethereum?

This scene from the film “The Big Short” won’t be happening again. But I agree that no one is paying attention … again.

Fed’s Fahrenheit 451! Freddie’s Mortgage Rate Hits 5% For First Time In A Decade As Fed Keeps Buying Assets

WASHINGTON (AP) — Long-term U.S. mortgage rates continued to climb this week as the key 30-year loan rate reached 5% for the first time in more than a decade amid persistent high inflation.

The average 5% rate on the 30-year mortgage was up from 4.72% last week, mortgage buyer Freddie Mac reported Thursday. The average rates in recent months have been showing the fastest pace of increases since 1994. By contrast, a year ago the 30-year rate stood at 3.04%.

The average rate on 15-year, fixed-rate mortgages, popular among those refinancing their homes, jumped to 4.17% from 3.91% last week.

Yet The Federal Reserve’s balance sheet keeps on growing.

The Federal Reserve reminds me of the Ray Bradbury novel Fahrenheit 451 where the fireman actually burn books rather than extinguish fires.

Panic In (Fed) Needle Park! Mortgage Purchase Applications INCREASE Despite Rapid Rise In Mortgage Rates (FEAR Of Further Fed Taking Away Punchbowl)

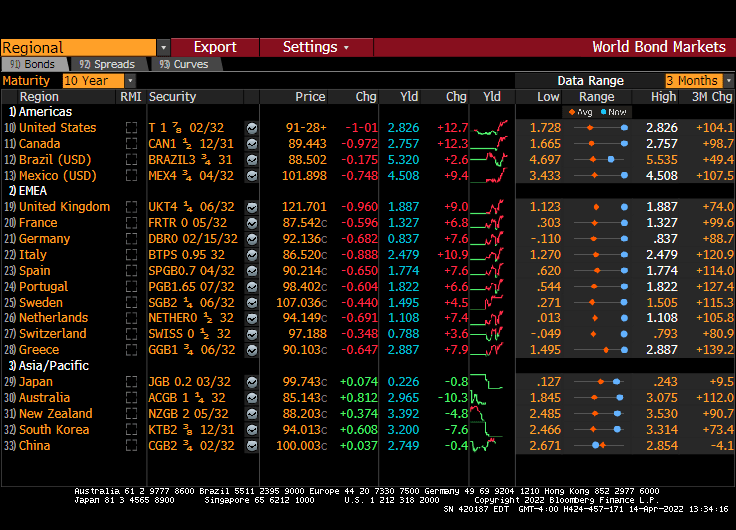
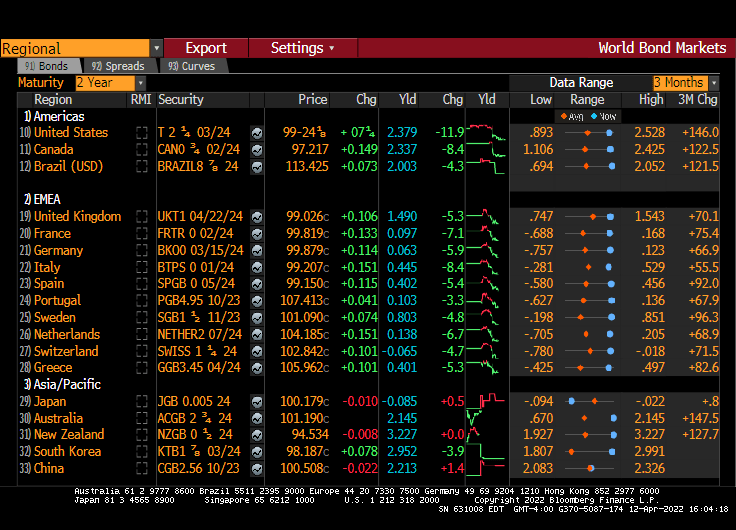
Today, the US Treasury 10-year yield exploded upwards by over 12 basis points. With it, the 30-year mortgage yield is above 5%. And MBA Mortgage Purchase Applications are actually increasing.

Today’s bond market summary shows the 10-year Treasury yield up 12.7 basis points. Its the same all over the western world. Asia? Not so much.

Fear of further Fed fireballs coming from removal of the monetary punchbowl.

Going Down! Export Prices Rise To 18.8% YoY (Highest In History) While Import Prices Rise To 12.5% YoY (Mortgage Credit Availability Plunge With Covid)

Like what Freddie King sang (Going down), we are going down the drain.

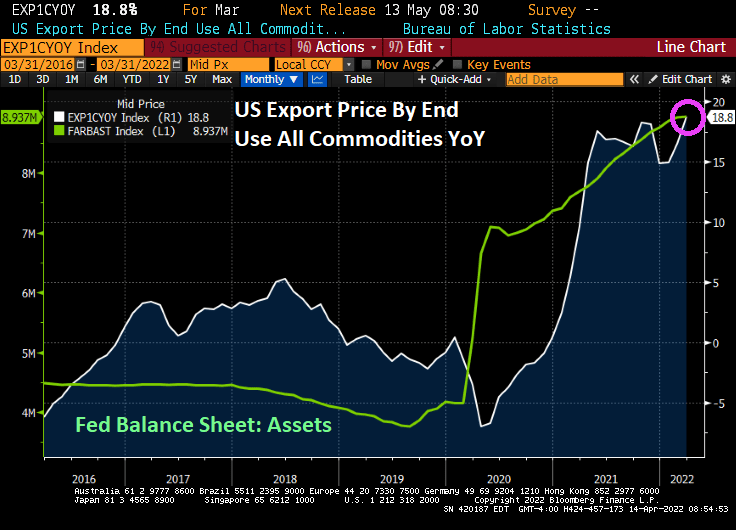
Export prices by end us YoY is up to 18.8%, the highest in recorded history (or since 1983 when they started recording export prices).

Import prices by end use rose to 12.5% YoY.

Unrelated to US export and import prices, the MBA’s mortgage credit availability index slumped with the Covid outbreak and the explosion of The Fed’s Balance Sheet. As I have said before, nothing has been the same since Covid.

Like Freddie King, “I’m Feeling Torn Down” by rising prices.

Fed’s Dual Mandate Derby! Misery Index Hits All-time High (Flexible Price Core Inflation Losses At 21.82% Overwhelming Employment Gains)

The Federal Reserve’s two goals of price stability and maximum sustainable employment are known collectively as the “dual mandate.” Unfortunately, inflation is running away (bad) from employment gains (good). Sort of like “The Good, The Bad and The Ugly.” But just the Good and The Ugly combine to create the Misery Index.

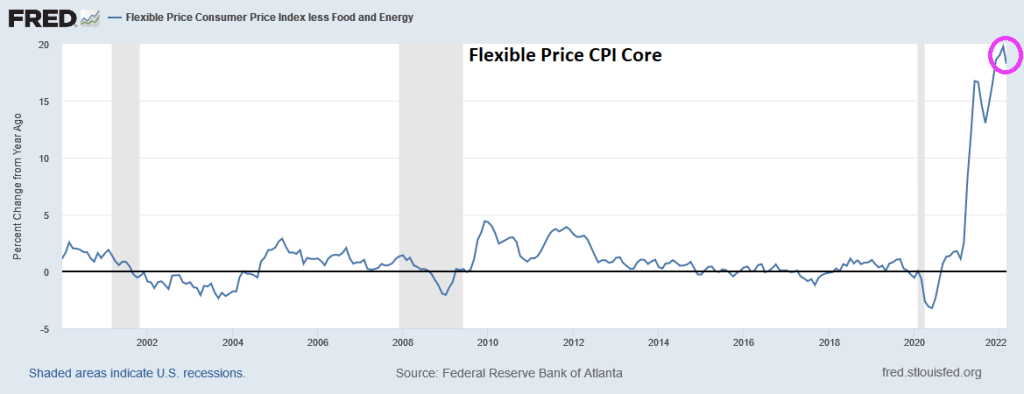
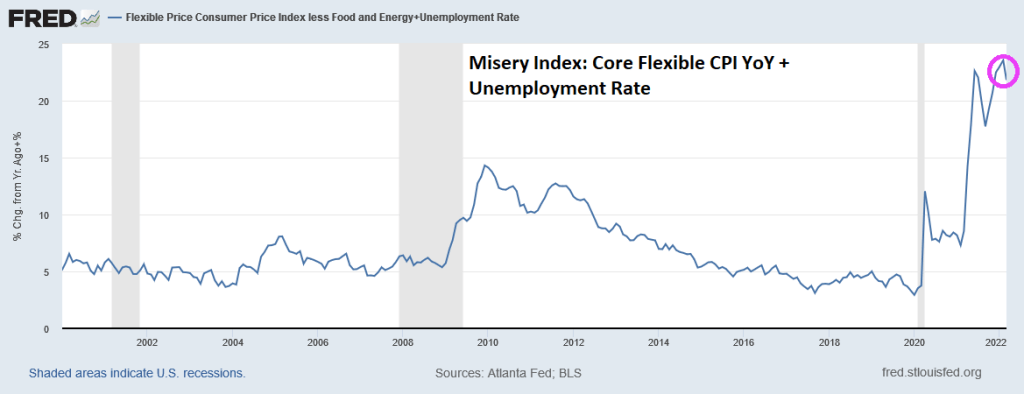
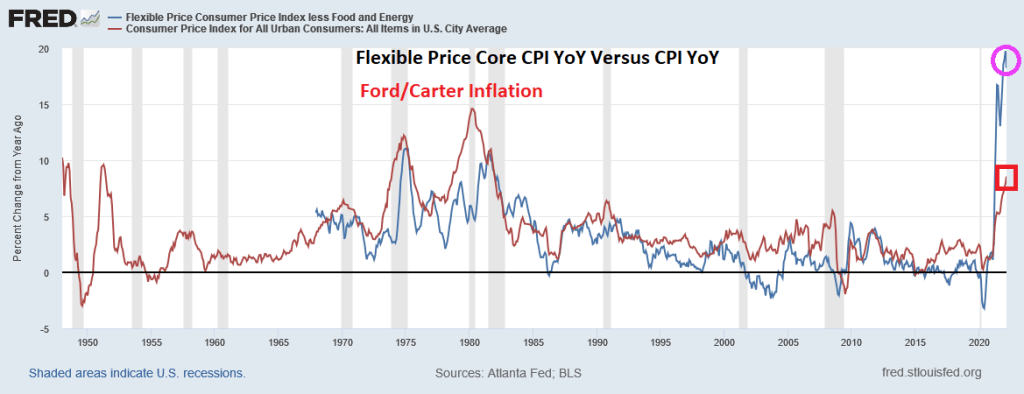
Here is the Atlanta Fed’s CORE flexible CPI YoY for March. The good news? Flexible Core CPI YoY was a little lower than the historic high reading in February. The bad news? We are still talking about 21.82%+ rise in prices (down from 23.56% in February).

If I use the Atlanta Fed’s flexible consumer price CORE index combined with the U-3 unemployment rate, we see that March’s inflation report plus U-3 unemployment is generating a misery index that was last seen in July 2008 during The Great Recession. Unless we consider the July 2021 reading of 31.3%, so we have seen two horrible misery index readings under Biden.

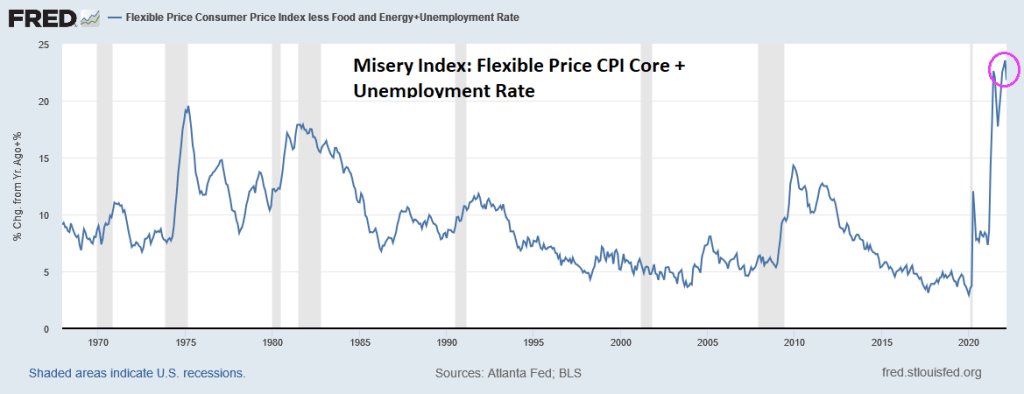
If we look at the Misery Index since 1967, we now have the GOAT (Greatest of All-time) Misery.

Now, inflation under Presidents Ford and Carter (red line) were higher than the flexible core price index (blue line) in the 1970s and 1980. But flexible core price CPI YoY is substantially higher than March’s CPI growth of 8.5%.

The bottom line is that inflation losses are far outweighing the employment gains, resulting in elevated misery.

Misery. We are all feeling it.

Inflation Nation! Real Average Weekly Earnings Growth Lowest Since 2007 (-3.6%) While Mortgage Payments UP 50% (US Treasury 2Y Yield Dumps 12 Basis Points)

Feeling hot, hot, hot! Inflation, that is.

US real average weekly earnings growth YoY is down to -3.60%. That is the lowest since 2007 and is worse than The Great Recession and financial crisis of 2008.

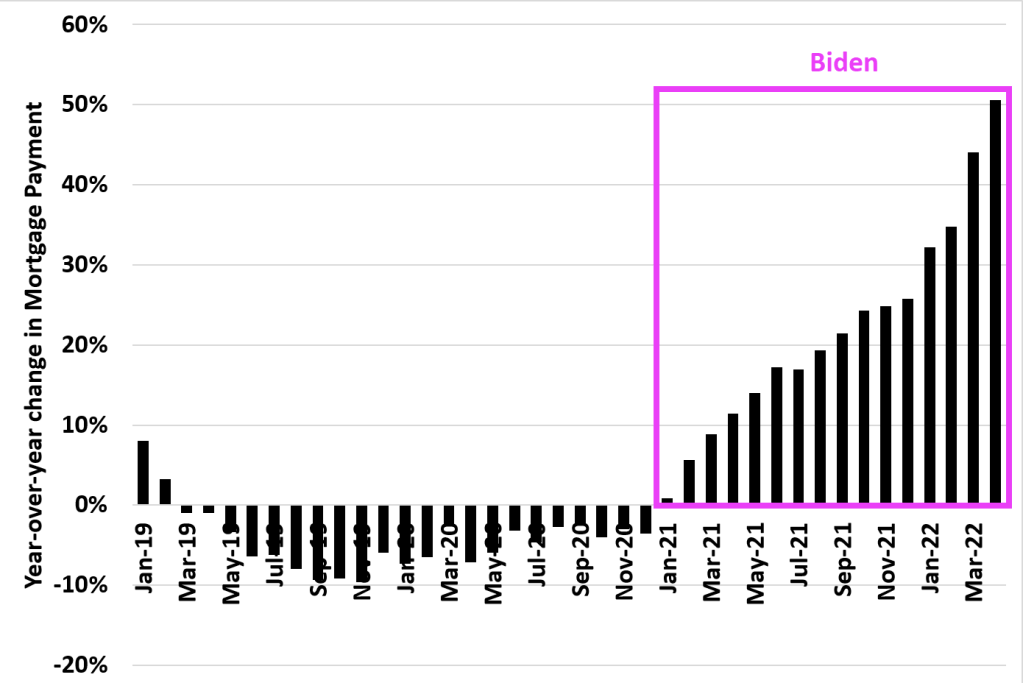
And look at this chart of mortgage payments under Biden. The US was actually experiencing DECLINING mortgage payments YoY in 2019 and 2020. But under Biden’s leadership, mortgage payments have increased by 50% making housing even MORE unaffordable for the middle class and lower-income households.

And now for something kind of scary. The US today suffered a 12 basis point decline in the 2-year Treasury yield, generally a bad sign for the economy. As if we needed more bad news for today.

Highest inflation in 40 years, worst wage growth since 2007 and rising mortgage payments. We will need all the luck we can get.

Bidenflation SOARS To 8.5%, Real Average Hourly Earnings Growth Falls To -3% YoY, Mortgage Rates Rise To 5.14% (The Four Horsemen Of The Inflation Apocalypse?)

The US inflation numbers were released this morning and they are grim. Inflation YoY grew to 8.5%.

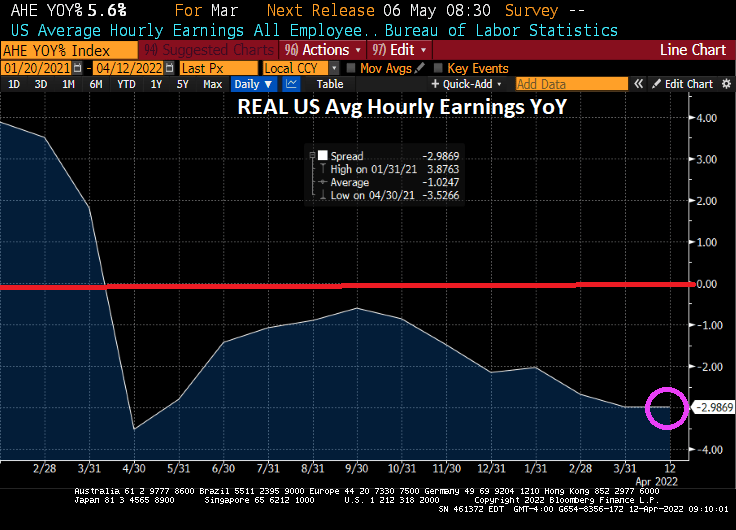
With 8.5% YoY inflation, REAL average hourly earnings growth fell to -3% YoY.

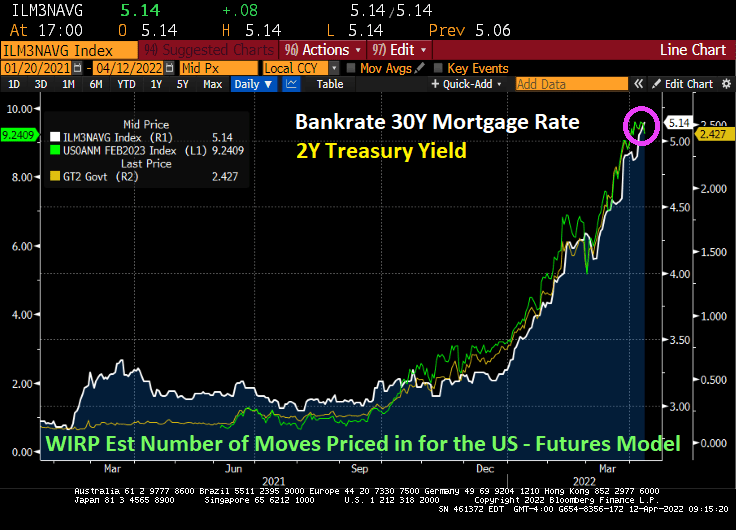
And with The Fed intent on extinguishing their part of the inflation, Bankrate’s 30Y mortgage rate rose to 5.14%.

Energy is the biggest culprit (fuel oil up 70.1% YoY) thanks to the double whammy of 1) Russia’s invasion of Ukraine and 2) Biden’s restrictions on oil and natural gas production. Food at home is up 10% YoY.

Here is a colorful chart of MoM growth in prices.

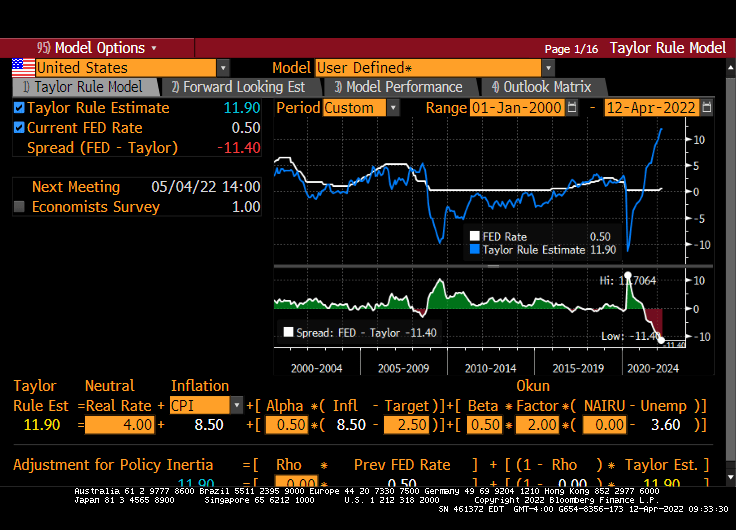
The Taylor Rule model now says that The Fed Funds Target Rate should be 11.90%. Hence, Fed Stimulypto is still in place with the signal that rates will increase.

How about WTI Crude and Brent Crude soaring over 4% today?

Once again, the Four Horsemen of the Inflation Apocalypse (Biden, Powell, Pelosi, Schumer) overstimulated the economy and financial markets with excessive monetary stimulus (Powell) and excessive Federal spending (Biden, Pelosi, Schumer) where demand soared for products and supply naturally hasn’t caught up.

Addicted To Gov! 40-year Mortgage Proposal And How Government Makes Housing Unaffordable (Declining Real Wage Growth And Rising Mortgage Rates = Bad News)

The housing and mortgage markets are addicted to gov.

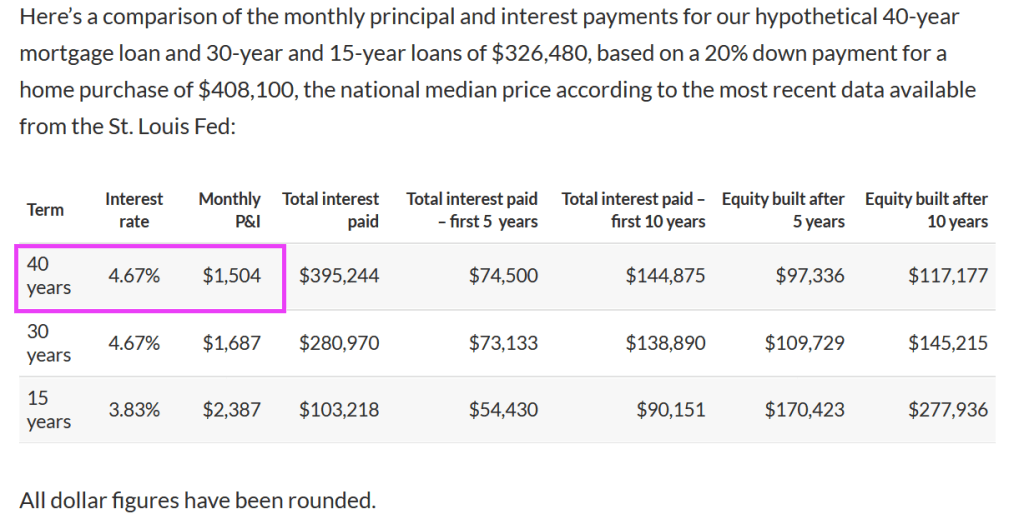
MarketWatch had an interesting piece on mortgages entitled “Here’s how much a 40-year mortgage would save you each month vs. a 30-year loan. And the ultimate cost.”

To make a long story short, a 40-year mortgage, by stretching the payment out from 30 to 40 years, means that the mortgage mortgage payment declines from $1,687 to $1,504.

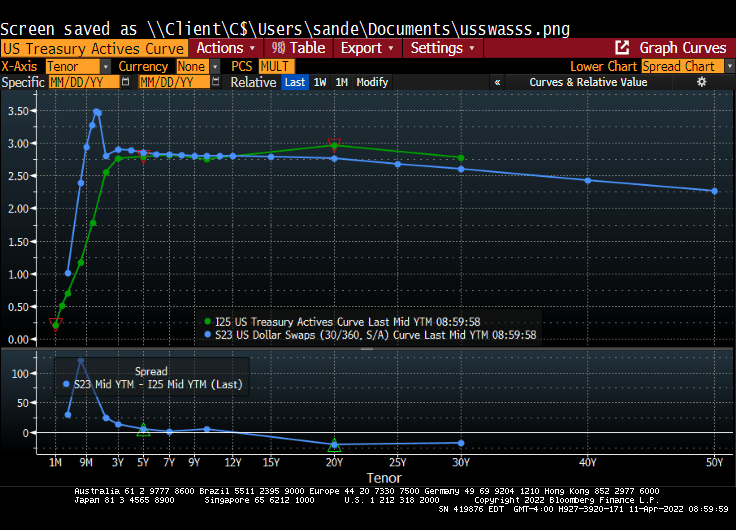
Given that the US Treasury yield curve only goes out to 30 years, lenders (and Fannie Mae and Freddie Mac) will have to use the US Dollar Swaps curve to price mortgages. And since the swaps curve is downward sloping, we could see 50-year mortgages at a lower rate than 30-year mortgages, ceteris paribus.

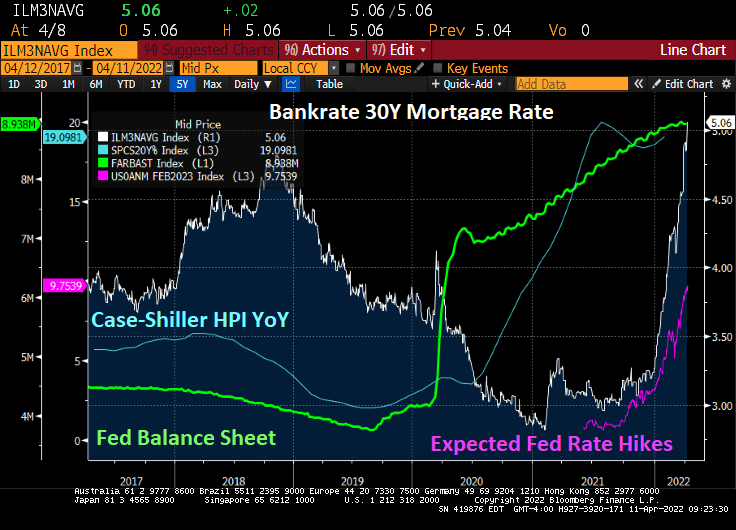
But with The Fed planning on taking away the monetary punchbowl, mortgage rates are rising making housing even more unaffordable.

But most things are not equal. The 40-year mortgage results in a slower paydown of the mortgage, increasing the lender’s exposure to property value declines. A 50-year mortgage would even be worse.

But the real problem with the 40-year mortgage is that it can lead to even MORE unaffordable housing. Yes, going from 30-year to 40-year mortgages lowers the mortgage payment, but a 40-year mortgage could increase the demand for housing. And since we already have soaring home prices since Covid (thanks to Fed monetary policy AND Federal government stimulus), we could actually see a worsening of the housing bubble). Particularly since REAL average earnings are declining.

What a mess that has been created by the government’s pursuit of “affordable housing.” Ideally, the Federal government could help raise household earnings through lowering of Federal tax rates, but the Biden Administration wants to raise taxes. Alternatively, lenders (and Fannie Mae and Freddie Mac) could lower lending standards (e.g., lowering required credit scores), or reduce downpayments to 0%. Lowering credit standards and reducing required downpayments are also inflationary and pose serious potential problems with default risk.

Not to mention that a 40-year mortgage increases the duration risk for owner’s of the 40-year mortgage.

And don’t forget that local governments frown on multifamily (apartment) construction (the Not In My Backyard [NIMBY] problem contributing to rising housing prices.

Yes, the US has a bad case of unaffordable housing. And the 40-year mortgage will make it worse.

T-Dazzle! Inflation Crushing Households Under $60k, Russian CDS Indicating 99% Probability Of Russia Debt Default Over Next Year (WTI Crude UP 2%+, Wheat UP 3%+)

As we are painfully aware, The Fed’s exaggerated monetary flood combined with Federal stimulus spending has led to horrible inflation.

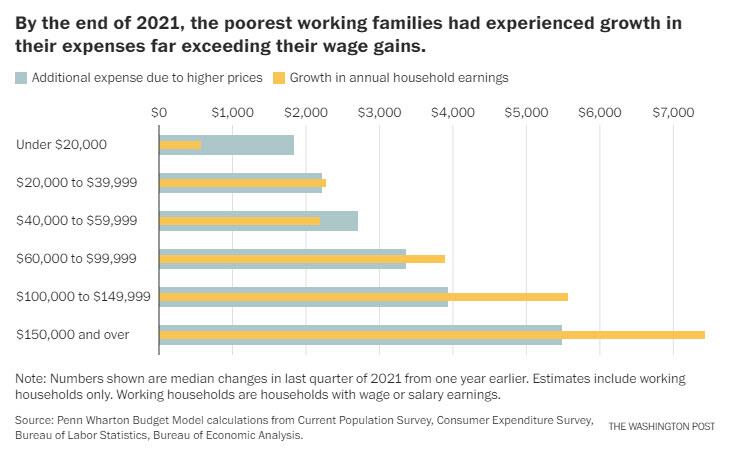
Yes, despite what government talking heads say, Federal stimulus increases demand for goods, the supply is generally slow to respond resulting in rising prices. Then government policies driving up energy prices also leads to highers prices. Throw in Federal Reserve monetary stimulypto and we have this chart from hell from Penn-Wharton. The chart shows that households earning less that $60,000 experience higher expenses due to rising prices than their gain in earnings.

Speaking of the government push to “go green” I saw an ad for a Mercedes Benz EQ sedan that I admit looked really cool, but no price given. I went to Car and Driver’s website and it said “Starting at $103,360.” I’ll take a hard pass, but you can see why households making over $150,000 per year have rising additional expenses due to price increases. To paraphrase April Ludgate, “Thanks for nothing President Biden and Fed Chair Powell.”

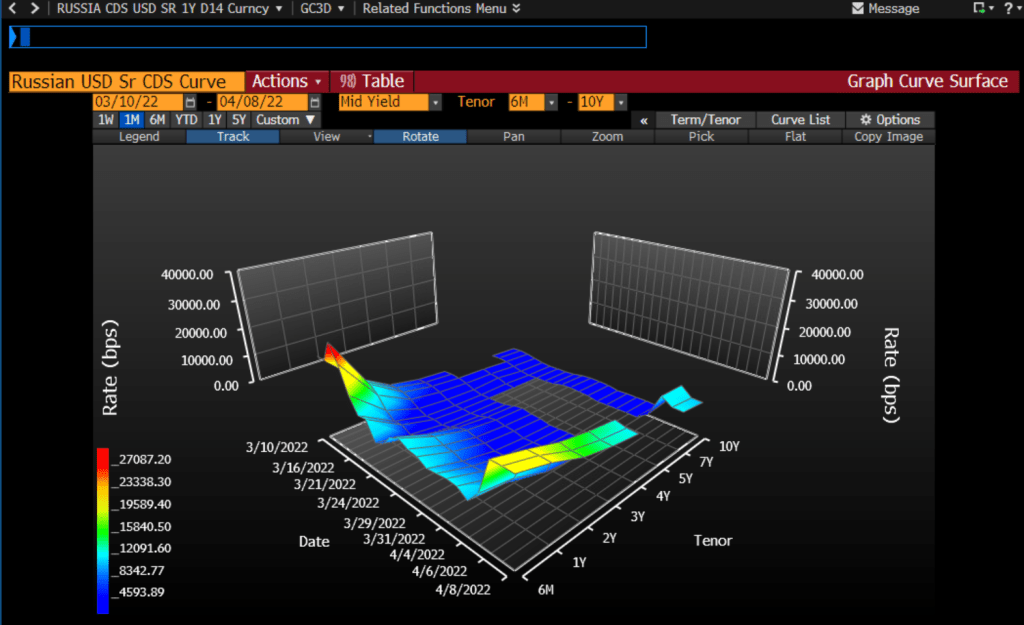
Another chart from hell is the Russian USD Credit Default Swap (CDS) curve. It is spiking at over 20,000.

The one-year Russian CDS is currently at a whopping 20,336 indicating that there is about a 99% of a Russian default over the coming year. As someone who lived through the 1998 Russian credit default scare on Wall Street, this will send a shock wave through credit and Treasury markets.

On the US Treasury front, this chart shows how steeply sloped the US Treasury actives curve has become. Steep until 3 years, then flat. I call this chart “T-Dazzle!” T-Dazzle because I can’t believe how badly the Biden Administration and The Federal Reserve are screwing up the country.

Crude oil? WTI Crude is back to almost $100 per barrel while Brent Crude is at $102.78 per barrel. Wheat is up 3.22% thanks largely to problems related to Russia invading Ukraine (Europe’s bread basket) and a dismal Chinese wheat harvest.

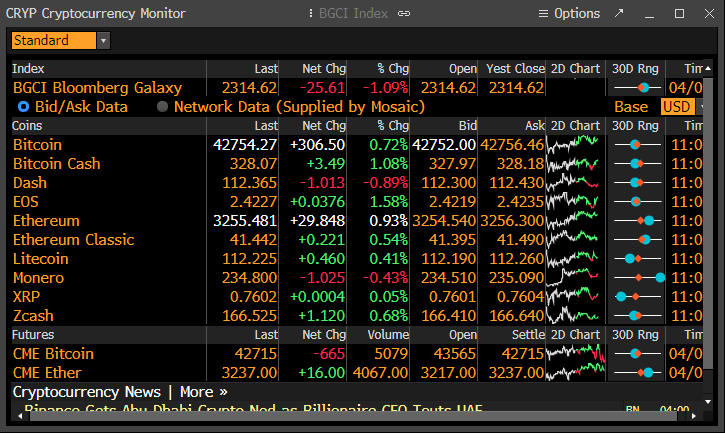
Cryptocurrencies, the alternatives to the US fiat dollar, are rising (in particular, Bitcoin and Ethereum).

Of course, I have to finish up with the soaring 30-year mortgage rate.

Here are Treasury Secretary Janet Yellen and Transportation Secretary Pete Buttigieg trying to convince people that Treasuries are fantastic and to avoid alternatives to fiat currency like Bitcoin, Ethereum, Stablecoin or anything else.