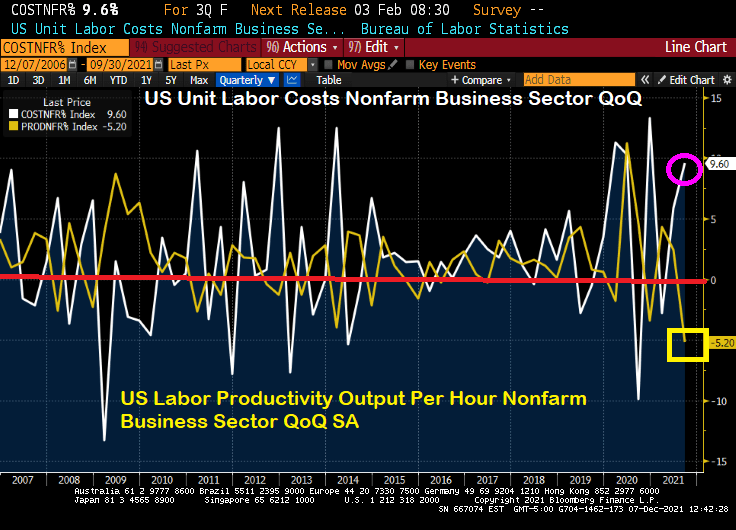
If this what the Biden Administration had in mind? Soaring labor costs at the same time that labor productivity is falling to its lowest level since 1960?
Powell and the Gang’s monetary approach doesn’t seem to be working for the labor market …
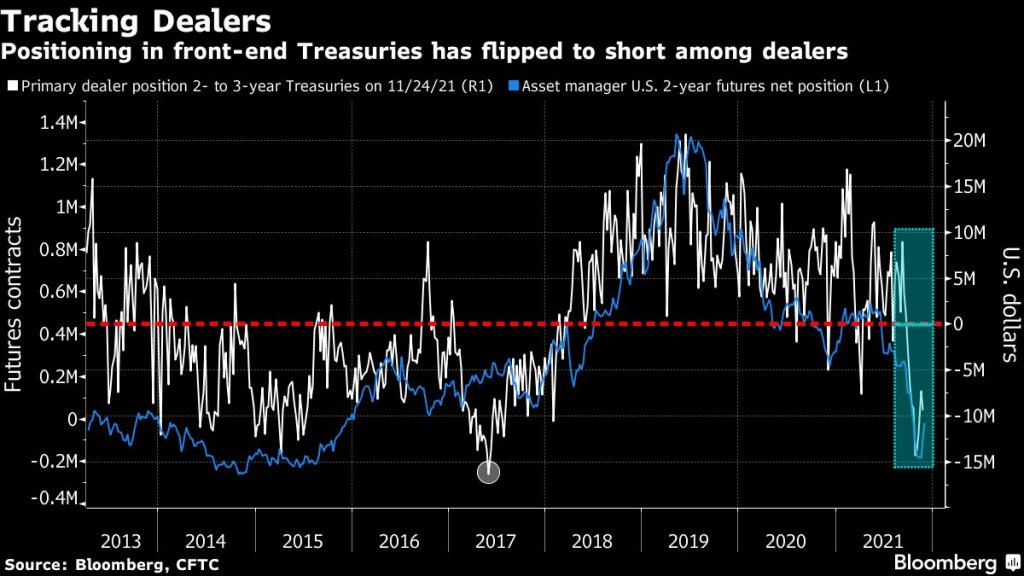
(Bloomberg) — The recent drop in primary-dealer holdings of front-end Treasuries is another warning of potential market dislocation heading into the year-end liquidity vacuum.
As of Nov. 24, primary dealers — which are mostly the large banks — were on the whole betting against two- to three-year Treasuries rather than buying. They had net short positions of just over $9 million, near the most bearish levels since 2017, signaling a pullback by buyers that provide crucial liquidity for older Treasury issues.
The positioning in the front-end of the curve “suggest less demand from the dealer community to fund off-the-run long positions,” Barclays strategists Anshul Pradhan and Andres Mok say in a Dec. 3 note. Off-the-run Treasuries are notes and bonds created in past years and traded less frequently than the newest issues; they’re the biggest part of the market and make up most of the Federal Reserve’s daily asset purchases, which are being scaled back.
Short positioning increased on a relative basis as a result, “which may also have crowded demand to borrow particular issues over others,” the analysts wrote.
Those forces together could contribute to an increase in market dislocations.
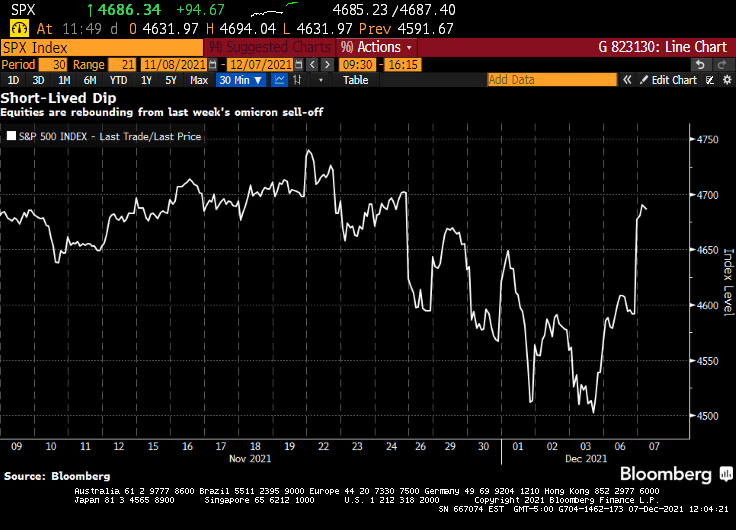
Jerome Powell’s hawkish pivot shocked financial markets. A week later, stocks are higher. The S&P 500 staged its biggest rally since March to wipe out losses from the past week. The speculative fringe that was a smoldering wreck Friday was soaring Tuesday. An index of meme stocks rallied more than 4%, while one composed of airlines added 1.6%. A gauge of newly public companies advanced more than 4%, SPACs jumped more than 2% and even cryptocurrencies rallied, with Bitcoin powering back above $51,000.
It’s a stunning about-face for risk assets that went into a tail spin after the Federal Reserve chair suggested he favored accelerating the removal of monetary support. What follows are takes from market-watchers on why the market is looking past the Fed’s potential change in policy.
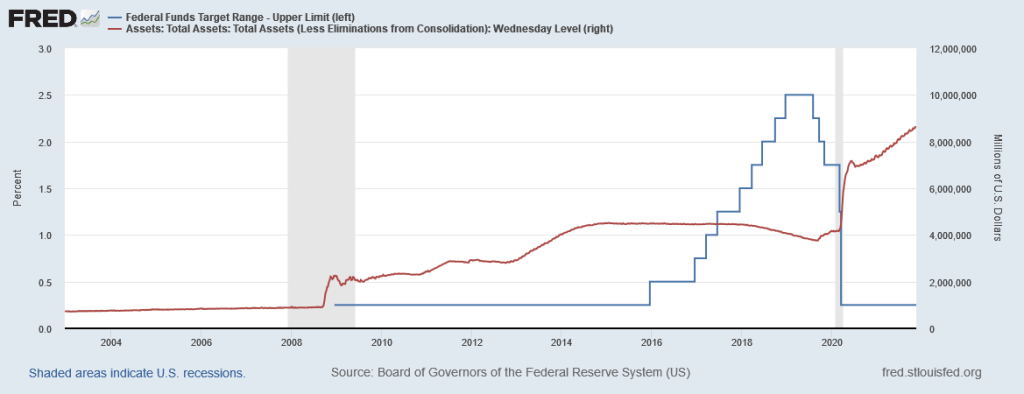
As The Federal Reserve tries to drain-off the extraordinary growth in its balance sheet since COVID without raising its target rate (good luck with that!), it is time to appraise where we are sitting. First, liquidity.
(Bloomberg) Buying and selling large quantities of U.S. government debt without substantially moving the market is about the hardest it’s been since the pandemic sent markets reeling in March 2020. Volatility has jumped, failed trades have increased — and Wall Street analysts warn that the Federal Reserve’s exit from bond-buying is set to make matters worse.
When markets seized up last year, liquidity in most Treasuries vanished, forcing the Fed to embark on massive asset purchases and other measures to avert a full meltdown. Now, the U.S. central bank is scaling back that buying, which has targeted the least-liquid Treasuries, and is poised to quicken the wind-down. At the same time, new government borrowing is ebbing, with the combination setting the stage for more fireworks.
OK, liquidity isn’t as bad as COVID and March 2020, but it is near the highest level since March 2020. The question is … will the numerous asset bubbles around the globe burstLet’s look at the ongoing saga of Chinese conglomerate Evergrande (mainly known as a large real estate developer). Their 8.25% bond has plunged to $23.481 on speculation of a catastrophic default on their bond payments. Then we have Invesco’s Golden Dragon China ETF (measuring a diversified market cap of US-listed companies headquartered or incorporated in China & derive a majority of their revenues from the People’s Republic of China). This ETF has crashed and burned back to pre-COVID (and Stimulytpo) levels.
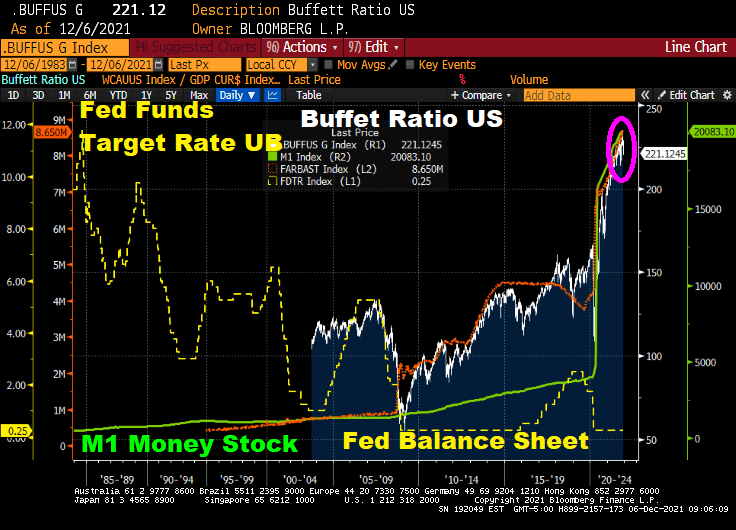
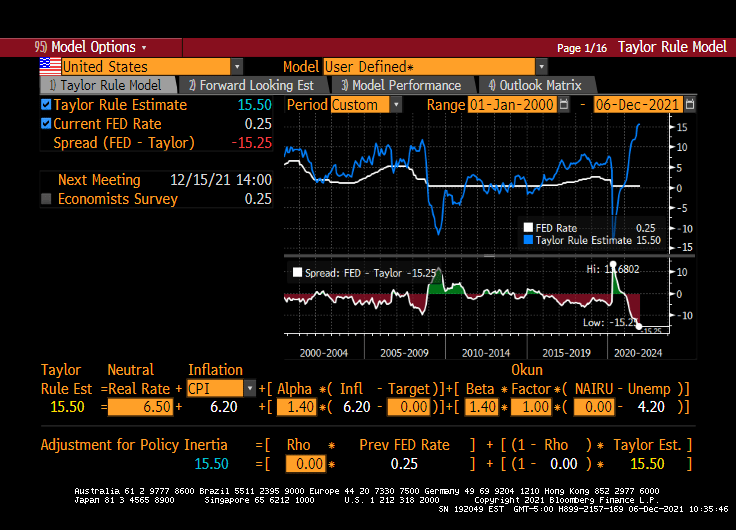
Speaking of cracks, how will the Buffett Ratio US react to a reduction in The Fed’s balance sheet (orange line) and M1 and M2 Money stock? Given that the Fed Funds target rate is WAY below where it should be (according to the Taylor Rule).
As I mentioned yesterday, the Shiller CAPE ratio is at its highest level since the Dot.com debacle of 2000. How will the Shiller CAPE ratio react to The Fed’s tapering?
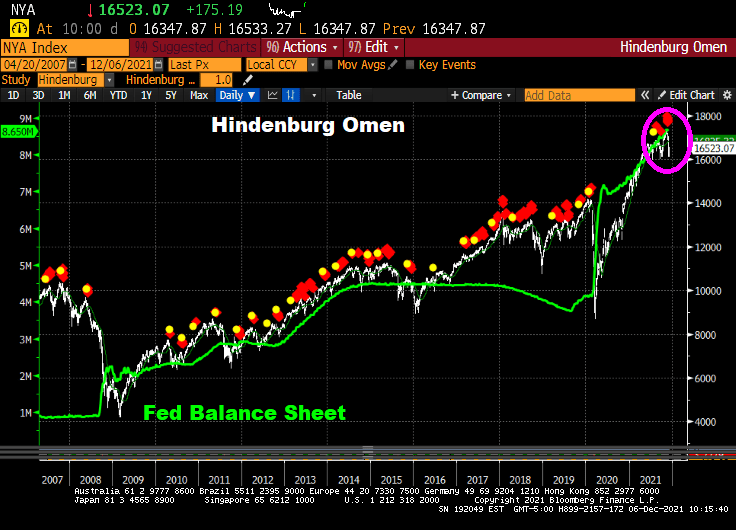
Even the Hinderburg Omen is flashing red … again.
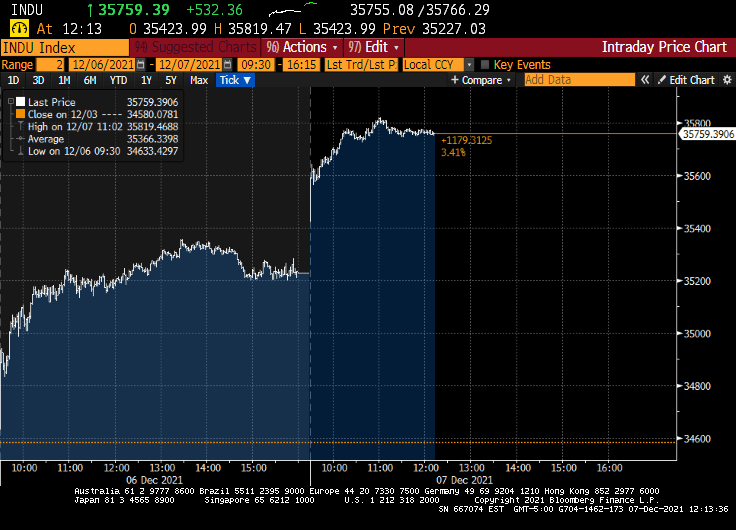
Now, the Dow is up 600 points today, primarily on the news that the Omicron Variant is about as harmful as the common cold.
A major shift is underway at the Federal Reserve to begin to remove the central bank’s massive pandemic easing policies, and could see it hike rates sooner than is priced in by markets.
Comments by Fed officials suggest the central bank is likely to decide to double the pace of its taper to $30 billion a month at its December meeting next week. Initial discussions could also begin as soon as the December meeting about when to raise interest rates and by how much next year with Fed officials set to submit a fresh round of economic forecasts and projections for the fed funds rate.
There is no consensus yet on when to begin hikes, but it’s clear that the faster taper is designed to give the Fed flexibility to raise rates as soon as the spring. The markets do not appear to expect the first rate hike until the summer of 2022.
Uh-huh. Let’s see what happens when and if The Fed starts to taper. Is economic growth so strong that it can continue without Federal Stiumulypto? THAT is the right question.
Look at the above charts and tell me if The Fed will actually raise their target rate more than twice. Despite the Taylor Rule suggest a target rate of 15.50% to cool inflation.
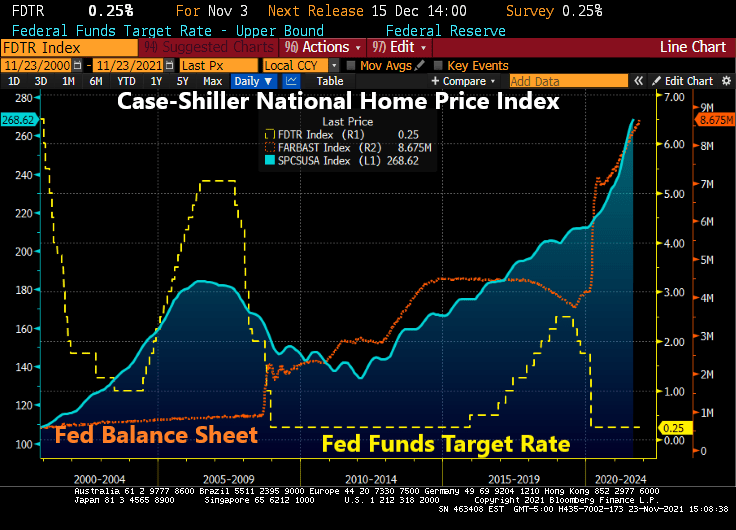
I have written numerous times about nothing has been the same since the housing bubble burst and ensuing financial crisis of 2008. The crisis led to bank bailouts (TARP) and banking legislation (Dodd-Frank) giving The Federal Reserve even more power. And then the COVID lockdowns led to even MORE power for The Fed. And a horrid decline in money velocity (the ability of printing money to increase economic growth … or GDP).
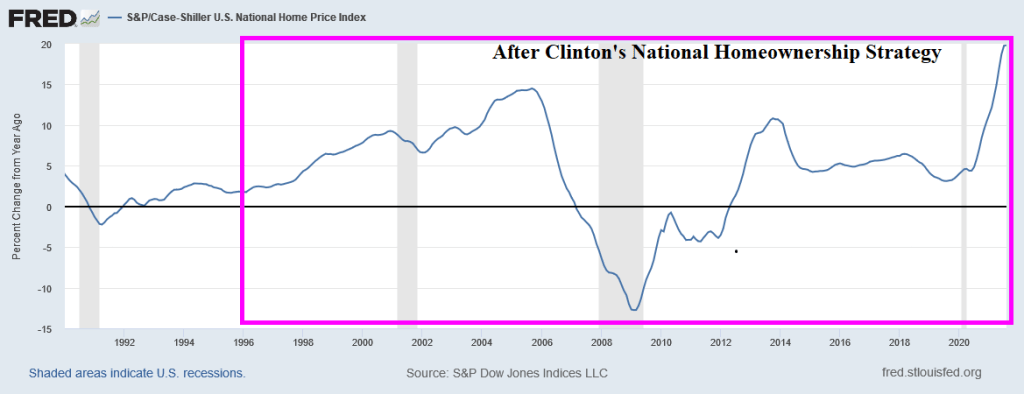
But let’s take one step backwards. One the causes of the housing bubble that burst was President Clinton’s infamous National Homeownership Strategy that encouraged “partners” with the Federal government to soften underwriting standards for mortgage lending, particularly for minority households. The intent was to increase the homeownership rate in the US and it worked! Too well. Along with increasing the homeownership rate came rising home prices, culminating with home price growth reaching 14.5% YoY in September 2005. Only to start slowing to a crash.
Of course, the housing bubble was associated with no/low documentation and subprime mortgage lending. But the relaxing of underwriting standards by the National Homeownership Strategy helped fuel the no/low doc and subprime lending crisis. But weakening underwriting standards to increase homeownership rates is a dangerous strategy.
Note the surge in M1 Money Velocity (GDP/M1) starting in 1994. M1 Velocity grew until Q4 2007, then crashed along with home prices. The second and more sudden crash in M1 Velocity occurred with the COVID outbreak in March 2020 and the ensuing economic lockdowns and the intervention of The Federal Reserve in terms of money printing. M1 Money surged 173% from October 2008 to February 2020 and then another 369% from March 2020 to today. THAT is a Fed Storm Surge!!
M2, the broader definition of money, has not grown as rapidly as M1, but it still grew at an alarming rate. Atlanta Fed President Raphael Bostic blamed inflation on COVID but not The Fed’s insane money printing or government lockdowns. C’mon man!
Finally, the banking crisis (and TARP bailouts) along with COVID have made consumer purchasing power of King Dollar even worse.
Be careful of government strategies to make housing more “affordable” because they seem to make housing more expensive and can help crash the financial system.
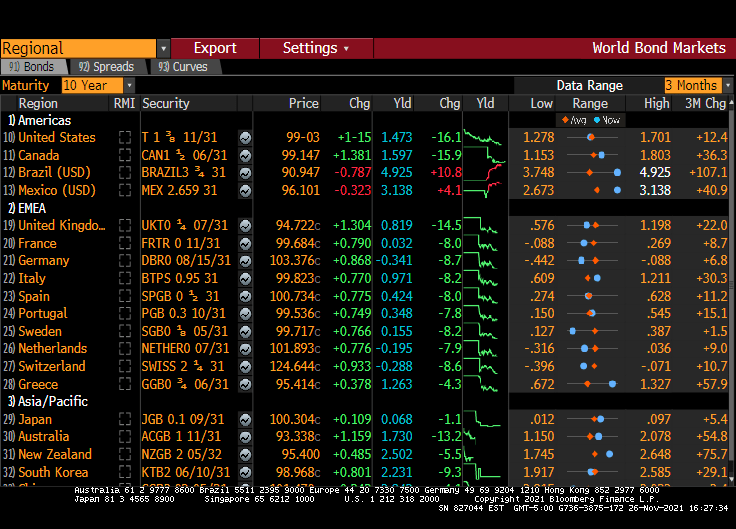
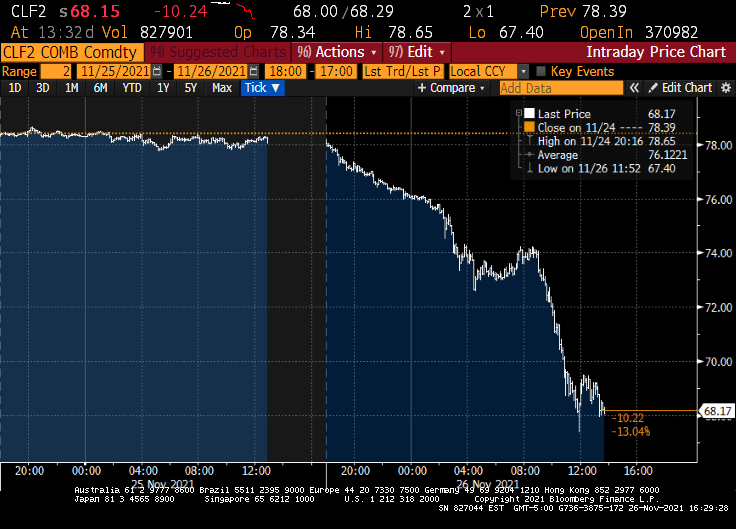
It has been a grim Friday. The Dow fell 900 points, 10Y Treasury yields fell 16.1 basis points and West Texas Crude fell to $68.17.
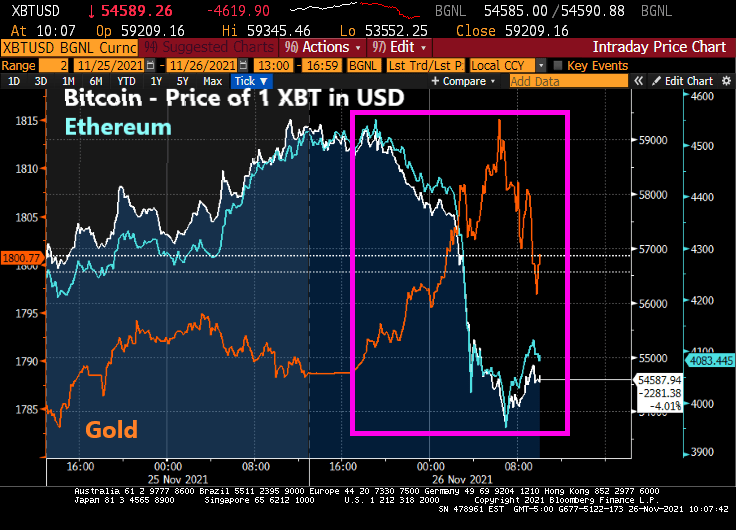
Bitcoin tumbled 20% from record highs notched earlier this month as a new variant of the coronavirus spurred traders to dump risk assets across the globe.
The world’s largest cryptocurrency fell as much as 8.9% to $53,624 on Friday during London trading hours. Ethereum, the second-largest digital currency, dropped more than 12%, while the wider Bloomberg Galaxy Crypto Index declined as much as 7.5%. On the other hand, gold rose as cryptos fell, then retreated as cryptos rebounded.
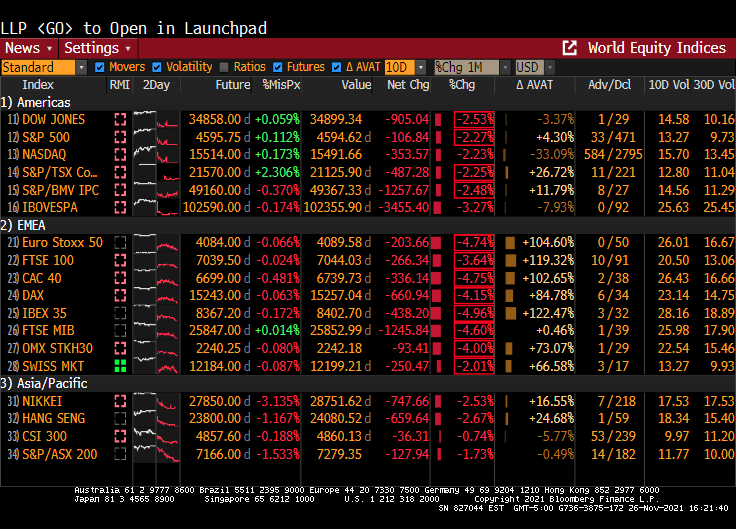
A new variant identified in southern Africa spurred liquidations across markets, with European stocks falling the most since July and emerging markets also slumping.
The Dow is down around 900 points … and look at Europe!
The 10-year Treasury yield is down 16.1 basis points. Most of Europe is down around 8-9 basis points while the UK is down 14.5 BPS.
And West Texas Intermediate crude futures are down to 68.17 from 78.39. No Jen Paski, this isn’t due to Cousin Eddie (Biden) releasing the Strategic Petroleum Reserve (SPR).
Maybe it was all the tryptophan released by eating turkey.
Its Thanksgiving in the USA! Confession: I don’t like turkey. Prime rib with horseradish sauce? You bet!!
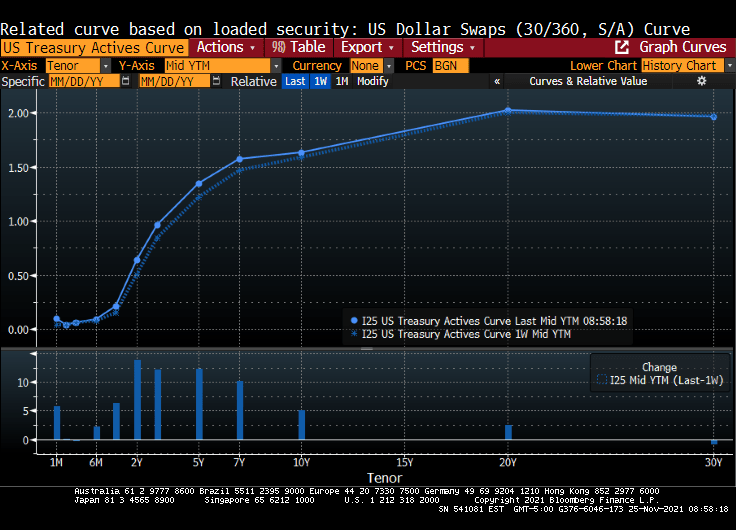
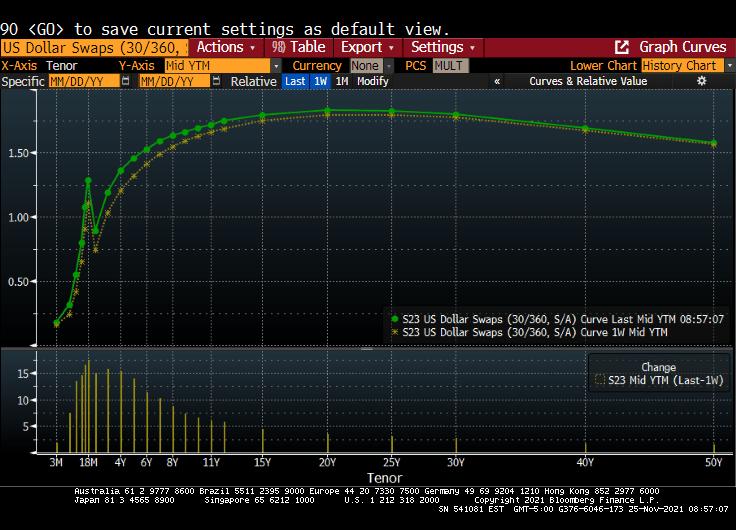
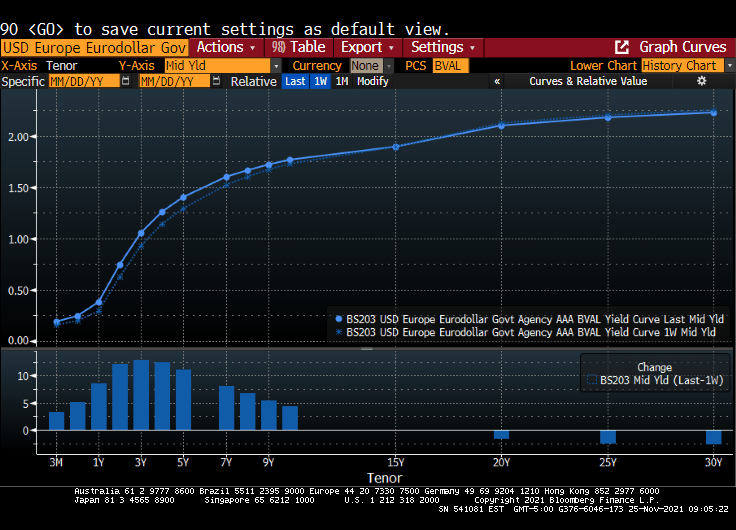
Anyway, Treasuries ended mixed Wednesday with the yield curve sharply flatter after a raft of U.S. economic data and minutes of the November FOMC meeting bolstered expectations for an earlier start to Fed rate increases. Two- and 5-year yields reached YTD highs, and 5s30s spread reached narrowest since March 2020.
Over the past week, the Treasury actives curve rose 13.85 basis points at the 2 year tenor.
Yields ended richer by ~6bp across long-end of the curve, while front-end cheapened almost 3bp; 2s10s flattened more than 5bp, 5s30s more than 6bp; 10-year yields shed ~3bp to ~1.635% Release of Nov. 2-3 FOMC meeting minutes drew minimal market reaction, as flatter curve held its shape.
The US Dollar Swaps curve rose from the previous week as well.
Minutes said participants considered elevated inflation as likely transitory, “but judged that inflation pressures could take longer to subside than they had previously assessed”
Earlier, front-end and belly sold off after a heavy slate of U.S. economic data including the lowest initial jobless claims tally since 1969
Also during U.S. morning, Fed’s Daly said she would support accelerated tapering of asset purchases, which added to pressure across front-end Treasuries
Subsequently, eurodollars traded heavy over the session as rate-hike premium continued to ramp up in 2022 and 2023; overnight index swaps showed 30% chance of a March hike, while around three hikes — or 75bp — were priced in by the end of next year
Renters in the US are getting clobbered by inflation.
The US Zillow Rent Index All Homes YoY + CPI YoY is one measure of renter misery.
The classic misery index (CPI YoY + U-3 unemployment rate) is 10.80%.
Then there is inflation in food prices, gasoline, heating oil, natural gas, etc.
While Biden is releasing the Strategic Petroleum Reserves (SPR) in order to mitigate the problem that he created by terminating the energy pipelines and oil/natural gas drilling permits in the name of “Going Green!” But on the announcement of tapping the SPR, crude oil futures actually rose.
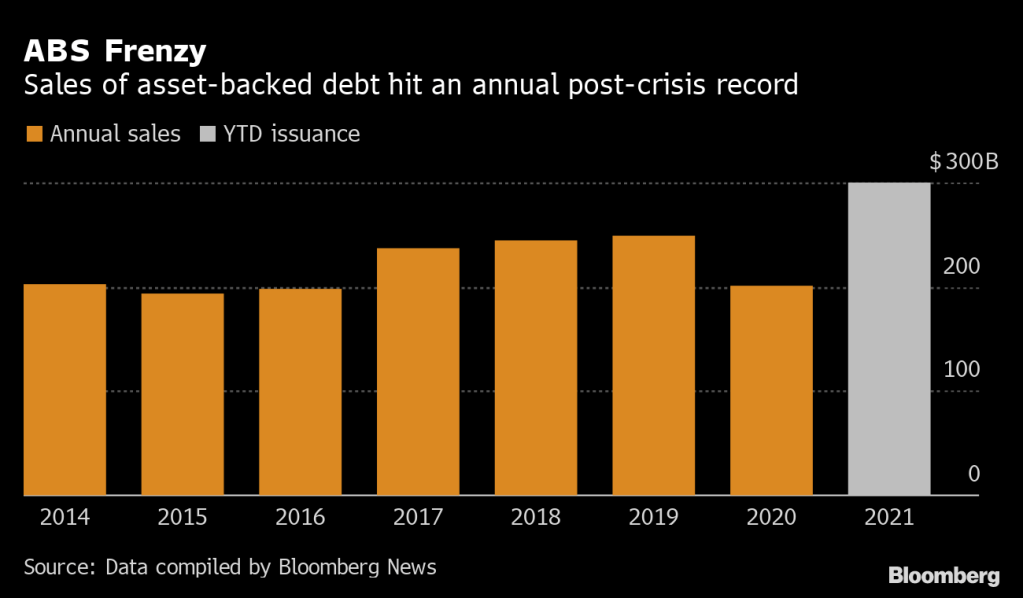
I remember the surge in securitization of loans, receivables, etc during the housing bubble of the mid-to-late 2000s. Today seems like 2007 all over again.
(Bloomberg) — Bankers are repackaging everything from fast food franchises to fitness-center fees into bonds at the fastest clip since the global financial crisis as investors chase yield and inflation protection.
This year’s sales of U.S. asset-backed securities have already surpassed $300 billion, according to data compiled by Bloomberg — and more is expected by year-end. Post-crisis issuance records have also been set in private-label commercial mortgage bonds and collateralized loan obligations, which are also seen accelerating.
“Solar, consumer loans, container lease and whole business transactions to some degree all offer attractive yields and spreads,” said Dave Goodson, head of securitized credit at Voya Investment Management. “These so-called esoteric sectors remain well supported with plenty of money to invest.”
On Monday, Self Esteem Brands, a franchiser of businesses including its flagship gyms Anytime Fitness, priced a $505 million ABS that was backed by franchise agreements, royalties and fees. In whole business securitizations like these, companies mortgage virtually all their assets.
Last month, fried chicken restaurant chain Church’s Chicken sold a $250 million securitization backed by franchise and royalty collateral. Golden Pear Funding recently securitized litigation fees related to financial settlements on everything from personal injury cases to wrongful convictions. And Oasis Financial priced a similar deal linked to payments on medical liens.
Then we have this headline that will send chills through the CMBS market for retail space, particularly at a time when commercial real estate (particularly RETAIL) are trying to recover from COVID lockdowns and the growth of online shopping.
“Retailers Sound Alarm on Organized Theft as States Warn of Rise”
Retailers say shoplifting is getting more brazen in the U.S.: A California Nordstrom store was recently hit by a flash mob of more than 80 people who made off with designer goods, while more than a dozen people pilfered from a Louis Vuitton location in a suburb of Chicago.
On Tuesday, the impact of shoplifting reached Wall Street, with Best Buy Co. shares plunging after the electronics retailer said widespread theft contributed to a decrease in one gauge of profitability. Last month, Walgreens said it would close five San Francisco stores after theft rates there spiked.
Seemingly, no one learns from history. Or as the zen master Yogi Berra once said “It’s like déjà vu all over again.”
Or “You better cut the pizza in four pieces because I’m not hungry enough to eat six.”
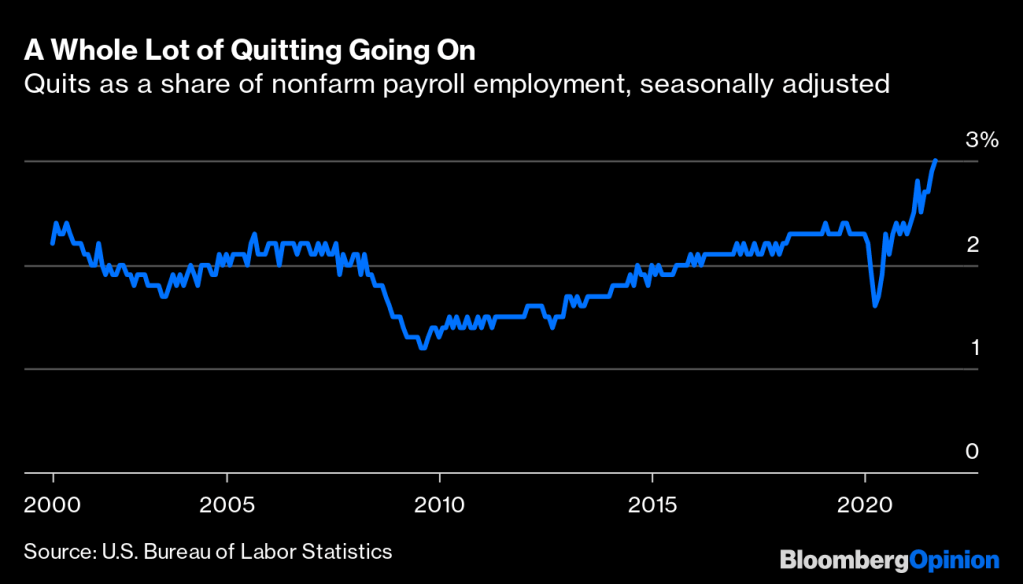
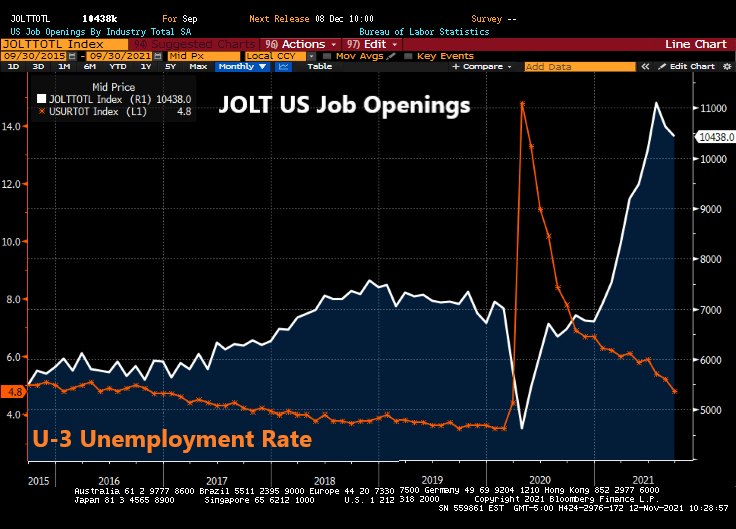
Is the US at full employment? That is, is the US at REALISTIC full employment? And if the US is at realistic full employment, why is The Federal Reserve keeping rates at 25 basis points??
Let’s start with the “quits” data. An estimated 3% of American workers quit their jobs in September, the Bureau of Labor Statistics reported last week.1That’s the highest percentage since the BLS started keeping track two decades ago.
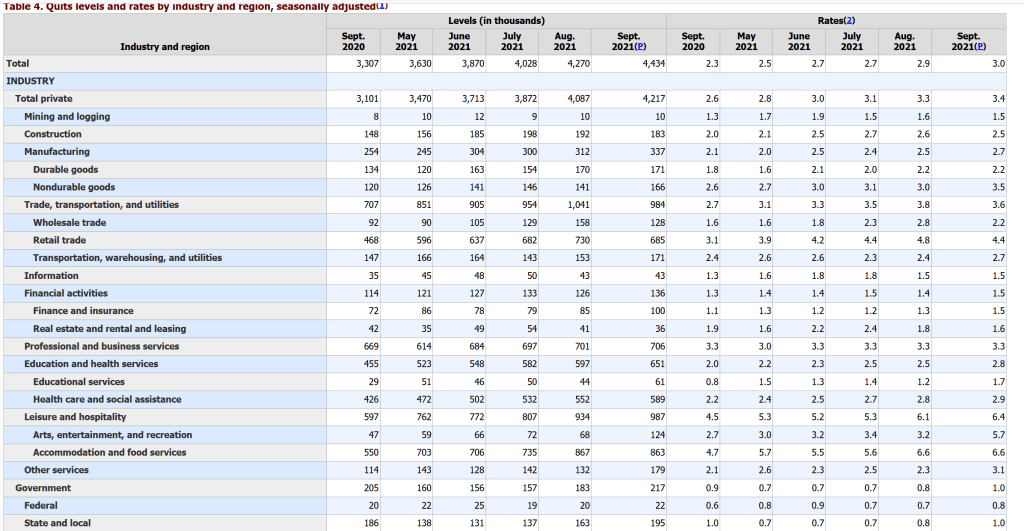
Front-line and low-wage workers are leaving at rates higher than historical norms while higher-paid office workers aren’t. College-educated workers haven’t been quitting or dropping out of the workforce at higher rates than before the pandemic, but less-educated workers have.
The quits rate in professional and business services was just 0.4 percentage points higher in September than before the pandemic in February 2020. In financial activities it was unchanged. In the information sector, made up of telecommunications, publishing, broadcasting, motion pictures, software and most internet companies, the quits rate was down 0.3 percentage points.
The biggest increases in quit rates were in sectors such as leisure and hospitality where office workers are few, working remotely seldom an option and wages low. Within manufacturing, the quits-rate increase has been much bigger in lower-paying nondurable goods (of which food manufacturing is the biggest part) than in higher-paying durable goods.
In particular, fast food restaurants are offering above minimum wage salaries to attract workers. Burger King was even offering college tuition (not to University of Chicago, but to the local community college).
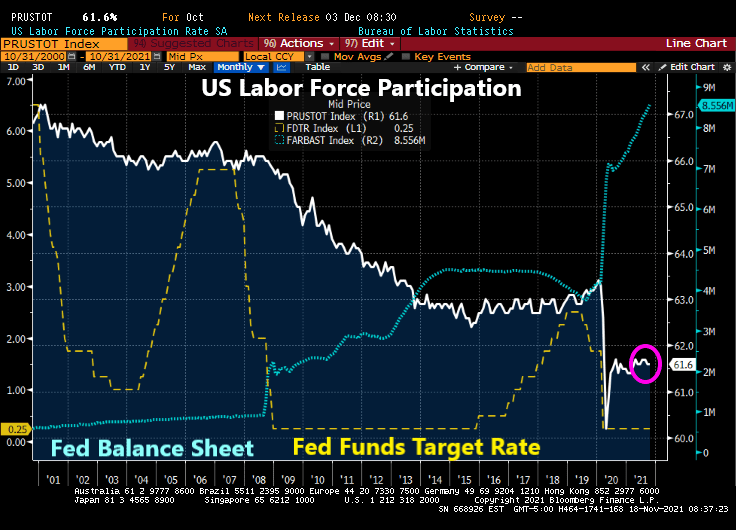
Labor force participation crashed with COVID and has struggled to recover, despite the staggering monetary stimulus. If this a sign that the US is at full employment (or very difficult to entice workers to enter and stay in the labor force)?


You must be logged in to post a comment.