Alarm! US home prices are decelerating as inflation rages and The Fed tightens.
Home price growth in the US slowed the most on record as a doubling of borrowing costs (thanks to the US Federal Reserve) has sapped demand.
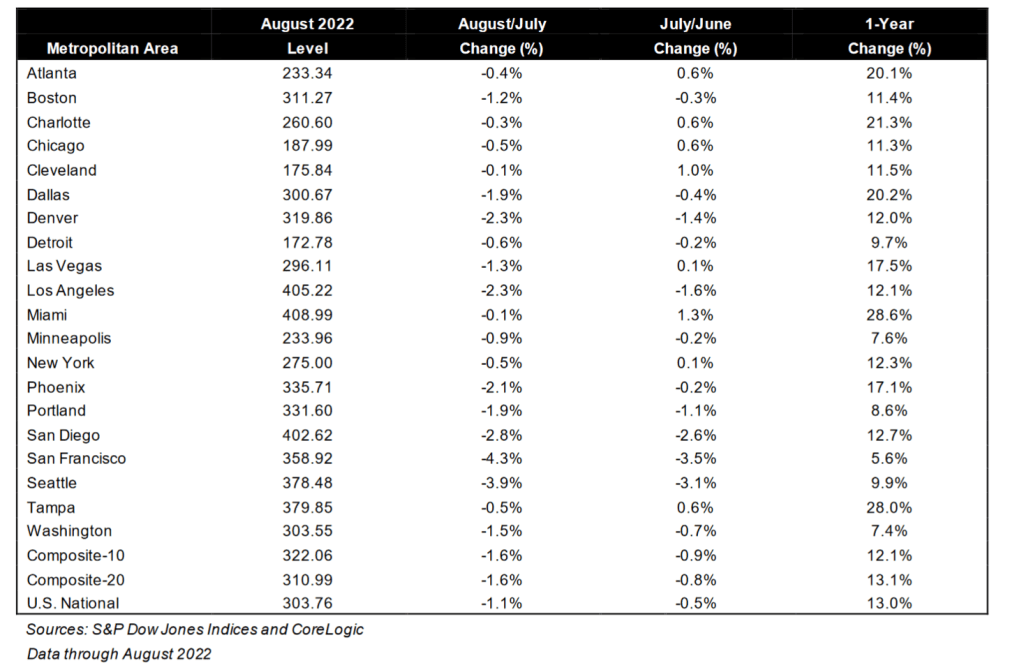
A national measure of prices increased 13% in August from a year earlier, but is down from 20.79% in March, the S&P CoreLogic Case-Shiller index showed Tuesday. That’s the biggest deceleration in the index’s history.
The housing market has started to slump as the Federal Reserve hikes interest rates to curb the hottest inflation in decades. Even with the deceleration, prices remain high compared to last year. Coupled with mortgage rates that are edging closer to 7%, many would-be buyers have been shut out, while some sellers have retreated.
While 13% growth sounds good, it is not good for renters looking to buy a home.
According to S&P/CoreLogic/Case-Shiller, Southern (red) cities Atlanta, Charlotte, Dallas, Miami and Tampa all still grew at over 20% YoY. Other cities like blue cities Detroit, Minneapolis, Portland, San Francisco, Seattle and Washington DC are grew at UNDER 10% YoY.
On related news, I always said in my classes that +/- 10 basis point in the US Treasury yield is a big deal. This morning, the US Treasury 10-year yield is DOWN -16.1 bps. In fact, the 10-year yields are down across the board globally.
Things are getting interesting in DC, to say the least. The US is 100% likely to face a recession in the next 12 months while The Federal Reserve is on its crusade to fight inflation caused by … The Federal Reserve, Biden’s green energy shenanigans and massive, irresponsible Federal spending that even Former Obama economist Lawrence Summers warned would cause inflation. So what will The Fed do? Lower rates and expand their assets purchases to fight the impending recession OR keep tightening to fight Bidenflation? But where we are now is that the fixed-income market could be in big, big trouble.
For months, traders, academics, and other analysts have fretted that the $23.7 trillion Treasuries market might be the source of the next financial crisis. Then last week, U.S. Treasury Secretary Janet Yellen acknowledged concerns about a potential breakdown in the trading of government debt and expressed worry about “a loss of adequate liquidity in the market.” Now, strategists at BofA Securities have identified a list of reasons why U.S. government bonds are exposed to the risk of “large scale forced selling or an external surprise” at a time when the bond market is in need of a reliable group of big buyers.
“We believe the UST market is fragile and potentially one shock away from functioning challenges” arising from either “large scale forced selling or an external surprise,” said BofA strategists Mark Cabana, Ralph Axel and Adarsh Sinha. “A UST breakdown is not our base case, but it is a building tail risk.”
In a note released Thursday, they said “we are unsure where this forced selling might come from,” though they have some ideas. The analysts said they see risks that could arise from mutual-fund outflows, the unwinding of positions held by hedge funds, and the deleveraging of risk-parity strategies that were put in place to help investors diversify risk across assets.
In addition, the events which could surprise bond investors include acute year-end funding stresses; a Democratic sweep of the midterm elections, which is not currently a consensus expectation; and even a shift in the Bank of Japan’s yield curve control policy, according to the BofA strategists.
The BOJ’s yield curve control policy, aimed at keeping the 10-year yield on the country’s government bonds at around zero, is being pushed to a breaking point.
Well. Bidenflation certainly isn’t helping, but Statist Economist and Cheerleader Janet Yellen can’t bring herself to blame green energy policies, rampant Federal spending or irresponsible Federal Reserve policies for the crisis.
You will note the differences between today and the financial crisis of 2008-2009. The financial crisis gave us a massive surge in government securities liquidity thanks to then Fed Chair Ben Bernanke imitating Japan’s Central Bank and buying US government securities. Fast forward to today and the liquidity index hasn’t budged much since 2010 (except for a little blip around the Covid Fed intervention of early 2020), but we are now seeing near 40-year highs in inflation and a barely declining Fed balance sheet. And M2 Money YoY (mostly commercial bank deposits) are crashing.
I am guessing that The Fed will pivot given that stock futures are way up for Monday. The Dow Jones mini is up 770 points and the S&P 500 mini is up 88.75 points.
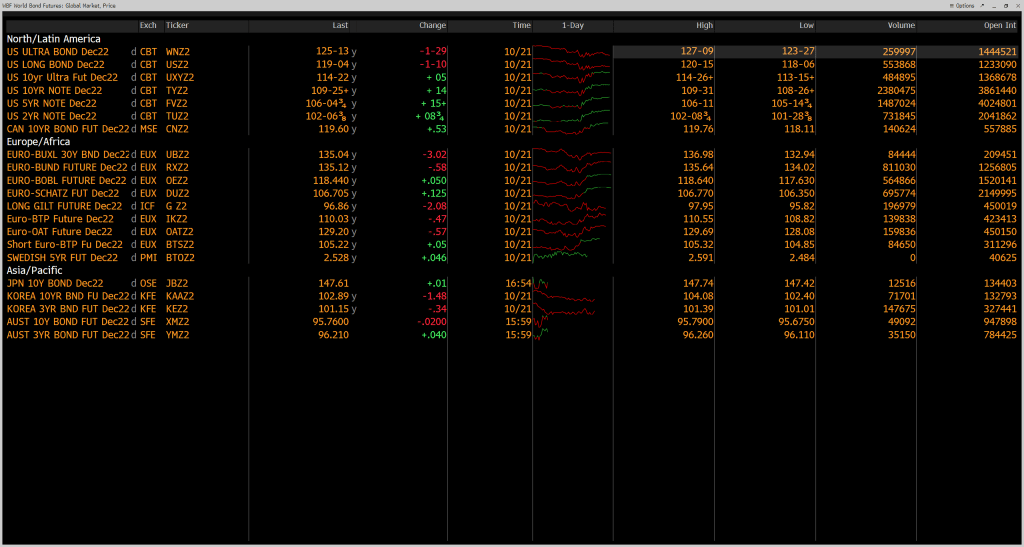
Bond market futures (specifically the US Ultra Bond) is down for Monday, meaning yields will be climbing.
I remember giving a speech at The Brookings Institute in Washington DC. Talk about stranger in a strange land. One person who I was debating got frustrated and said “You are such a … Republican!!!” As if that was the worst slur he could throw at me.
Like virtually everything in Biden’s economy, the price of turkey (often the main staple for Thanksgiving dinner) is way up in price. Turkey prices are UP 73% since last year. The price per pound of an 8- to 16-pound turkey has risen to $1.99, a 73% increase from $1.15 last year, according to USDA data.
Speaking of turkeys, in recent speeches, President Joe Biden has been misleadingly taking credit for cutting federal deficits by historic amounts, though most of the reduction in deficits is the result of expiring emergency pandemic spending. Deficits fell between fiscal year 2020 and 2021 far less than initially projected after Biden added to them with more emergency pandemic and infrastructure spending.
And apparently Biden (or Jill) haven’t looked at the data recently. While there was a momentary budget surplus in April 2022, the Federal budget deficit has increased dramatically in September 2022 to the worst deficit since March 2021 shortly after Biden took office.
The only thing that is strong under Biden is the labor market. But even the accomplishment is grossly misleading. Under Trump, the U-3 unemployment rate was 3.5% in February 2020 just before Covid-13 struck and the Fauci-ites shut down the economy causing unemployment to rise to 14.7% in April 2020. Most of the reduction in the unemployment rate was the result of the economy slowly opening back up under Trump. When Biden took over, the unemployment rate was 6.4% and it is finally back to Trump’s 3.5% in September 2022. At least Biden didn’t screw that up, as Obama has said. Perhaps that should be his new midterm campaign slogan!
But Biden DID screw up the labor market with Bidenflation. REAL average hourly earnings growth (yellow line) is NEGATIVE..
And yes, the US is rapidly approaching recession which will result in a spike in unemployment. So much for Biden’s “Strong as hell!” economy.
Bloomberg’s recession probability over next 12 months is … 100%.
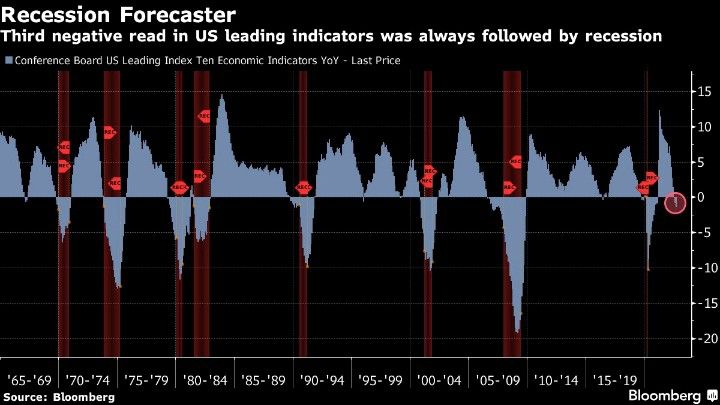
And how about the Conference Board’s Leading index of 10 economic indicators YoY? Third negative read ALWAYS followed by recession.
The Federal Reserve may be forced to pivot. This may be one reason why the Dow is up 565 points today (+1.86%) as recession and pain become ever more likely.
Look at commercial banks deposits. Wonder why liquidity is drying up?
One of my friends on Wall Street wrote my yesterday claiming “The 10-year Treasury yield is set to crash. Brace for impact!” Then I logged into Bloomberg this AM and saw the 10-year Treasury yield up almost 10 basis points (although it is down -2 BPS at 10:20am). Did markets not read his comments?? Maybe they did!
Well, The Fed is doing the Tighten Up. That is, The Fed is FINALLY removing their excessive monetary stimulus left over from the Bernanke Blowout (2008 adopting Japan’s print ’till you drop model).
But as The Fed removes their monetary stimulus (rate increases), we are seeing negative effects in the housing market. I call this chart “The X Factor.”
The US Treasury 10-year yield is up to 4.3% this morning, a far cry from 1.804% when Biden was crowned as President on January 20, 2021. The 30-year mortgage rate is up from 3.67% on Coronation Day to 7.32% yesterday, an increase of … 100% (that is, the 30-year mortgage rate has doubled under Biden). At the same time, Existing Home Sales YoY have gone from -2.41% in January 2021 to -23.79% in September 2022. THAT is a HUGE decline!
University of Michigan’s consumer sentiment for housing for 77 in January 2021 to 39 in November 2022. That is a -49% decline in consumer confidence. Also a big decline.
But going back to my pal’s email, he also said that The Fed is unwinding its balance sheet at a dangerously rapid rate (orange line). Relative to just increasing it, I would agree with him. But The Fed’s balance sheet is barely declining to my eyes. The troubling thing for housing is that inflation is so hot that REAL average hourly earnings YoY (yellow line) has fallen from +0.24% growth YoY on January 25, 2021 to a horrific -2.80% YoY rate in September 2022.
Bill’s point to me is that lending is still hot (at least commercial and industrial lending or C&I) while The Fed’s balance sheet remains in force (green line).
The Fed has a lot more work to do if they want to cool the commercial lending market. They have successfully slowed down the residential mortgage market.
US 30-year mortgage rates rose to 7.20% yesterday, the highest rate since 2000. Why?
Core inflation is rising and its the highest since 1992. Diesel prices, the all-important fuel for the transportation industry, is rising again after a brief respite and is near the all-time high.
But will mortgage rates continue to rise? That depends on The Federal Reserve. Will they continue to try to combat inflation (largely caused by … The Federal Reserve and voracious Federal spending under Biden/Pelosi/Schumer (The Three Amigos).
As of today, investors in Fed Funds Futures are pointing to a peak of Fed tightening in May 2023, then a slow decline in rates.
While this is The Fed Funds rate, it is likely that mortgage rates will continue to rise to May 2023 then level out at 9%-9.25%.
I really miss teaching college students. An example of a test question I gave was the first chart: who was The President when all hell broke loose (pink box)? 1) Joe Biden, 2) Donald Trump or 3) Millard Fillmore?
The answer, of course, is Joe Biden.
Doesn’t Millard Fillmore, the 13th President of the United States, look like actor Alec Baldwin after too many cheeseburgers and chocolate milkshakes at In-N-Out Burger?
Bear in mind that the are numerous wildcards in play, like the Russia/Ukraine war and the probability the China will invade Taiwan in the near future.
Model is down 20% this year, its worst return since 2008
Yet routs could allow model to ‘rise from the ashes’
(Bloomberg) Blame the Fed, war and fiscal profligacy all you want. But big trouble was lurking in many widely followed portfolio strategies long before those threats took hold (because of the Fed).
That’s the upshot of new research that uses a yield-derived valuation model to show the famous 60/40 allocation reached its most expensive level in almost five decades during the Covid-19 rally. The situation has reversed in 2022, which is now by some definitions the worst year ever for the bond-and-equities cocktail.
The data is a harsh reminder of the primacy of valuation in determining returns. It may also pass as good news for the investment industry, suggesting logic rather than broken markets is informing the current carnage. Leuthold Group says the hammering has been so brutal that valuation is apt to become a tailwind again for a portfolio design many seem willing to leave for dead.
It’s worth considering the heights from which 60/40 has fallen. Yields on the Bloomberg USAgg Index slid in 2021 to 1.12%, while the earnings yield on the S&P 500 dropped to 3.25%, one of the lowest readings in the last four decades. Taken together the levels had never implied a more bloated starting point for cross-asset investors.
To be sure, the 60% stock, 40% bond mix did a good job of protecting investors against market swings in the past. This year has been different, with stocks and bonds falling in tandem amid stubbornly high inflation and the Federal Reserve’s whatever-it-takes approach to bringing it down. A Bloomberg model tracking a portfolio of 60% stocks and 40% fixed-income securities is down 20% this year, a hair away from topping 2008 as the worst year ever and only the third down year since Bloomberg started tracking the data in 2007.
The co-movement of equities and bonds has tightened “decisively” in 2022, with three-month rolling correlations jumping to a 23-year high of 45%, versus the 10-year average of minus 25%, according to Mandy Xu and Frank Poerio at Credit Suisse Group AG. In other words, both are selling off in tandem, with the two recently posting 11 consecutive days of moving together, a streak not seen since 1997. And their performance is twice as bad this year as it was in 2002 when stocks posted a similar drawdown.
“We were coming off historically high valuations for both equities and fixed income,” Marvin Loh, senior macro strategist at State Street Global Markets, said in an interview. But the strategy could soon start to do what it’s supposed to do, he added, “because you’re getting in with fixed-income valuations that make a whole lot more sense. There’s a lot more natural buyers for a 4% 10-year than there is for 0.3%.”
Plenty of others have taken this view as well — cross-asset strategists at Morgan Stanley said over the summer that the 60/40 portfolio was merely resting and not yet dead, while researchers at the Independent Adviser for Vanguard Investors said it was a bad time to “steer a new path” and abandon the balanced approach.
Elsewhere, exchange-traded fund investors are preparing for the possibility that peak bond pain has passed, with investors scooping up call options on products like the iShares 20+ Year Treasury Bond ETF (ticker TLT) and the iShares iBoxx $ Investment Grade Corporate Bond ETF (LQD).
Let’s see how it all works out as M2 Money YoY crashes with Fed tightening.
Well, this isn’t good. But it is consistent with the highest inflation rate in 40 years and The Federal Reserves’ counterattack. Basic mortgage applications are now down to their lowest level since 1997 as mortgage rates rise.
Mortgage applications decreased 4.5 percent from one week earlier, according to data from the Mortgage Bankers Association’s (MBA) Weekly Mortgage Applications Survey for the week ending October 14, 2022.
The Refinance Index decreased 7 percent from the previous week and was 86 percent lower than the same week one year ago. The seasonally adjusted Purchase Index decreased 4 percent from one week earlier. The unadjusted Purchase Index decreased 3 percent compared with the previous week and was 38 percent lower than the same week one year ago.
Bear in mind that these numbers are for the week of October 14, so the home purchase season is in the “house latitudes.” That is, the slow season for home sales. The refinancing applications index has dropped thanks to Fed tightening.
Joe Biden reminds me of Dennis Reynolds from “Its Always Sunny In Philadelphia.” And his D.E.N.N.I.S System. But Biden’s System is blatant politics. With the midterm elections in November and Democrats looking a bit behind, Biden is pulling out the political guns by 1) ramping up student loan forgiveness … again and 2) releasing 10-15 million MORE barrels from the Strategic Petroleum Reserve to lower gasoline prices. Particularly after his failed attempts to get the Saudis to pump more oil (too bad Biden put the kabash on US energy exploration and cancelled the Keystone pipeline).
Having said that, we can see that BEFORE the latest SPR order, the US Strategic Petroleum Reserve, meant to cope with national emergencies like … Russia dropping a nuke on the US, has declined -36% under Nuclear Joe.
At the same time, regular gasoline prices are UP 62% under Biden and the all-important diesel fuel prices are UP 101.4% under Biden.
Of course, expect The B.I.D.E.N System to do everything in its power to destroy the economy if Republicans win the midterms. Including no more SPR release.


You must be logged in to post a comment.