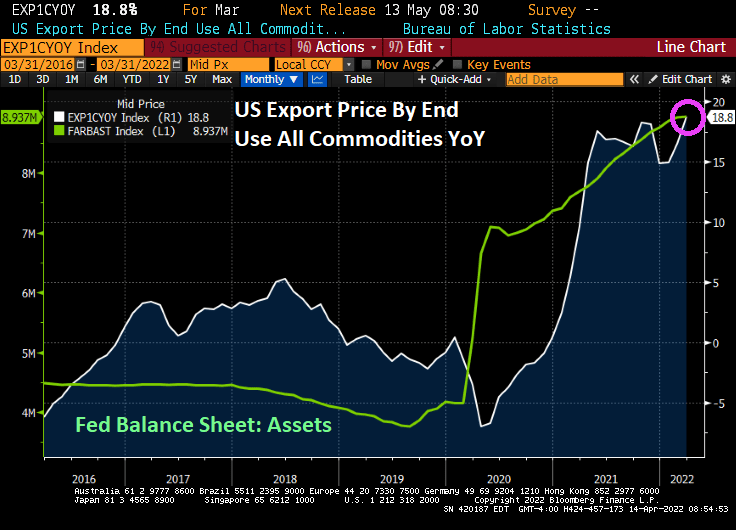
Export prices by end us YoY is up to 18.8%, the highest in recorded history (or since 1983 when they started recording export prices).
Import prices by end use rose to 12.5% YoY.
Unrelated to US export and import prices, the MBA’s mortgage credit availability index slumped with the Covid outbreak and the explosion of The Fed’s Balance Sheet. As I have said before, nothing has been the same since Covid.
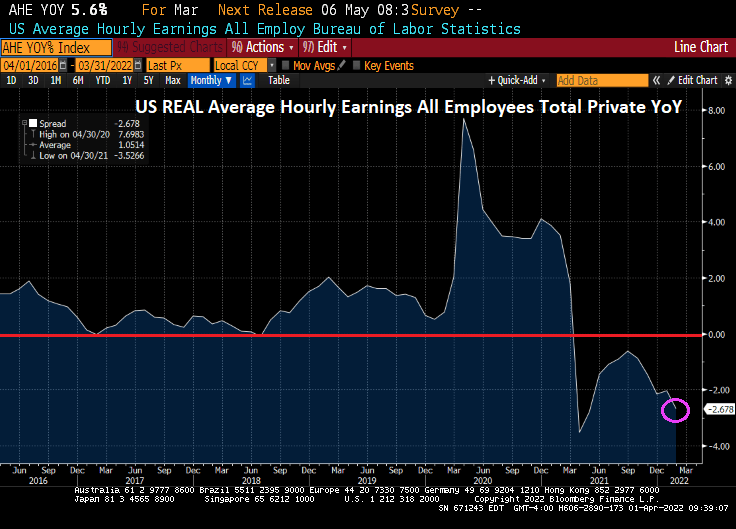
US real average weekly earnings growth YoY is down to -3.60%. That is the lowest since 2007 and is worse than The Great Recession and financial crisis of 2008.
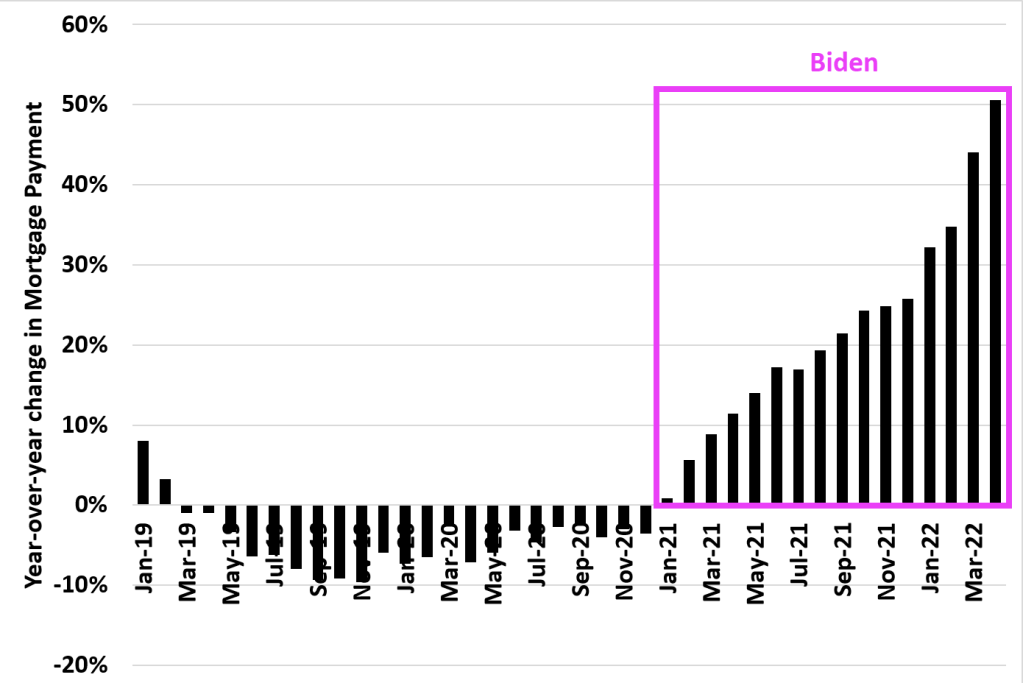
And look at this chart of mortgage payments under Biden. The US was actually experiencing DECLINING mortgage payments YoY in 2019 and 2020. But under Biden’s leadership, mortgage payments have increased by 50% making housing even MORE unaffordable for the middle class and lower-income households.
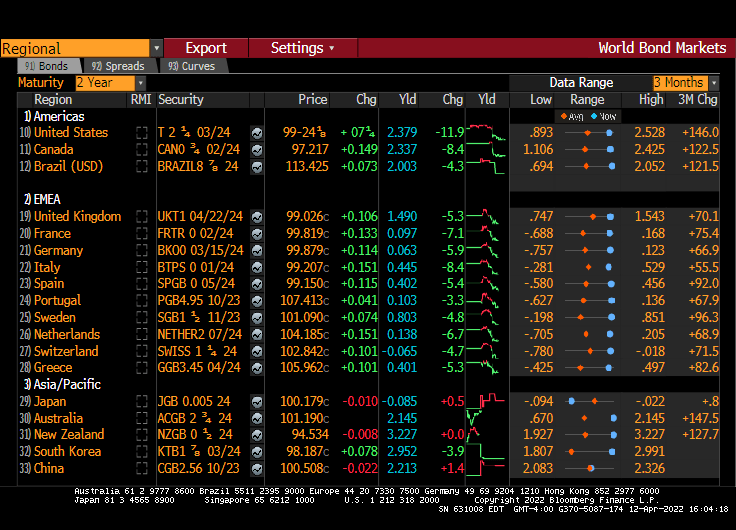
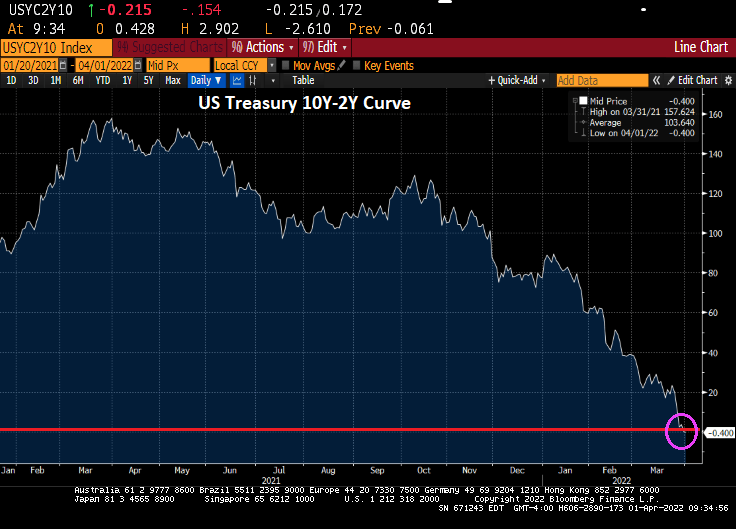
And now for something kind of scary. The US today suffered a 12 basis point decline in the 2-year Treasury yield, generally a bad sign for the economy. As if we needed more bad news for today.
Highest inflation in 40 years, worst wage growth since 2007 and rising mortgage payments. We will need all the luck we can get.
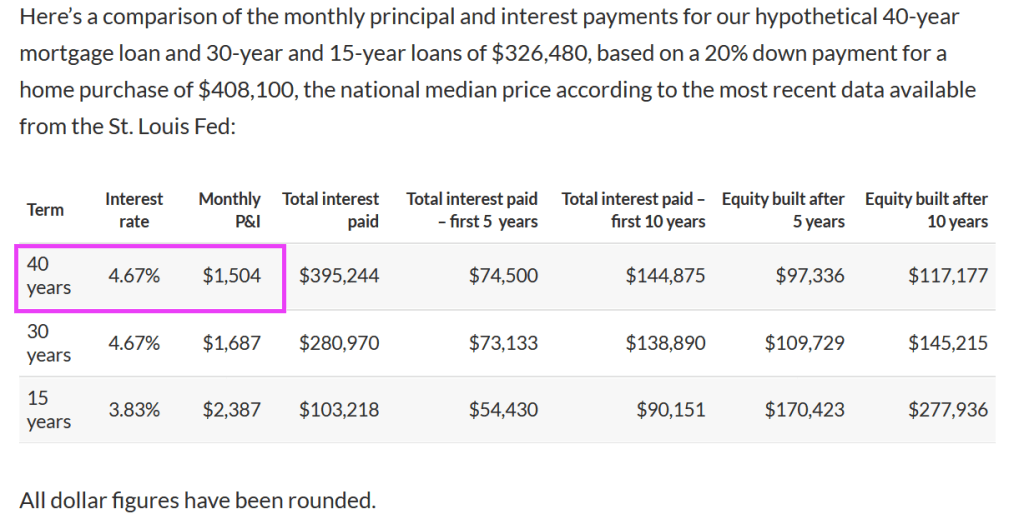
To make a long story short, a 40-year mortgage, by stretching the payment out from 30 to 40 years, means that the mortgage mortgage payment declines from $1,687 to $1,504.
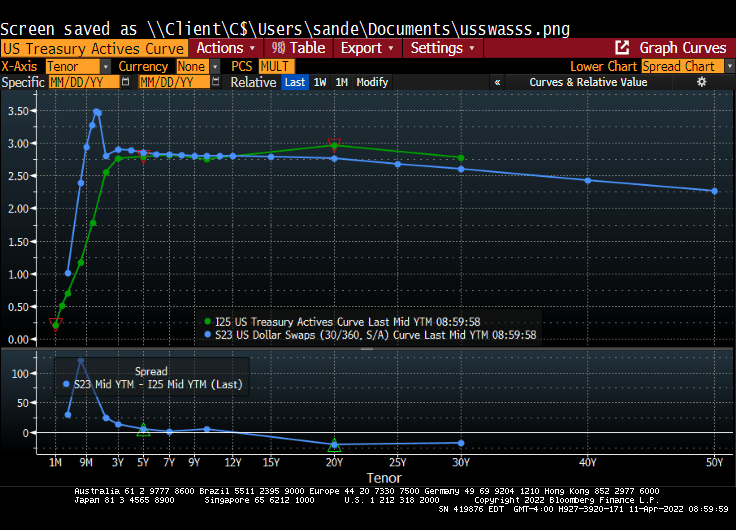
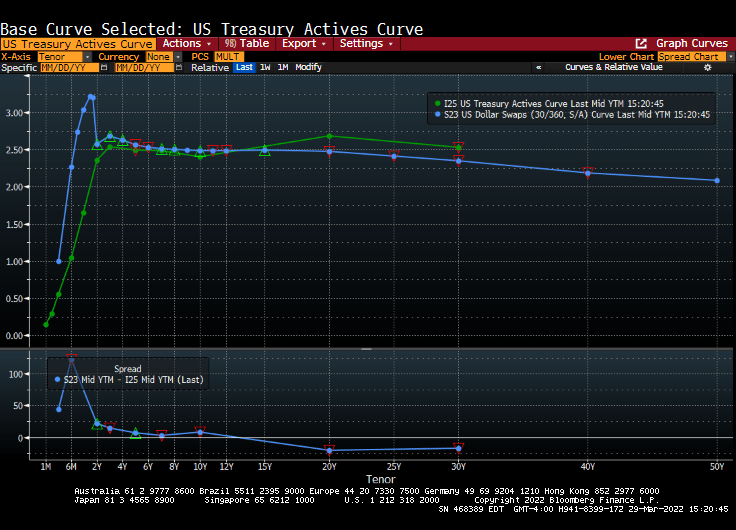
Given that the US Treasury yield curve only goes out to 30 years, lenders (and Fannie Mae and Freddie Mac) will have to use the US Dollar Swaps curve to price mortgages. And since the swaps curve is downward sloping, we could see 50-year mortgages at a lower rate than 30-year mortgages, ceteris paribus.
But with The Fed planning on taking away the monetary punchbowl, mortgage rates are rising making housing even more unaffordable.
But most things are not equal. The 40-year mortgage results in a slower paydown of the mortgage, increasing the lender’s exposure to property value declines. A 50-year mortgage would even be worse.
But the real problem with the 40-year mortgage is that it can lead to even MORE unaffordable housing. Yes, going from 30-year to 40-year mortgages lowers the mortgage payment, but a 40-year mortgage could increase the demand for housing. And since we already have soaring home prices since Covid (thanks to Fed monetary policy AND Federal government stimulus), we could actually see a worsening of the housing bubble). Particularly since REAL average earnings are declining.
What a mess that has been created by the government’s pursuit of “affordable housing.” Ideally, the Federal government could help raise household earnings through lowering of Federal tax rates, but the Biden Administration wants to raise taxes. Alternatively, lenders (and Fannie Mae and Freddie Mac) could lower lending standards (e.g., lowering required credit scores), or reduce downpayments to 0%. Lowering credit standards and reducing required downpayments are also inflationary and pose serious potential problems with default risk.
Not to mention that a 40-year mortgage increases the duration risk for owner’s of the 40-year mortgage.
And don’t forget that local governments frown on multifamily (apartment) construction (the Not In My Backyard [NIMBY] problem contributing to rising housing prices.
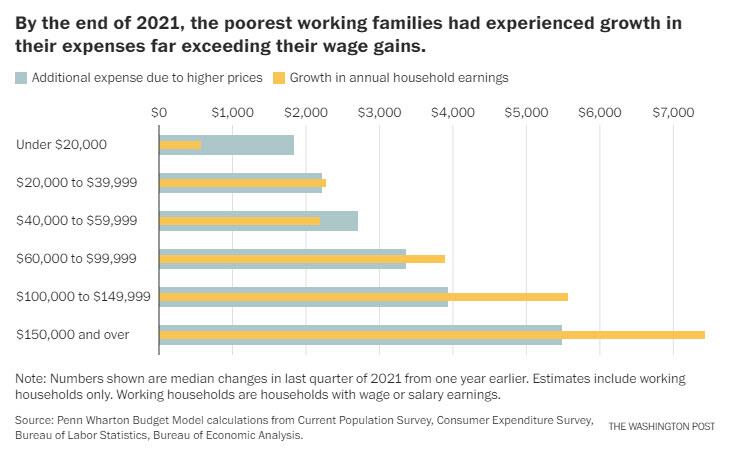
As we are painfully aware, The Fed’s exaggerated monetary flood combined with Federal stimulus spending has led to horrible inflation.
Yes, despite what government talking heads say, Federal stimulus increases demand for goods, the supply is generally slow to respond resulting in rising prices. Then government policies driving up energy prices also leads to highers prices. Throw in Federal Reserve monetary stimulypto and we have this chart from hell from Penn-Wharton. The chart shows that households earning less that $60,000 experience higher expenses due to rising prices than their gain in earnings.
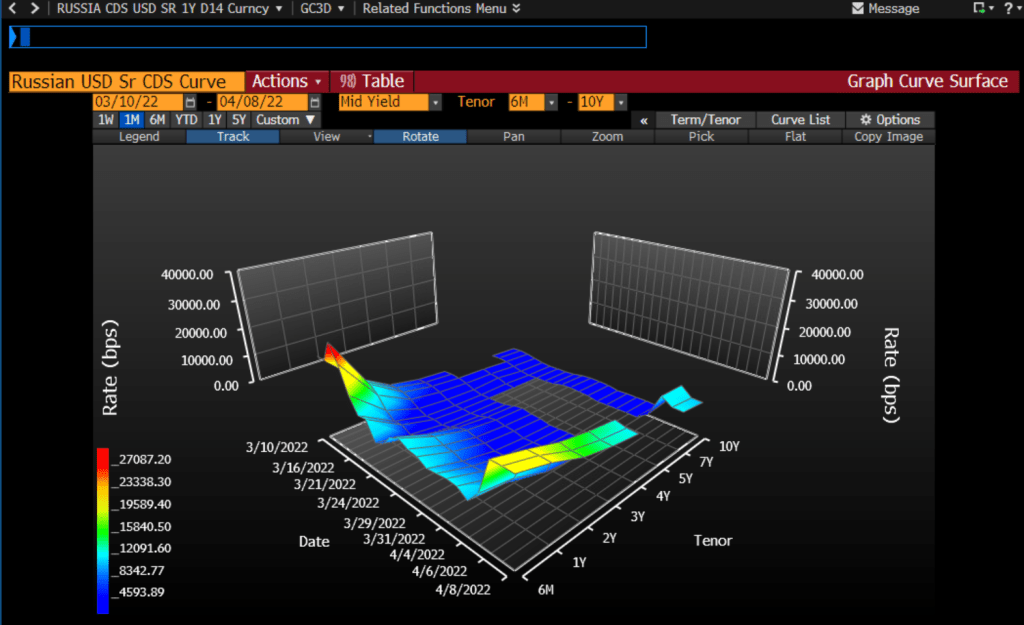
Another chart from hell is the Russian USD Credit Default Swap (CDS) curve. It is spiking at over 20,000.
The one-year Russian CDS is currently at a whopping 20,336 indicating that there is about a 99% of a Russian default over the coming year. As someone who lived through the 1998 Russian credit default scare on Wall Street, this will send a shock wave through credit and Treasury markets.
On the US Treasury front, this chart shows how steeply sloped the US Treasury actives curve has become. Steep until 3 years, then flat. I call this chart “T-Dazzle!” T-Dazzle because I can’t believe how badly the Biden Administration and The Federal Reserve are screwing up the country.
Crude oil? WTI Crude is back to almost $100 per barrel while Brent Crude is at $102.78 per barrel. Wheat is up 3.22% thanks largely to problems related to Russia invading Ukraine (Europe’s bread basket) and a dismal Chinese wheat harvest.
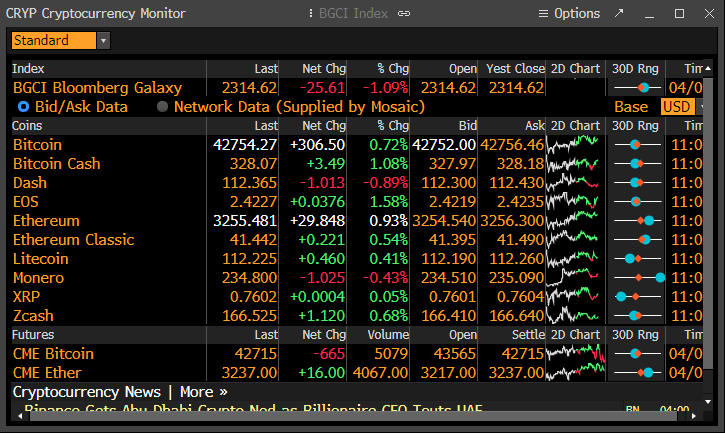
Cryptocurrencies, the alternatives to the US fiat dollar, are rising (in particular, Bitcoin and Ethereum).
Of course, I have to finish up with the soaring 30-year mortgage rate.
Well, the US have gone from “fastest economic recovery in history” to real GDP growth of less than 1% (Atlanta Fed GDPNow for Q1). In addition, the flexible price CPI less food and energy is a whopping 20%.
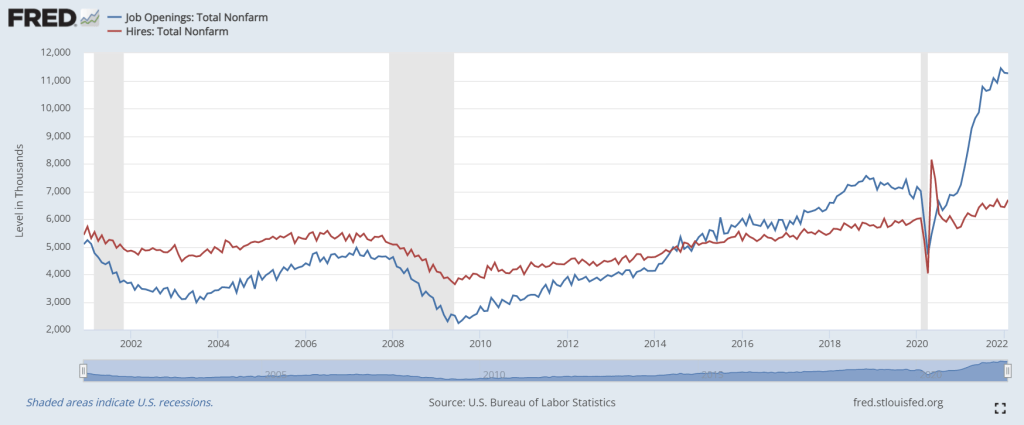
You can see “The Biden Miracle!” in the following chart. Hires (red line) dropped with Covid shutdowns, then spiked when governments opened economies again. Throw in the trillions of Federal government Covid stimulus and trillions in Fed monetary support, the Biden Miracle sees less like a miracle and more like an extremely expensive way to add jobs. But the interesting problem facing the Administration is the massive spike in job openings relative to hires (again, governments opening-up plus Federal Stimulypto).
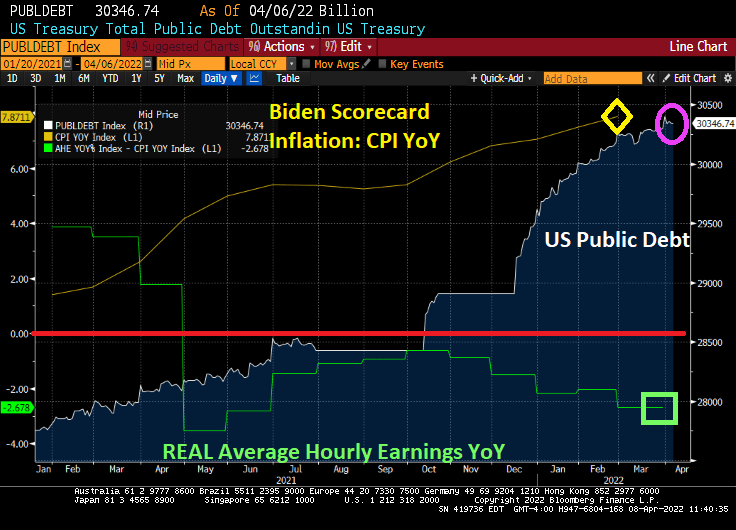
Now for a real downer of a chart. Inflation is so toxic that REAL average hourly earnings YoY is down -2.72%. Hardly the best economic growth in history.
Now we have Jerome Powell and The Blackhearts threatening quantitative tightening starting in May. Here is The Fed’s theme song “We love printing money.”
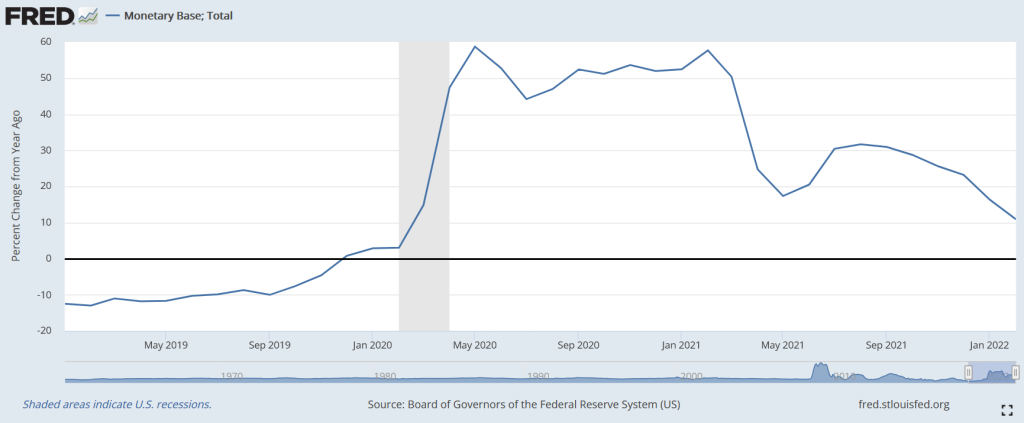
But The Fed is already slowing the growth of monetary base, although this Fed Stimulypto is still growing much faster than pre-Covid.
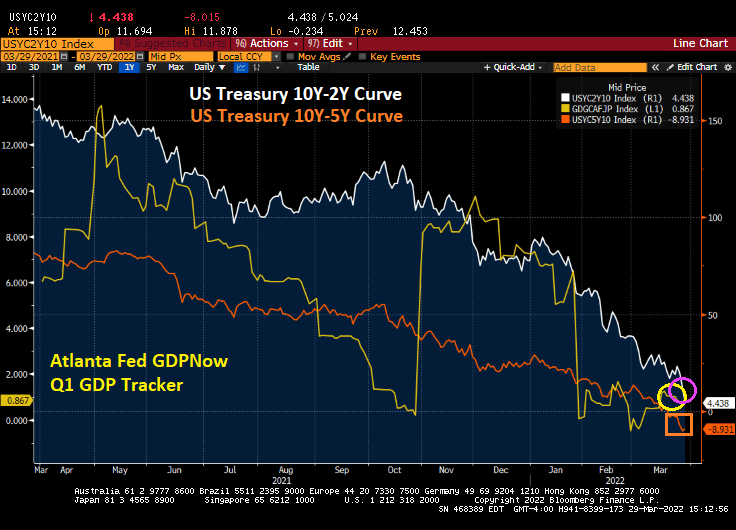
At least the 10Y-2Y Treasury curve is back above 0 bps as the Atlanta Fed’s GDPNow Q1 forecast falls to under 1%.
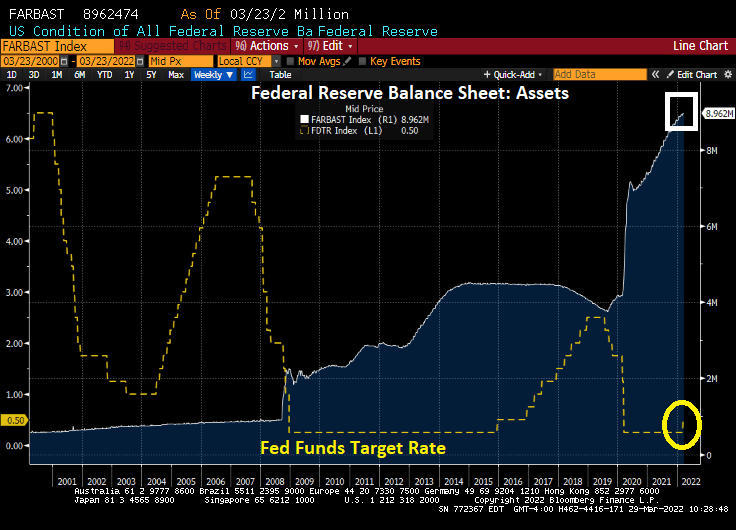
Remember, The Fed is planning on shrinking the balance sheet by $95 billion. The Fed’s balance sheet is just shy of $9 trillion. Which is around 1% per month.
With rising expectations of Fed quantitative tightening (QT), residential mortgage rates keep climbing.
Despite a slowing economy teetering on recession and a war raging in Europe, The Fed is tightening monetary policy. Allegedly to fight red-hot inflation.
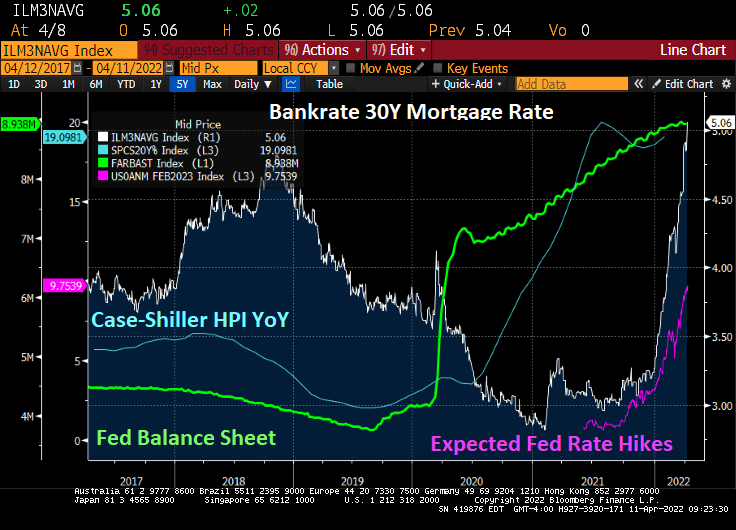
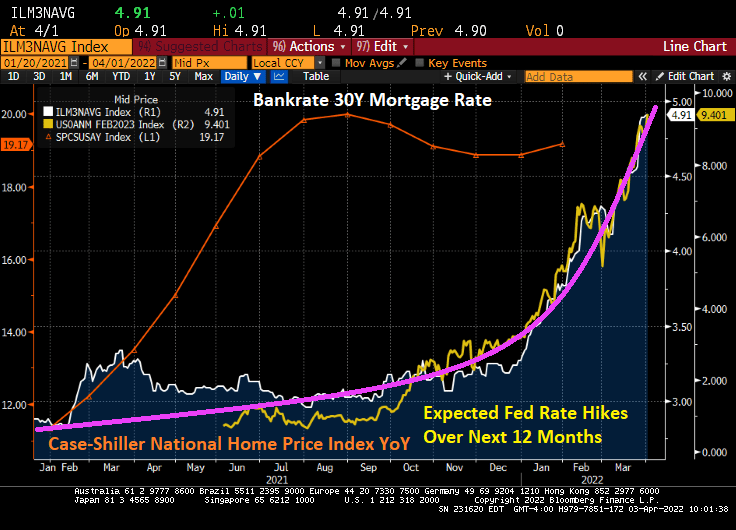
Consider what has happened since President Biden was elected. The S&P 500 total return index (green index) has risen thanks to The Federal Reserve’s balance sheet expansion (orange line) with COVID. Until 2022 when the expectation of Fed rate hikes surged from 3 in late December 2021 to 9.4 expected rate hikes over the next 12 months (yellow line).
The US Treasury total return index (white line) has gotten crushed with The Fed’s signals of rate hikes and quantitative tightening (QT). Call it “White Line Fever.” The commodity total return index (blue line) has surged as The Fed’s expected rate hikes have risen from 3 to 9.4 in 2022.
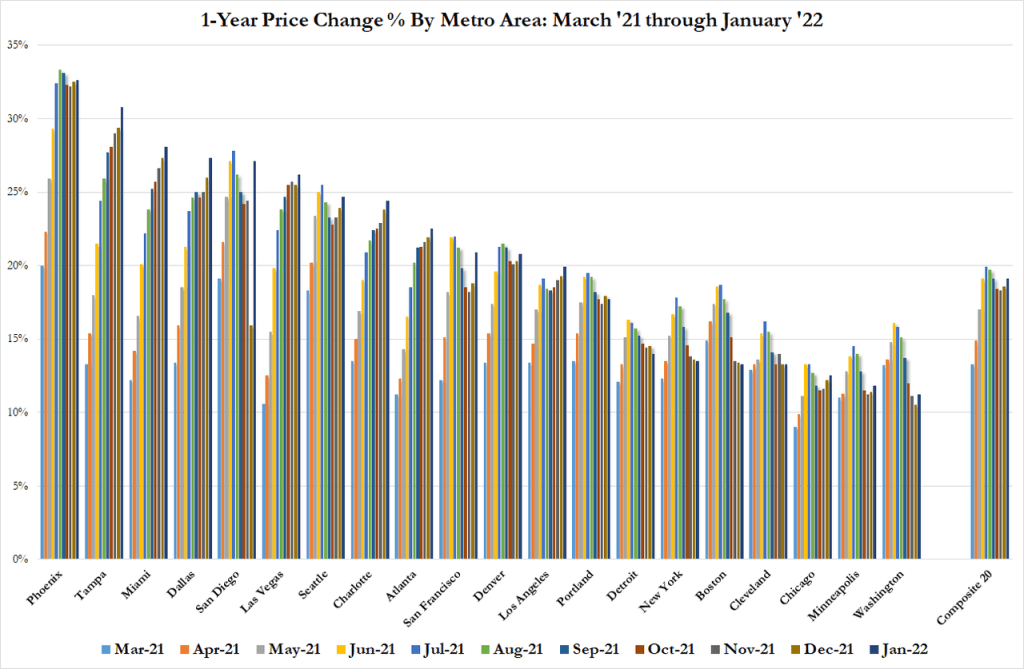
Is The Fed causing a Great Reset in housing? In 2022, we see the surge in Fed rate hike expectations leading the 30-year mortgage rate to be nearly 5%. The last Case-Shiller home price index was for January and it was still raging at 19.17% YoY growth. Let’s see if The Fed’s QT will slow down home price growth. But home prices are growing at 4x 30-year mortgage rates.
Wasting away again in Biden/Pelosiville, looking for my lost inexpensive gasoline and food. Some people say that Putin is to blame, but we know its Biden/Pelosi’s fault.
The US Treasury 10Y-2Y yield curve just inverted, generally a precursor to a recession. Called it, nothing but net!
Meanwhile, today’s jobs report shows that Bidenflation is crushing America’s wage growth. While average hourly earnings grew to 5.6% YoY, we are still seeing inflation growing at 7.9% YoY meaning that inflation is reeling hurting the middle class and lower-income households.
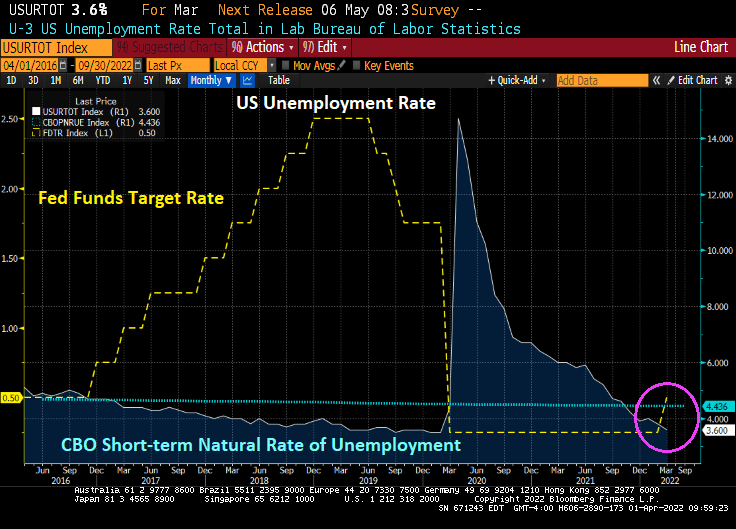
The good news is that the U-3 unemployment rate fell to 3.6%, almost back to the Trump-era unemployment rate of 3.5% prior to the Covid outbreak. And the unemployment rate remains below the CBO’s short-term natural rate of unemployment indicating that the labor market is OVERHEATED.
Today’s jobs report was pretty good, as we would expect from a recovery caused by governments shutting down economies, then reopening them. 431k jobs were added, but less than last month’s jobs added of 678k and less than the forecast 490k.
The number of people NOT in the labor force fell slightly, but it still around 100 million. The number of people holding multiple jobs to overcome Bidenflation rose to 7.5 million.
On the mortgage front, Bankrate’s 30-year mortgage rate rose to 4.90% as the 2-year Treasury rate (yellow) rises and the number of expected Fed rate hikes over the coming year is 9.26%.
As of today, Jerome “Nero” Powell and The Gang at The Federal Reserve have not trimmed the Fed’s balance sheet and have only raised their target rate once under President Biden.
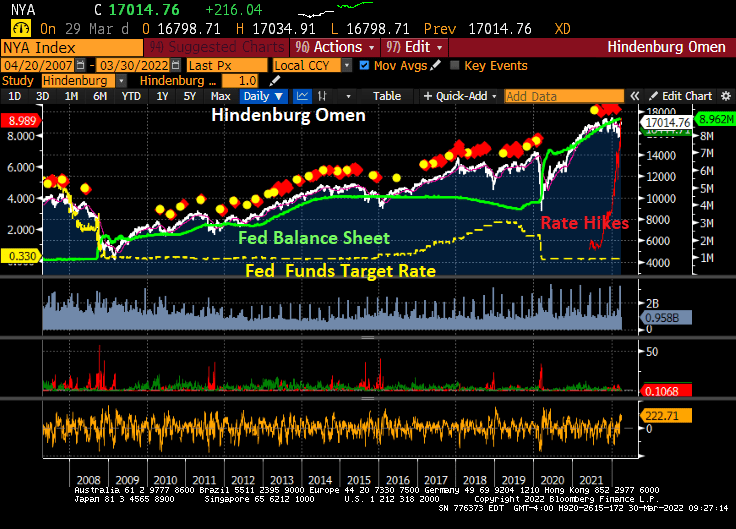
Here is the Hindenburg Omen, named for the catastrophic explosion on May 6, 1937 at Lakehurst Naval Air Station in New Jersey. The Hindenburg Omen was flashing red before the stock market correction of late 2007-2009. But, the Hindenburg Omen has flashed red repeatedly since the financial crisis, yet the S&P 500 index has kept rising. The reason? Repeated policy errors by The Fed leaving monetary stimulus in place for too long leading to a bubble forming in the stock market.
The Shiller CAPE (Cyclically-adjust price-earnings) ratio is at the second highest level since the 1800s. The highest point was the infamous Dot.com bubble and bust in 2000/2001.
Since The Fed continues to say “We have a plan!” to slow/shrink The Fed’s balance sheet and raise their target rate … it has not done anything yet (other than a 25 basis point bump at the March meeting).
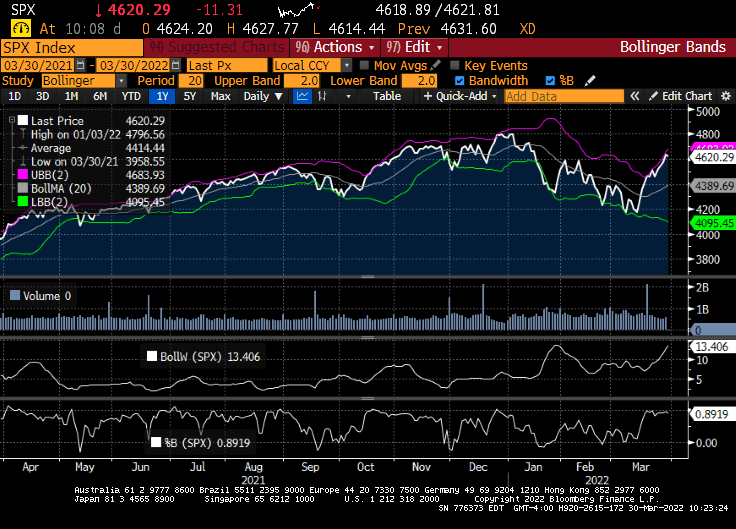
I am not advocating technical analysis for stocks, but the Bollinger Band analysis for the S&P500 index is showing the S&P 500 index near the top band indicating that a decline in likely.
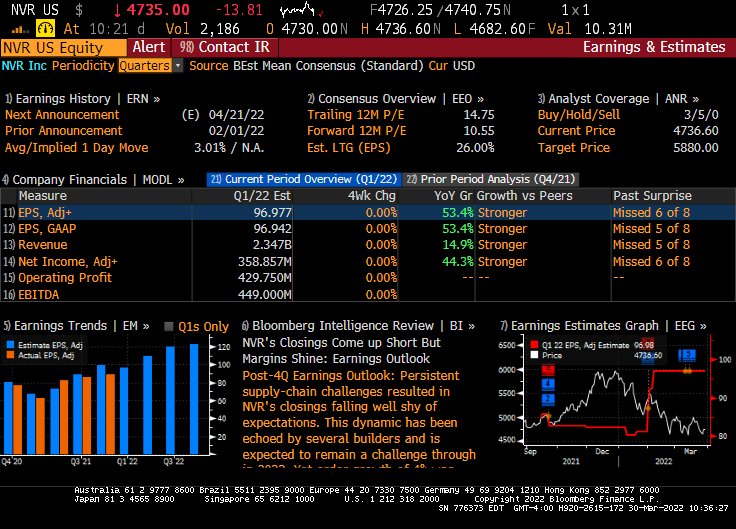
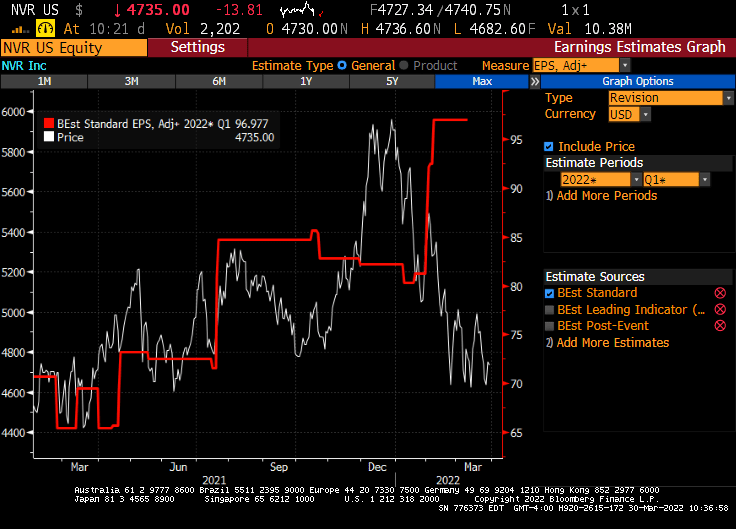
Today, the US equity market in essentially flat given the massive uncertainty about the Russia/Ukraine situation and whether the US economy is slipping into darkness. But this morning, Federal government blessed companies (healthcare, solar energy and Blackrock) are doing quite well, while homebuider NVR is taking it on the chin thanks to hints that The Fed will raising rates.
Now, NVR (Northern Virginia Homes, Ryan Homes) had explosive earnings growth in their February 1, 2022 report.
But the market is pricing in the crushing Fed rate hikes that are expected.
So, will Foul Powell pull a Volcker and raise rates and crush the economy (and stocks)? Or will Foul Powell And The Fed gang let inflation burn out of control, but preserve the massive asset bubbles?
Inflation is roaring along caused by government spending and energy policies, hurting the American middle class and lower-income groups.
Now we see the US Treasury 10Y-2Y flattening towards zero and the10Y-5Y curve slipping deeper into inversion as Q1 GDP growth slows to 0.867.
The US yield and dollar swap curves remain steeply upward sloping, but with the dollar swap curve around 120 basis points high than the Treasury yield at the 6-month tenor.
“With inflation at a four-decade high, Fed Chair Jerome Powell has set the central bank on course for a series of interest-rate increases this year. He has stressed the toll that price increases are taking on lower-income Americans.” (No duh, Jay!)
“We understand that high inflation imposes significant hardship, especially on those least able to meet the higher costs of essentials like food, housing, and transportation,” Powell said after the Fed’s interest-rate decision this month (of only a 25 basis point increase).
Philadelphia Fed’s Patrick Harker, in a speech Tuesday, said “One of our contacts, for instance, mentioned whopping membership fee increases at his golf club, suggesting this summer may be a good time to play at your local muni instead,” said Harker, a former University of Delaware president and dean of the Wharton School of the University of Pennsylvania.
Perhaps Harker wins the Derek Zoolander award for his remarks on how the rich are impacted by inflation too.


You must be logged in to post a comment.