Ford EV sales are almost nonexistant. High prices, big losses per vehicle sold, a dearth of charging stations for travel.
At least Biden will say the pain he is causing actually “hurts so good.”
Here is California governor and greaseball Gavin “Gruesome” Newsom test driving a Chinese EV on his trip to China to undercut Biden’s dying reelection prospects.
Bidenomics is a windfall for the donor class (high rate of return on campaign contributions) while the middle class gets beaten to a pulp. Waiting for Biden to lean over and creepily whisper “It’s working!” Even though it is clearly not working, at least for the middle class.
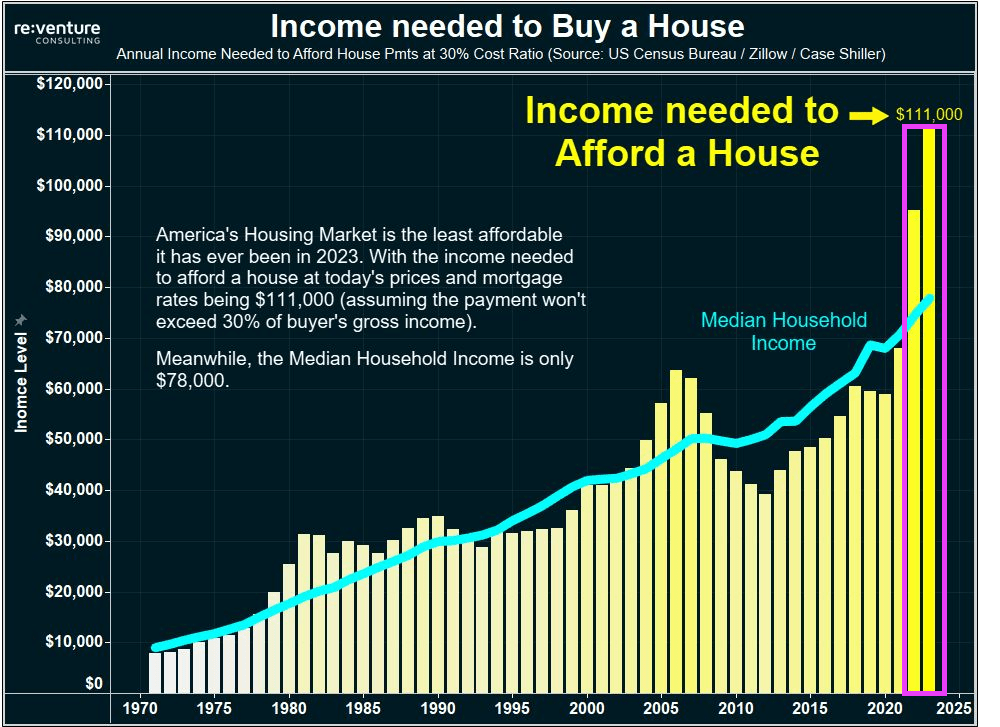
Evidence that Bidenomics is not working and destructive? Try the surging income needed to buy a house under Biden. Home prices are rising faster than median household income. As in $111,000 income needed to buy a house, while median household income is only $78,000. So, housing is simply unaffordable under Bidenomics. The Biden era is outlined in pink.
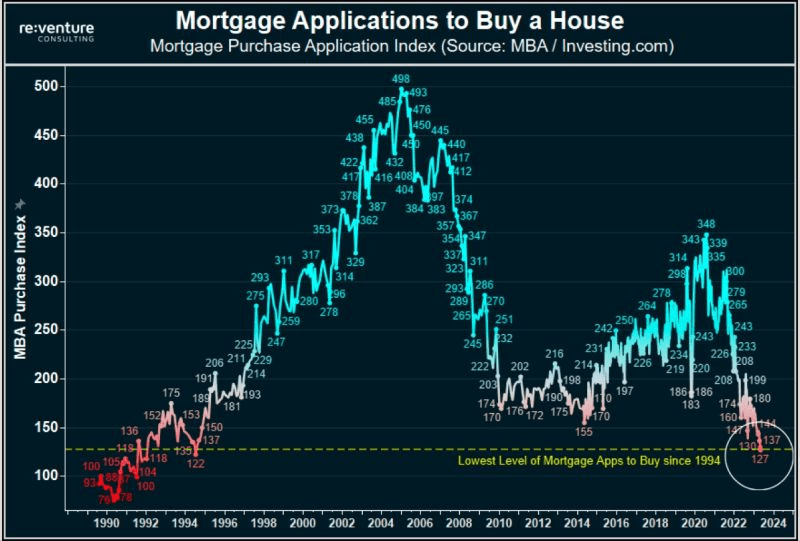
Mortgage purchase applications have collapsed to 1994 levels.
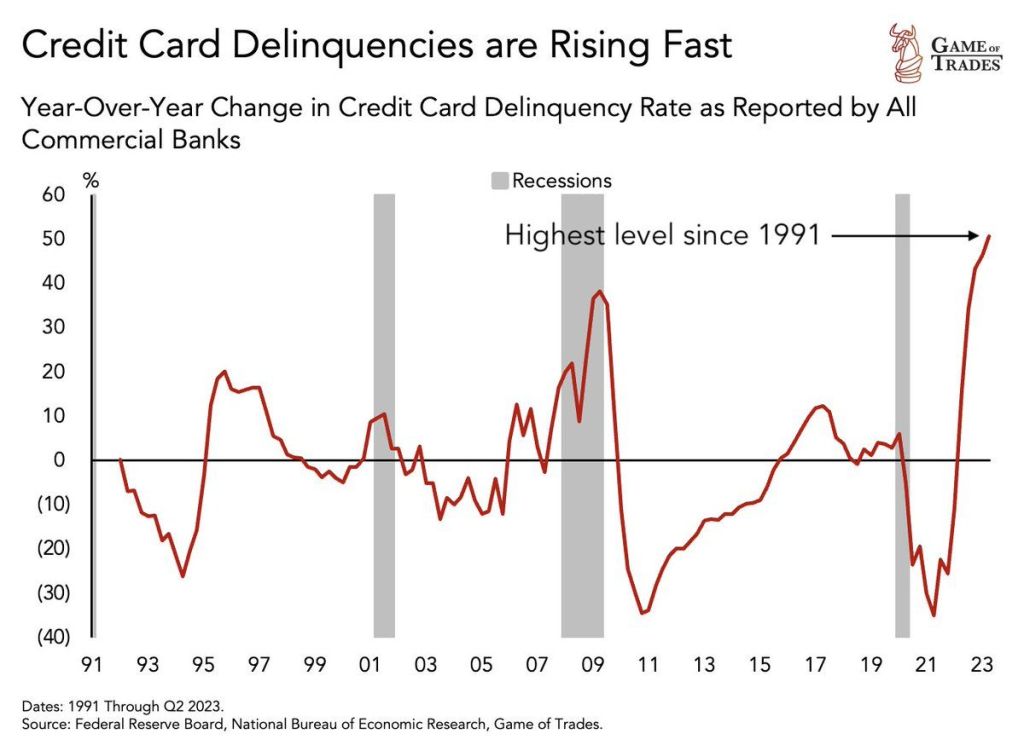
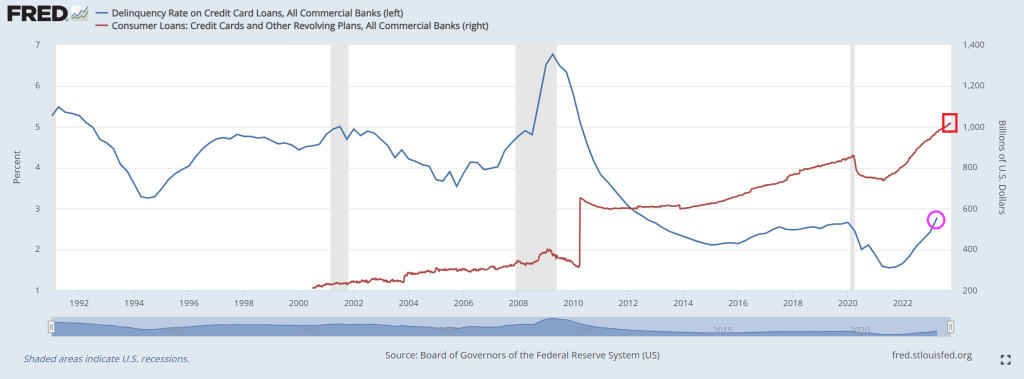
Meanwhile, stressed households are seeing credit card delinquencies at the highest level since 1991.
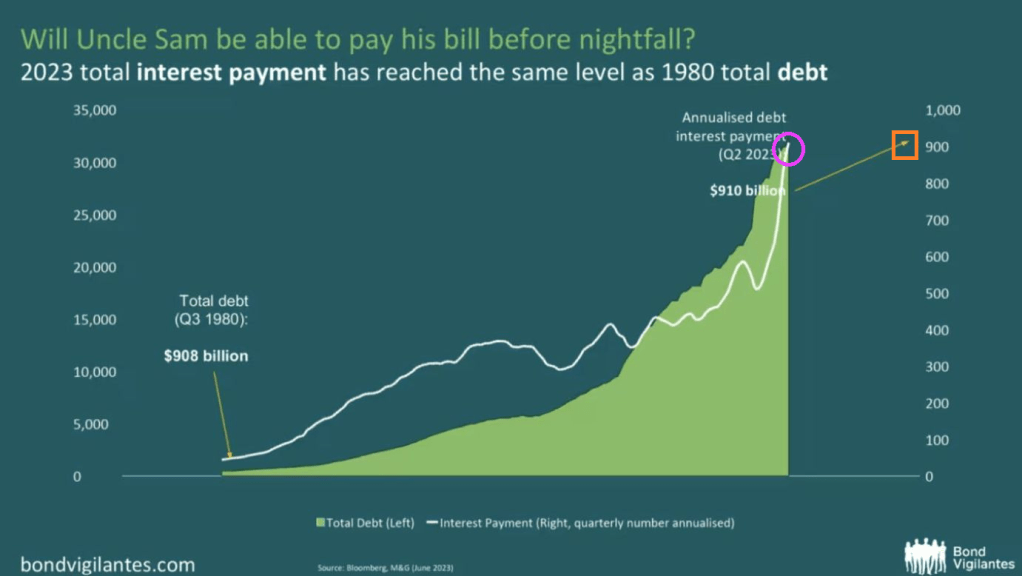
And thanks to Uncle Spam (given how Uncle Sam is destroying the middle class it is now Uncle Spam), 2023 interest payments are the same as the total debt from 1980! Spam, which the Federal government has devolved into, is very high in fat, calories and sodium and low in important nutrients, such as protein, vitamins and minerals.
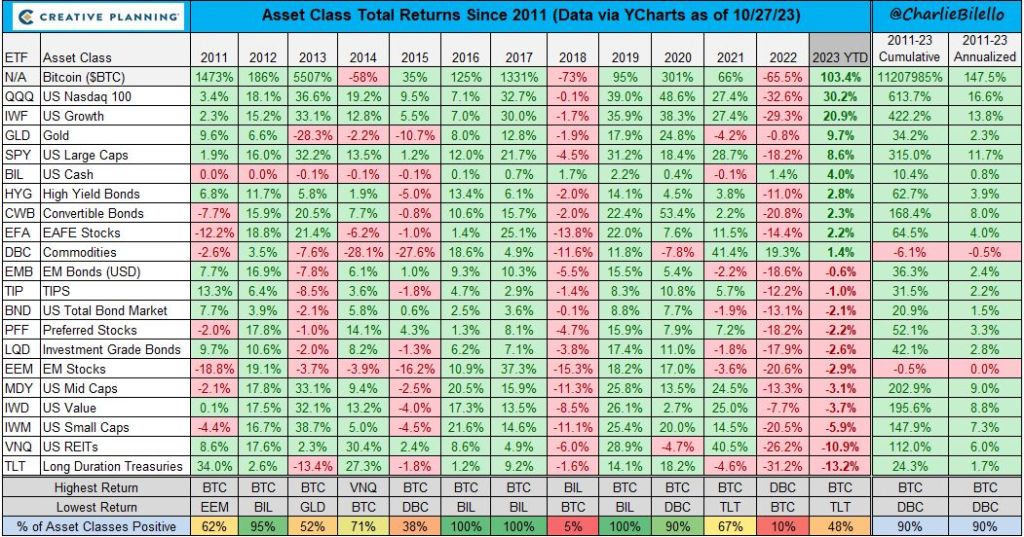
2022 was a bad year for investments under Bidenomics. 2023 year to date is showing huge gains for Bitcoin, the NASDAQ and gold. Bringing up the rear are long duration Treasuries and REITs (real estate investment trusts), both earning negative returns thus far of less than -10%.
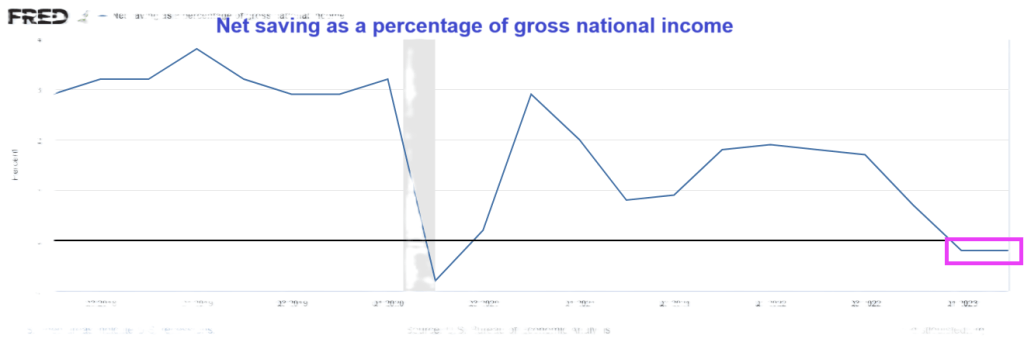
Let’s start with personal savings as a percentage of disposable income. It has been in the red (meaning very low) under Billions Biden.
And The Fed is really in the red under Biden’s inflation rattling spending with losses leading to a surge in remittances.
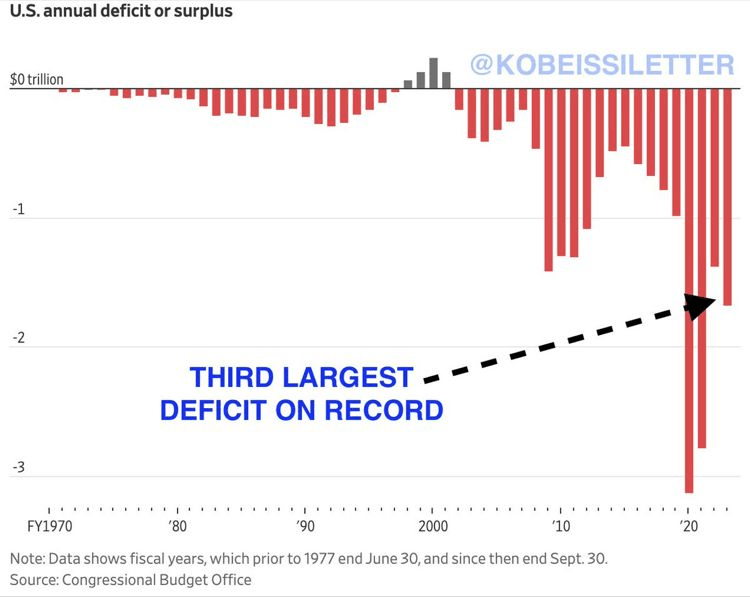
And then we have the growth in the Federal deficit as a % of GDP in the red.
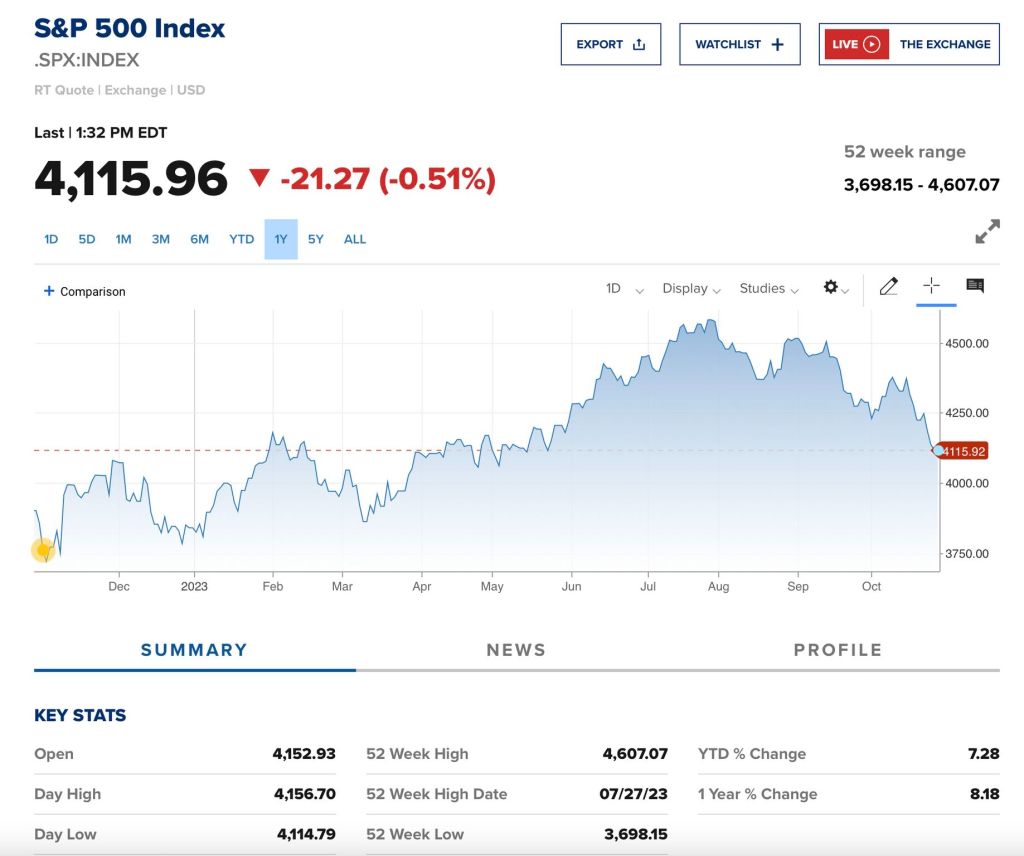
And the S&P 500 is in the red since August.
Even Biden’s pro-censorship buddies in the tech world are in the red since July.
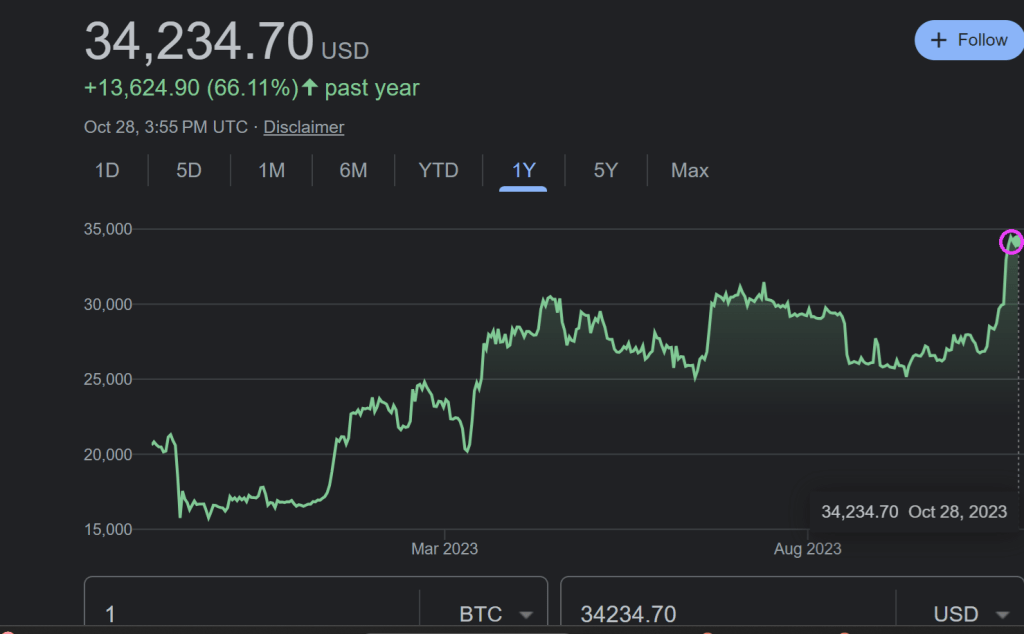
On the black side of the ledge, Bitcoin (along with gold) are through the roof.
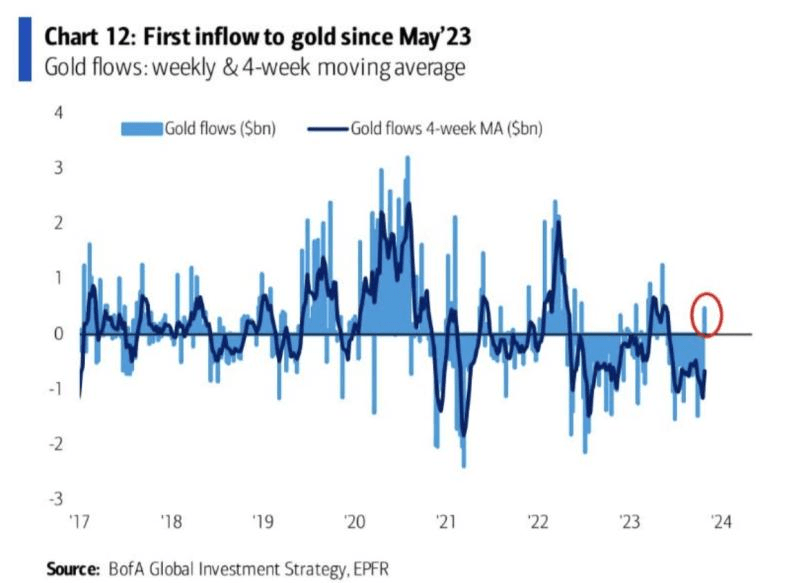
The first inflow to golf since May ’23.
But at least Bidenomics has helped the donor class get wealthier and has helped the lessers get part-time jobs.
Yes, Bidenomics is a highway to hell for the 99%. But a stairway to heaven for the donor class and 1%. And the donor class (and defense/banking/tech/drug industries) have Biden under their thumbs.
My foolish US Senator Sherrod “The Mad Marxist” Brown claimed that he hasn’t noticed illegal immigrants.
Of course, Senator Brown could travel with Biden to the border to witness military age men crossing the border under Biden/Mayorkis “:Operation US Chaos.”
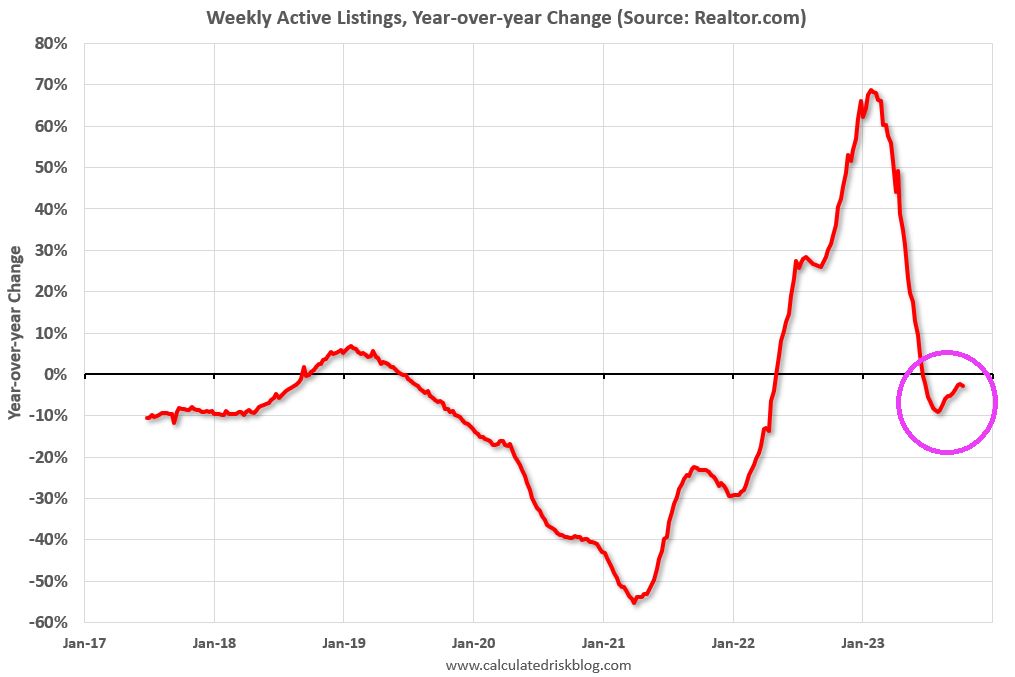
• Active inventory declined, with for-sale homes lagging behind year ago levels by 2.7%. For 17 straight weeks, the number of homes available for sale has registered below that of the previous year.
• New listings–a measure of sellers putting homes up for sale–were down again this week, by 4.4% from one year ago. Since mid-2022, new listings have registered lower than prior year levels, as the mortgage-rate lock-in effect freezes homeowners with low-rate existing mortgages in place. Although the year over year declines are smaller now than the double-digit pace seen earlier in 2023, declines from the pre-pandemic period are still substantial.
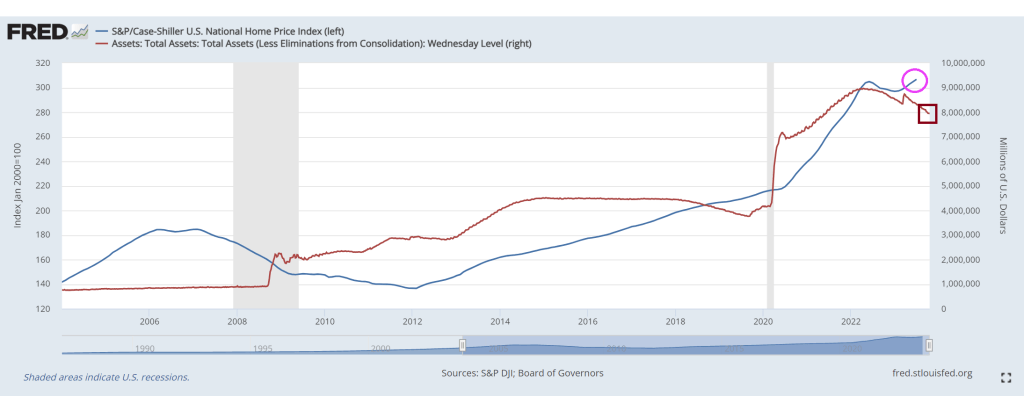
Inventory remains far below levels seen before the financial crisis. But Case-Shiller National Home Price Index (blue) remains elevated along with The Fed’s balance sheet (red) which is barely below $8 TRILLION. And Powell didn’t say much about speeding up the trimming of The Fed ballast.
Bidenomics strikes … again. No, not his inane ramblings about Hamas being “the other team” or that Hamas has to learn to shoot straight. But his policies freezing effects on the economy. Like housing.
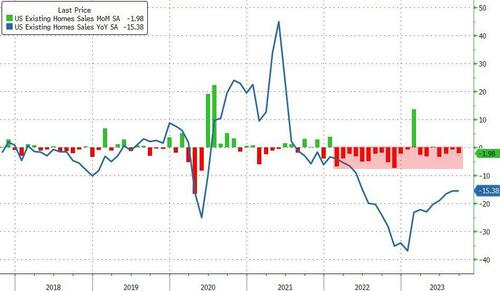
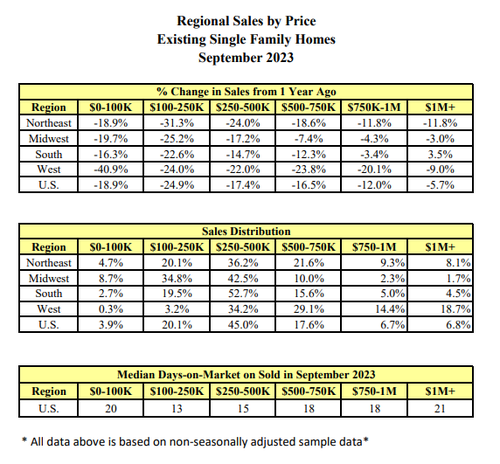
Existing-home sales faded in September, according to the National Association of REALTORS®. Among the four major U.S. regions, sales rose in the Northeast but receded in the Midwest, South and West. All four regions registered year-over-year sales declines.
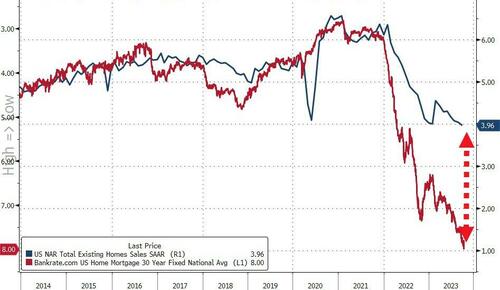
Total existing-home sales – completed transactions that include single-family homes, townhomes, condominiums and co-ops – waned 2.0% from August to a seasonally adjusted annual rate of 3.96 million in September. Year-over-year, sales dropped 15.4% (down from 4.68 million in September 2022). … Total housing inventory registered at the end of September was 1.13 million units, up 2.7% from August but down 8.1% from one year ago (1.23 million). Unsold inventory sits at a 3.4-month supply at the current sales pace, up from 3.3 months in August and 3.2 months in September 2022.
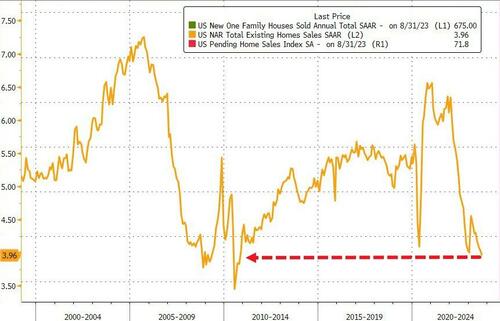
The total existing home sales SAAR dropped back below 4mm for the first time since October 2010 (during the foreclosure crisis)…
Source: Bloomberg
Sales fell in all regions except the Northeast in September… and in every price range…
Single-family home sales fell to an annualized 3.53 million pace, the lowest since 2010. Condominium and co-op sales also declined.
“As has been the case throughout this year, limited inventory and low housing affordability continue to hamper home sales,” said Lawrence Yun, NAR’s chief economist.
“The Federal Reserve simply cannot keep raising interest rates in light of softening inflation and weakening job gains.”
First-time buyers made up a historically low 27% of purchases, down from the prior month.
Cash sales represented 29% of total sales, matching the highest level in over a decade. Investors, who often purchase with cash and are therefore less sensitive to mortgage rates, made up 18% of the market.
“It would be very unusual to have higher cash compared to first time buyers,” Yun said on a call with reporters.
And, if mortgage rates (and thus affordability) are anything to go by, things are about to get real…
Source: Bloomberg
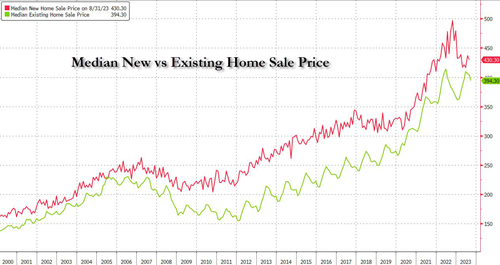
The median selling price rose 2.8% from a year earlier to $394,300, the highest September reading on record, pushing affordability even lower. But existing home prices are falling relative to new home prices (with the ratio near record lows)…
It looks like The House may elect a RINO as Speaker (Patrick McHenry, RINO-NC) to replace McCarthy. One RINO replacing another RINO … all so The House can continue its insane, inflation inducing spending.
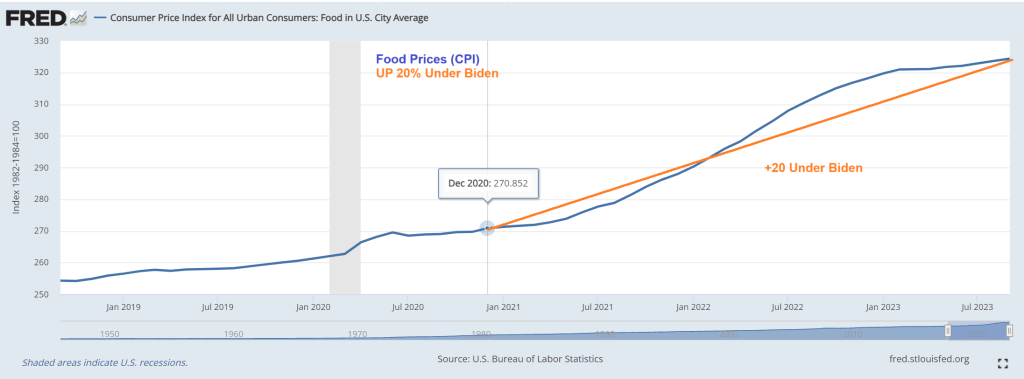
First, food prices are up 20% since December 2020. Talk about destruction of middle class wealth!
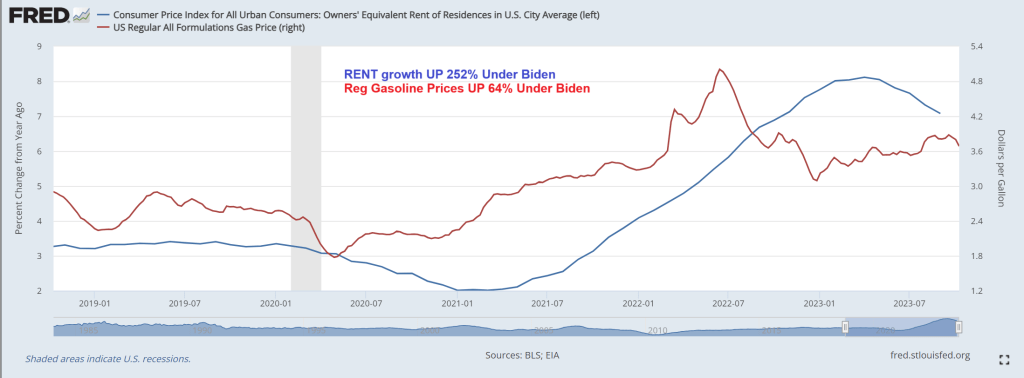
That is in addition to gasoline prices are up 64% under Biden while rent growth is up 252%. Well, Biden waived through millions of illegal immigrants and rent had to rise. Biden and Washington DC’s broken borders is Livin’ La Vida Loco.
To cope with inflation (that Paul Krugman claims is over but the last inflation report showed that the tinders of inflation are hard to extinguish), consumers have turned to credit cards to survive. In fact, credit cards have expanded 38% since April 2021 despite rapidly rising interest rates. And credit card delinquency rates are rising and are now above Covid-era economic shutdown levels.
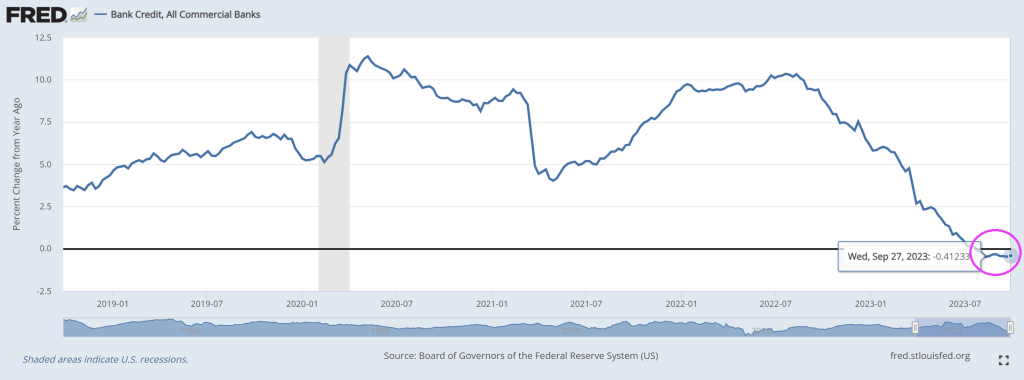
Bidenomics is failing catestropically. Example? As interest rates rise to fight Biden’s Federal spending splurges, bank credit growth slowed to -0.41% YoY for the 10th straight week of negative credit growth.
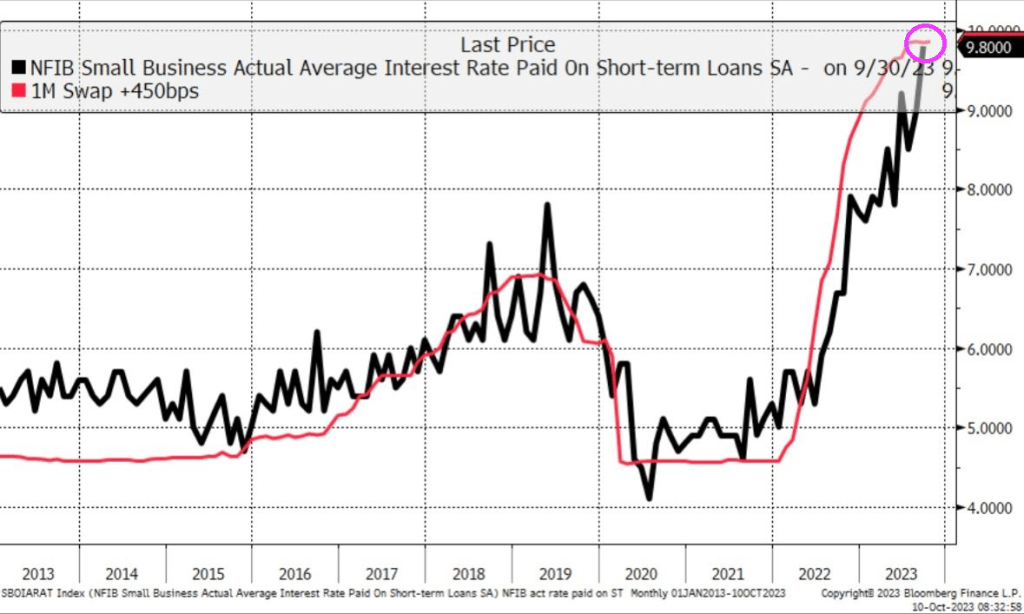
While interest paid on short-term loans almost 10%!!
“Jimmy, watch me tank the economy even worse than you did!”
Like President Biden enjoying a barbeque at The White House with a live band (probably NOT Justin Moore singing “Small Town USA”) while Hamas declared war on Israel and Americans are being held hostage with the promise of public executions of hostages livestreamed. Nothing that “Empathy Joe” does ever surprises me anymore, but I am surprise that various Federal Reserve Presidents will speak today while Hamas terrorizes Israeli and US citizens.
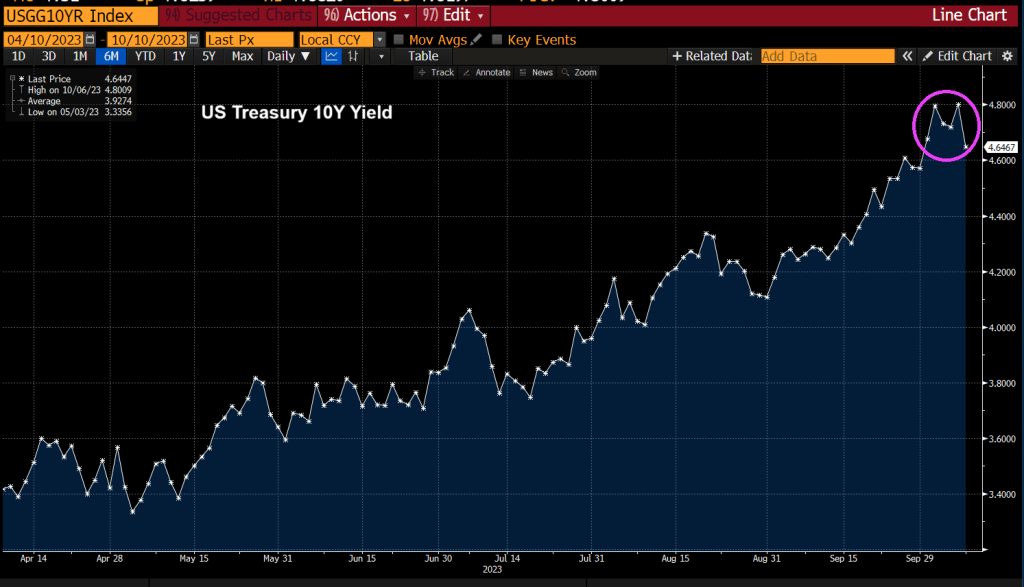
It could be that investors think that Talking Heads at The Fed will claim that Fed rate increases are over. Then again, the Iran/Hamas terror campaign against Israel is spookking markets, driving up oil and gold prices and driving up “flight to safety” in US Treasuries.
President Biden called on Americans in Israel to book a commercial flight home, even though Israel has cancelled all flights. Does Old Joe even read the news??
As Biden sleeps through the Hamas invasion of Israel, that is nothing new. Biden is sleeping through a disastrous downturn in the economy and pretending that Bidenomics is working. It isn’t Joe!
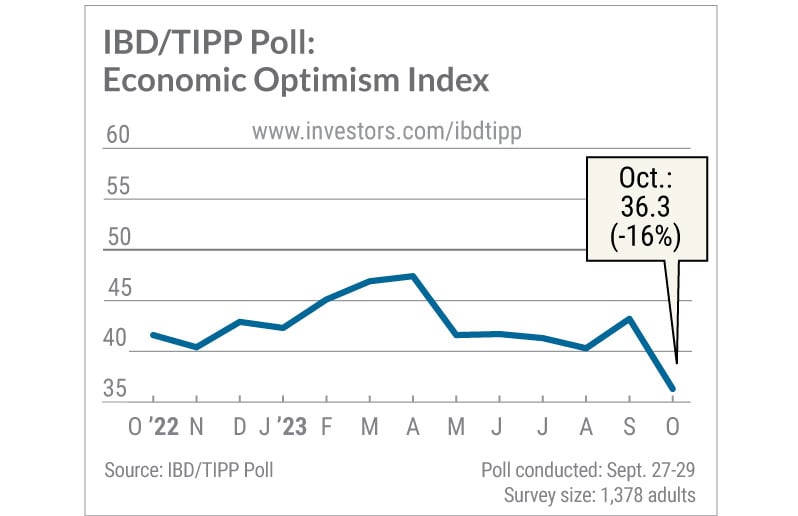
The IBD/TIPP U.S. Economic Optimism Index sank to a 12-year low in October as confidence in the near-term economic outlook crashed to the lowest level in the poll’s history. The survey casts doubt on the Federal Reserve’s justification for turning more hawkish last month: robust consumer spending.
The overall IBD/TIPP U.S. Economic Optimism Index dived 6.9 points to 36.3, the lowest since August 2011. Readings below the neutral 50 level reflect pessimism. The 6-month economic outlook index cratered 9.6 points to 28.7, a record low since the IBD/TIPP Poll began in early 2001.
That means the outlook suddenly appears worse than it was at the depths of the dot-com crash, the great financial crisis and the coronavirus pandemic.
And on the personal savings front, net savings as a percentage of gross national income was negative for the second straight quarter.
Sleepy Joe, wake up! The US economy is slowing down REALLY fast!
The Fed erroneously does not consider rising home prices as inflation. Here’s the result in pictures.
Case-Shiller national and 10-city home prices vs CPI, Rent, and Owners’ Equivalent Rent
Chart Note
Case-Shiller measures repeat sales of the same home over time. This ensures an accurate comparison of room size, yard size, and amenities. The only drawback is the data lags a bit. The most current data is from July representing transactions in May and June.
OER stands for Owners’ Equivalent Rent. It’s the price of rent one would pay to rent one’s own house, unfurnished without utilities.
For 12 years, home prices, OER, Rent, and the overall CPI all rose together. That changed in 2000 with another trendline touch in 2012. Then it was off to the races as the Fed did round after round of QE, suppressing mortgage rates.
Case-Shiller Home Price vs Hourly Earnings, the CPI, and Rent
Case-Shiller national home prices vs CPI, Rent, and Average Hourly Earnings.
As with the previous chart, for 12 years, home prices, rent, the overall CPI and hourly earnings all rose together. That changed in 2000 with another trendline touch in 2012.
How Much Are Homes Overpriced?
If the 12-year trend of home prices rising with average hourly earnings stayed intact, the home price index would be 211, not 308.
From that we can calculate home prices are ((308-211) / 211) percent too high, roughly 46 percent too high. If you prefer, home prices would need to fall ((308-211) / 308), roughly 31 percent.
Alternatively, if home prices stagnate for years, wages may eventually catch up.
Case-Shiller Home Price 1988=$150,000
The same home that cost $150,000 in 1988 now costs $678,366. But wages have gone up too. And mortgage rates have had wild swings.
Mortgage Payment and Wage Adjusted Mortgage Payment
The Least Affordable Mortgages in History
Factoring in wage growth, home prices, and mortgage rates, homes are the most expensive ever.
It’s actually much worse than the chart indicates because property taxes and insurance are not factored into.
Mortgage Rates
Mortgage Rate chart courtesy of Mortgage News Daily.
Through massive and totally unwarranted QE, foolishly hoping to create more inflation, the Fed suppressed interest rates to record lows and mortgage rates followed.
Anyone with an an existing mortgage could and did refinance at 3.00 percent or below.
This increased “affordability” and we now have two classes of people courtesy of the Fed: winners and losers (existing home owners who refinanced low and those who want to buy).
“Mortgage rates continued to move higher last week as markets digested the recent upswing in Treasury yields. Rates for all mortgage products increased, with the 30-year fixed mortgage rate increasing for the fourth consecutive week, up to and above 7.53 percent – the highest rate since 2000,” said Joel Kan, MBA’s Vice President and Deputy Chief Economist. “As a result, mortgage applications ground to a halt, dropping to the lowest level since 1996.The purchase market slowed to the lowest level of activity since 1995, as the rapid rise in rates pushed an increasing number of potential homebuyers out of the market. ARM loan applications picked up over the week and the ARM share increased to 8 percent, as some borrowers searched for ways to lower their payments.”
What About the Winners?
Good question. The winners refinanced at 3.0 percent or below. This put extra money in their pockets every month to spend.
And rising wages further stimulated ability of the winners to buy goods and services.
Thus the Fed is still paying for its asinine push to create inflation.
Meanwhile, the housing market is dead and will remain dead with mortgage rates approaching 8.00 percent.
What About Rent?
CPI data from the BLS, chart by Mish.
That’s another good question. For 24 months or so, economists have been predicting an ease in rent inflations.
The price of gasoline rose 10.6 percent, rent another 0.5 percent, shelter, 0.3 percent, and new cars 0.3 percent leading the way for a 0.6 percent increase in the CPI in August.
The price of rent has gone up at least 0.4 percent for 25 straight months. Not to worry, Paul Krugman says this is lagging.
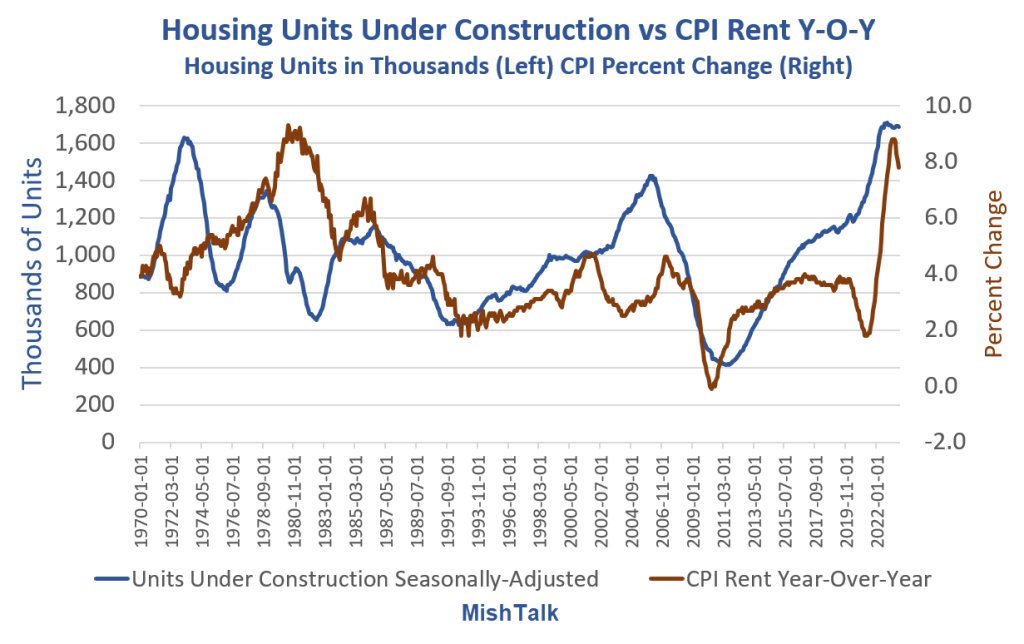
When Will Record Housing Units Under Construction Ease Rent Inflation?
That’s really a trick question. For a better question, remove the lead “when” from the sentence.
The answer is: I don’t know, nor does anyone else, although people claim to be clairvoyant.
Housing Units Under Construction vs CPI Rent Year-Over-Year
Housing units from Census Department, Rent CPI from BLS, chart By Mish
I saw the theory that rent would collapse as soon as housing units get completed so many times that I almost started believing it myself.
However, the data shows no discernable correlation no matter how you shift the lead or lag times.
The chart looks totally random. So perhaps rent abate. Perhaps not. The data itself provides no reason to believe anything.
Regardless, please note the floor. Year-over-year rent has a floor of about 2 percent except in the Great Recession housing crash.
And these charts are not imputed Owner’s Equivalent Rent prices for which people pay no actual rent. These charts reflect rent of primary residence.
34 Percent are Screwed
Well, don’t worry. Only 34 percent of the nation rents, and besides, rent is lagging.
Sarcasm aside, the Fed blew huge asset bubbles and did not see that as inflation. Nor did the Fed see that three massive rounds of fiscal stimulus would cause inflation.
Real Income and Spending Billions of Chained Dollars
Note the three rounds of massive fiscal stimulus in the Covid pandemic. This triggered the most inflation since the 1970s. Economists debate how much “excess savings” still remains.
The Fed never saw this coming, never saw a housing bubble in 2007, and has never once predicted a recession.
Heck, former Fed chair Ben Bernanke denied a housing bubble and denied a severe recession that had already started.
Expect More Inflation Everywhere
Unfortunately, Biden is doing everything humanly possible to stoke inflation with EV mandates, natural gas mandates, union pandering, student debt forgiveness, and regulations, some of which is blatantly unconstitutional.
If you are looking to buy your first home and need to finance, good luck.
The longer the Fed holds rates high, the longer the housing transaction crash lasts. But cutting rates will further expand the housing bubble, asset bubbles in general. And bubbles are destabilizing.
That is the Fed’s tightrope dilemma, of its own making.
If you are one of the winners, congrats. But that extra money the Fed put in your pocket every month may stoke inflation for a long time.


You must be logged in to post a comment.