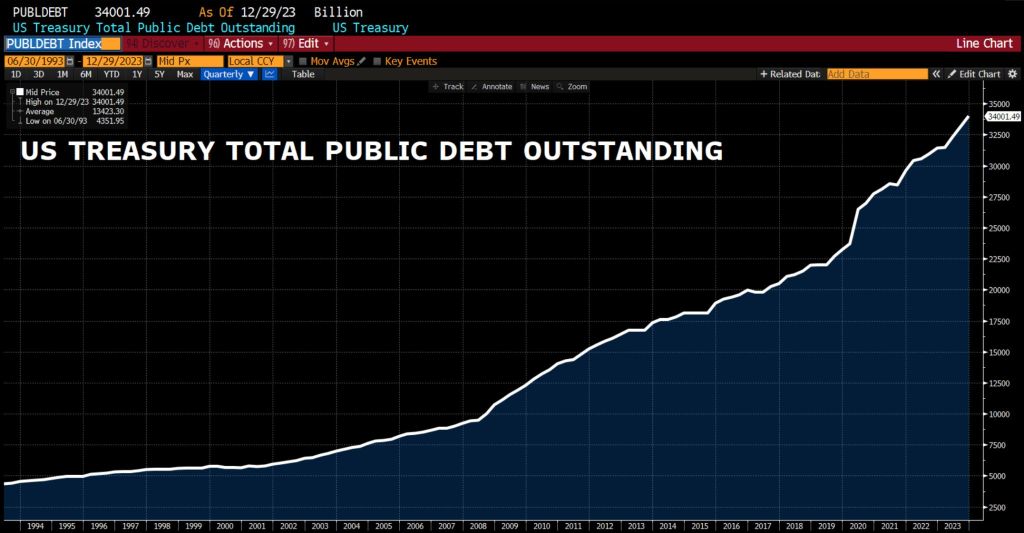
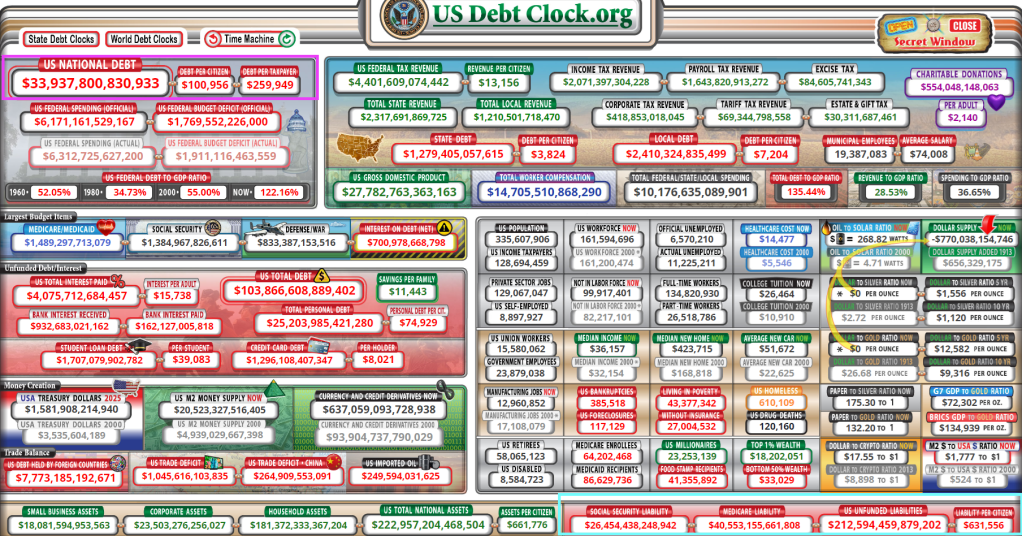
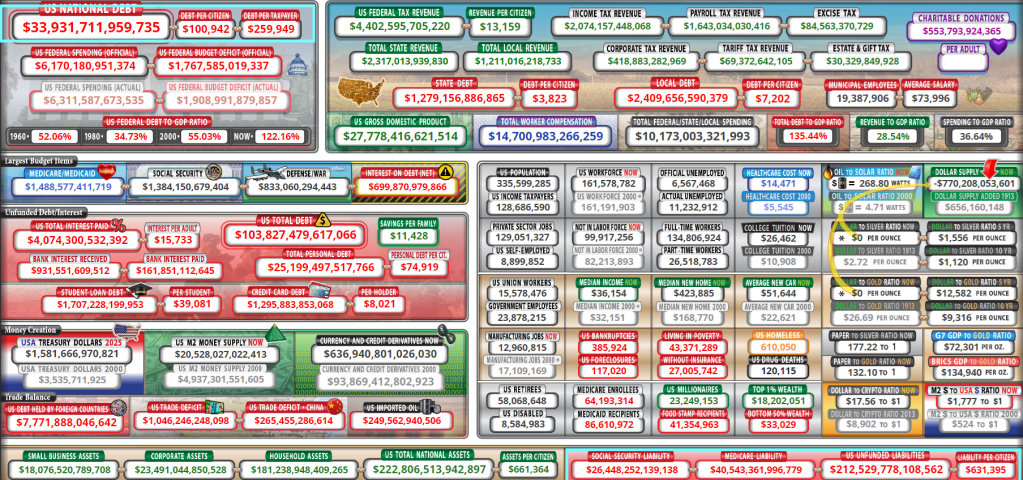
In another episode of “Government Gone Wild” we see that total Federal debt just broke through the $34 trillion mark.
Some context: US debt increased by…
$1 trillion in the past 3 months
$2 trillion in the past 6 months
$4 trillion in the past 2 years
$11 trillion in the past 4 years
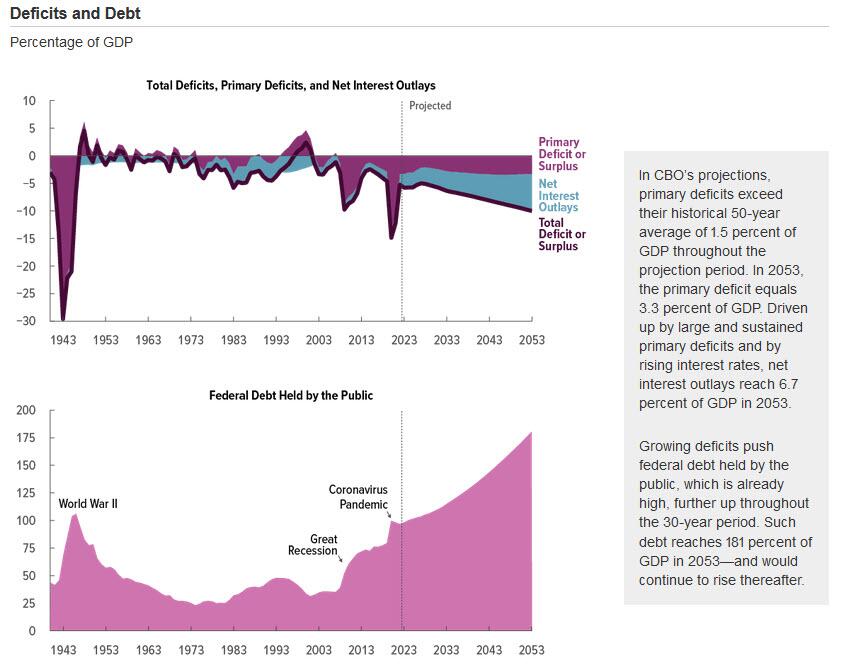
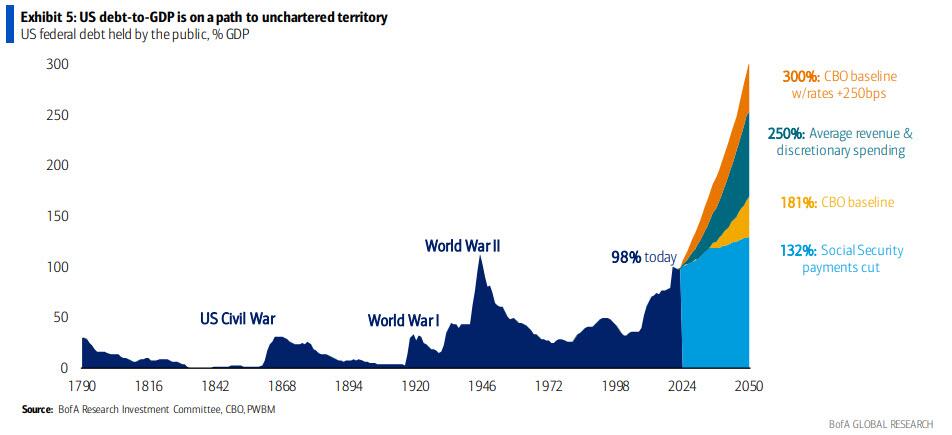
The Congressional Budget Office (CBO) is flashing the alarm.
Reckless spending in Washington DC by the administration and Congress is projected to drive US Debt to GDP to rise like the nuclear reactor in the film K-19: The Widowmaker.
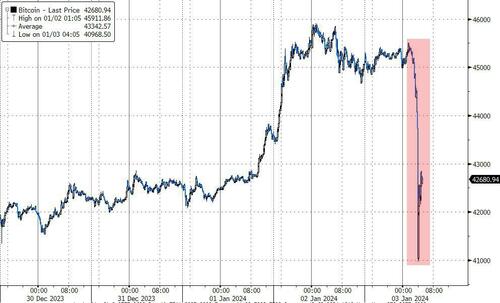
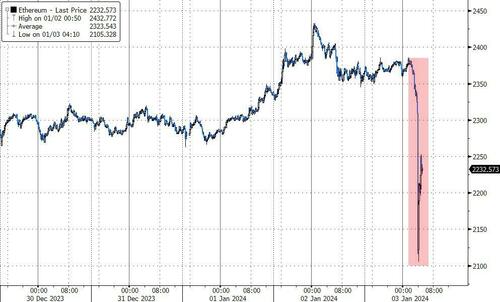
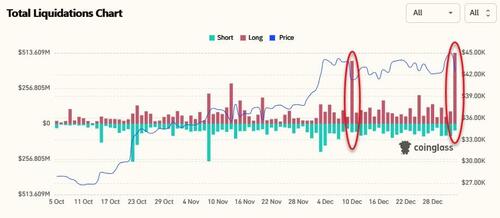
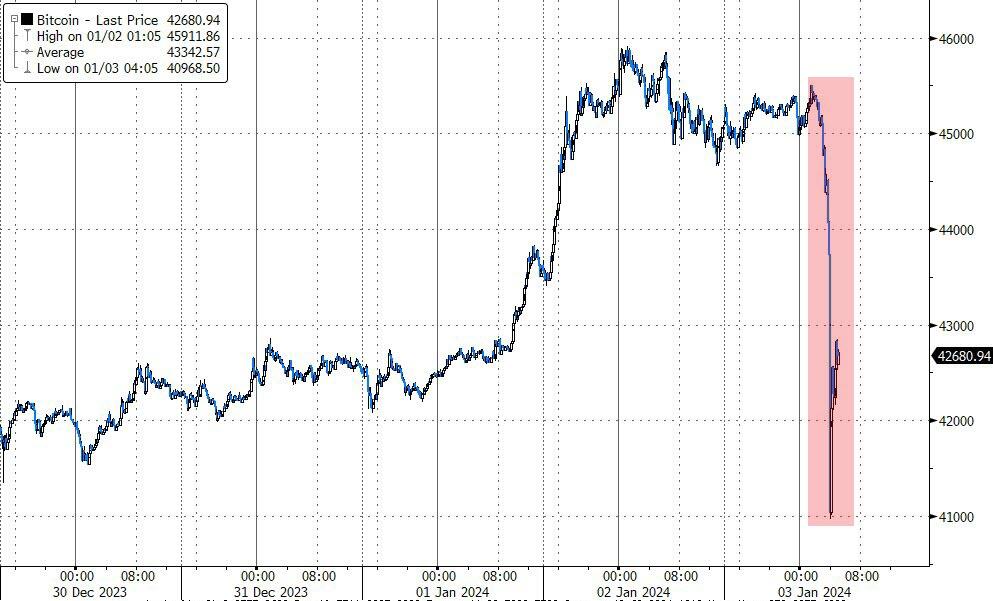
Today the crypto market flash-crashed this morning with Bitcoin instantaneously puking from $45,500 to $41,000…
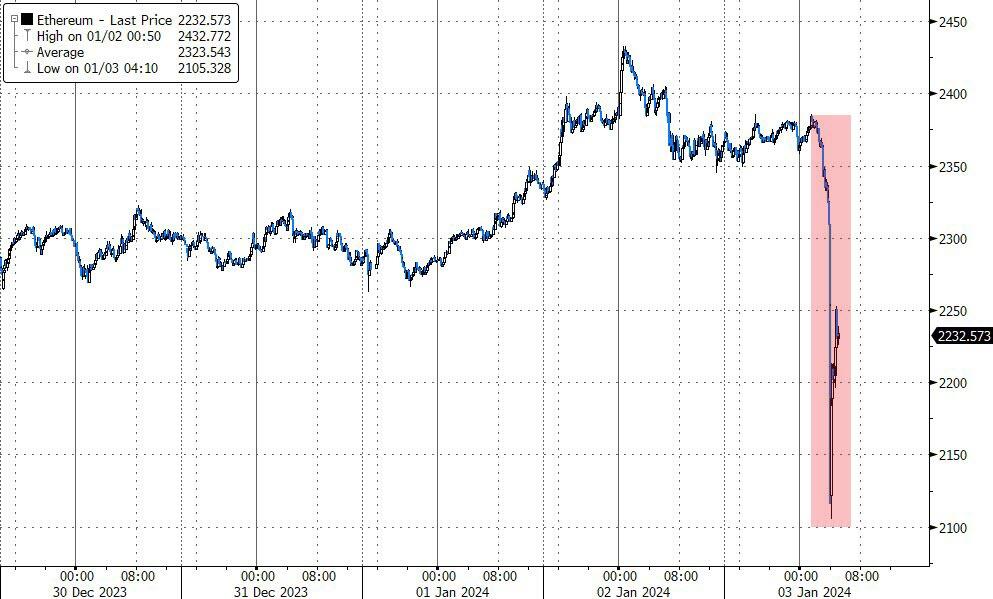
And Ethereum followed suite…
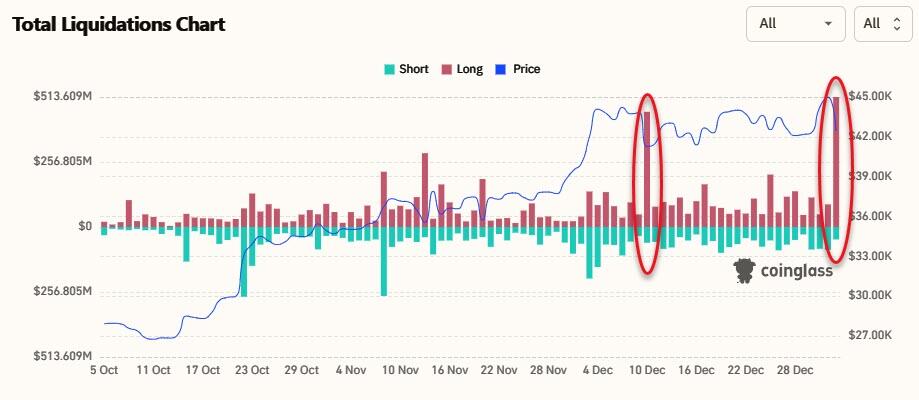
Over $550 million in crypto long positions were liquidated in the past 24 hours, per data from CoinGlass, including $104 million in Bitcoin longs in the past hour alone.
The extremely volatile cryptos are rallying. But still down on the day.
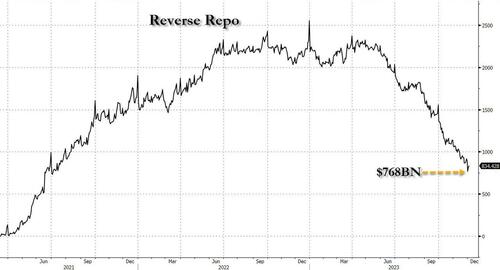
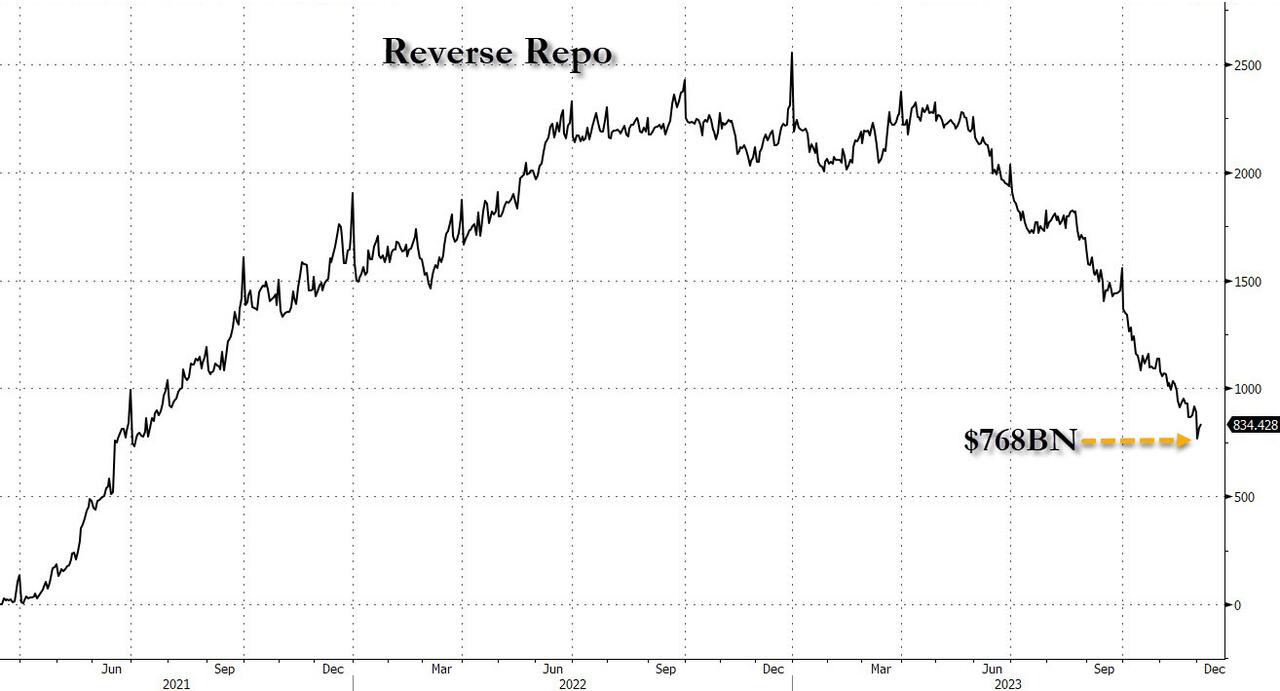
We didn’t have long to wait because just a few days later, on December 1 (just after the customary month-end window dressing period) when reverse repo tumbled to a fresh multi-year low of $765 billion…
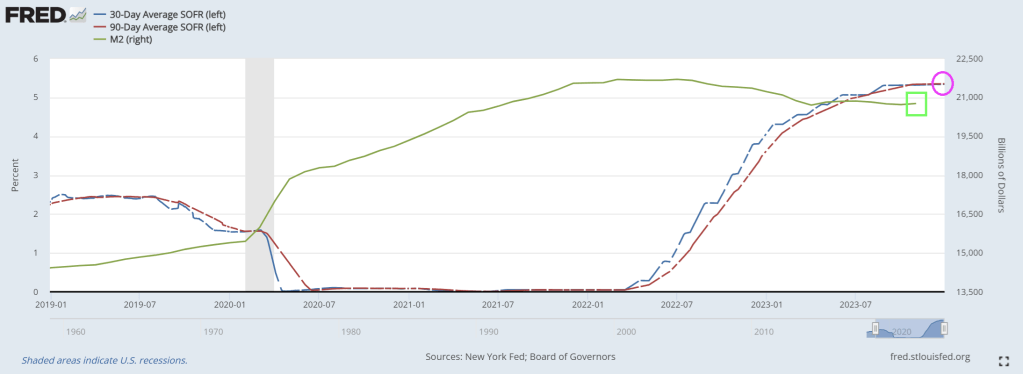
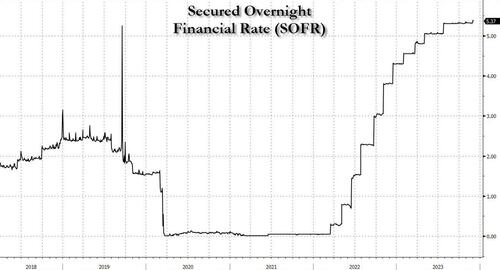
… things indeed broke as we explained in “Sudden Spike In SOFR Hints At Mounting Reserve Shortage, Early Restart Of QE” (in which we correctly previewed the coming Fed pivot at a time when most were still dead certain that Powell would only care about inflation for months to come): that’s when the the all-important SOFR rate (i.e., the new Libor) unexpectedly jumped 6bps to 5.39%, the highest on record…
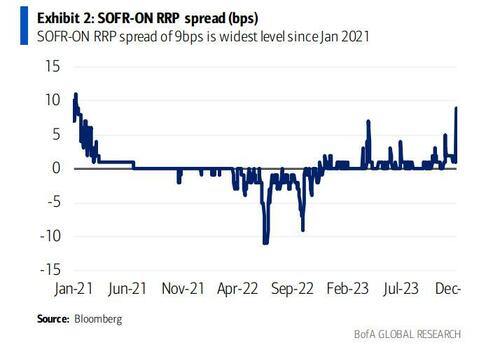
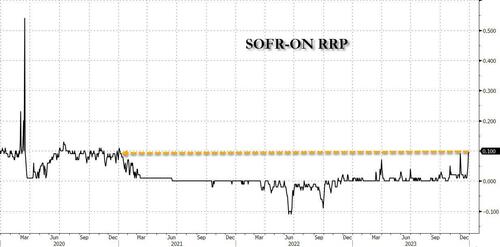
… also resulting in the largest SOFR spike vs ON RRP since Jan ’21, which hit 6bps.
The spike caught almost everyone by surprise, even such Fed-watching luminaries as BofA’s Marc Cabana because it was with “no new UST settlements, lower repo volumes, and lower sponsored bi-lateral volumes.” More ominously, and confirming our take from three weeks ago, Cabana warned at the time (full note here) that “the move is consistent with the slow theme of less cash & more collateral in the system” – i.e., growing reserve scarcity – and “may have been exacerbated by elevated dealer inventories, bi-lateral borrowing need, and limited excess cash to backstop repo. If funding pressure persists, it risks Fed re-assessment of ample banking system reserves & potential early end to QT.”
Then, the mini liquidity crisis disappeared almost as fast as it emerged, as SOFR rates eased off and the SOFR-Fed Funds spread normalized once GSE cash entered the market as it does every month….
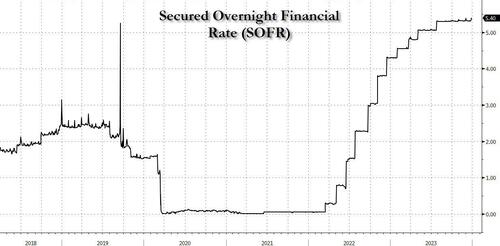
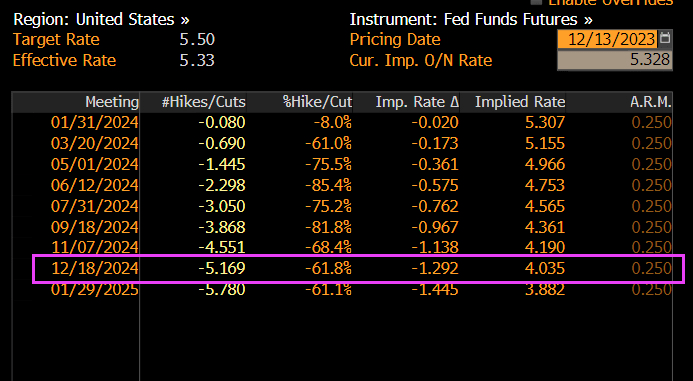
… until today when not only did SOFR hit a new record high, ironically at a time when the market is pricing in more than 6 rate cuts in 2024…
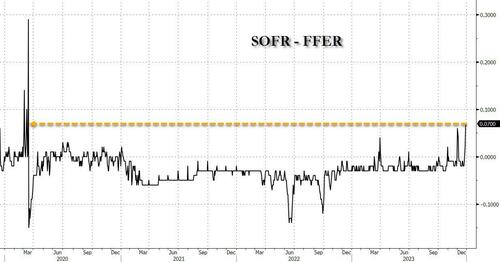
… but the spread between the SOFR and the effective Fed Funds rate just spiked to the highest level since the March 2020 repo crisis…
.. with a similar move also observed in the spread between SOFR rate and the O/N Reverse Repo which similarly blew out to the widest since the start of 2021.
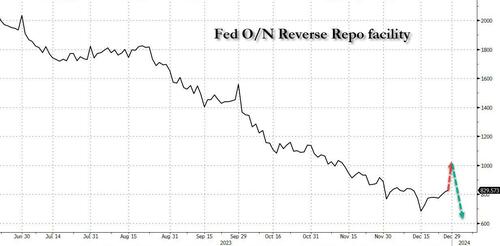
While there was no specific catalyst behind the sudden spike, two factors are the likely culprits: the year-end liquidity crunch, and the recent sharp increase in the Fed’s reverse repo facility, which has increased from a multi-year low of $683 billion on Dec 15 to yesterday’s $830 billion, and which STIR strategists expect will shoot up above $1 trillion in today’s final for 2023 reverse repo operation as a whopping $300+ billion in short-term liquidity in pulled from markets in just days.
That’s the bad news.
The good news is that come 2024 in a few hours, and specifically the first day of trading on Jan 2, we expect the reverse repo facility to plummet back to $700 billion once the year-end window dressing is over (especially with total US debt rising above $34 trillion to start the year), and floods the system with fresh liquidity which will stabilize the monetary plumbing at least until reverse repo dips below that key level of $700 billion at which point we expect the SOFR spikes to become a daily occurrence, and one which the Fed will no longer be able to ignore.
Indeed, one can already see traces of this in the repo market, where the rate on overnight GC repo first surged to 5.625% at the open on the final trading day of December before dropping to 5.45%, according to ICAP. It has since climbed back to 5.50%. But that’s still lower than where repo rates for Dec. 29 were trading during the prior session, as markets now start frontrunning the coming reverse repo liquidity flood.
Of course, once reverse repo eventually tumbles to $0 some time in March, all bets are off and the narrative shift to the next QE will begin.
“Say, can I sniff you if you take Trump off of Maine’s Presidential ballot??”
C’mon Joe. The media has always reported bad news. Warm and fuzzy doesn’t anger people, but bad news does! And under Bidenomics, there has been a lot of bad news.
President Biden railed against corporate media before he and several family members headed by helicopter to Camp David, the presidential retreat in the mountains of western Maryland.
Before boarding the presidential helicopter, Biden was asked by one reporter: “What’s your outlook on the economy next year?”
The president responded: “All good,” adding, “Take a look. Start reporting it the right way.”
Sounds like Biden watched the Travola/Jackson flick “Basic” where the infamous line was uttered “Tell the story right.”
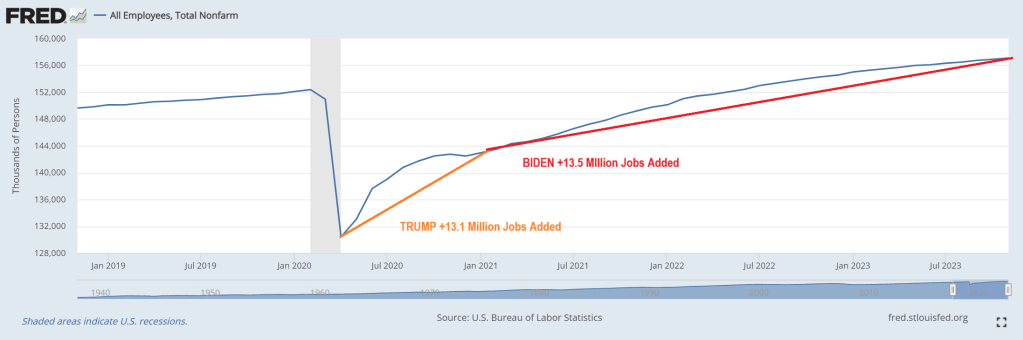
OK Joey, let’s tell the story right. After the horrendous economic shutdowns of local economics and schools in 2020, 15.1 million jobs were added after the shutdowns ended in just 10 months. Wow, that was simple! But under Biden’s Reign of Economic Error, only 15.5 million jobs were added over the next 34 months.
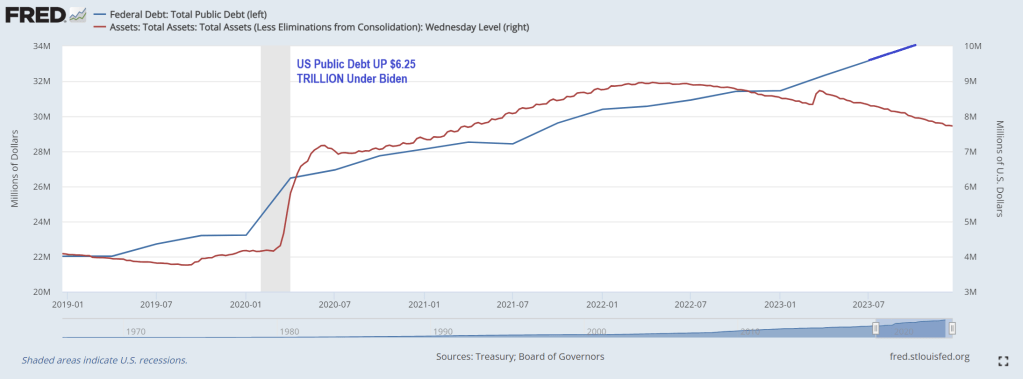
But Biden’s record on jobs comes at the expense of an additional $6.25 TRILLION IN PUBLIC DEBT.
With $34 trillion and rapdily growing debt and budget deficits, it is hard to find good news about Bidenomics.
Biden is lucky in that many portray him as a senile, dumb US Senator who happens to be President. Perhaps Biden is actually insidious allowing for open borders in the hopes of crashing the US economy by overloading the welfare system and driving national debt through the roof?
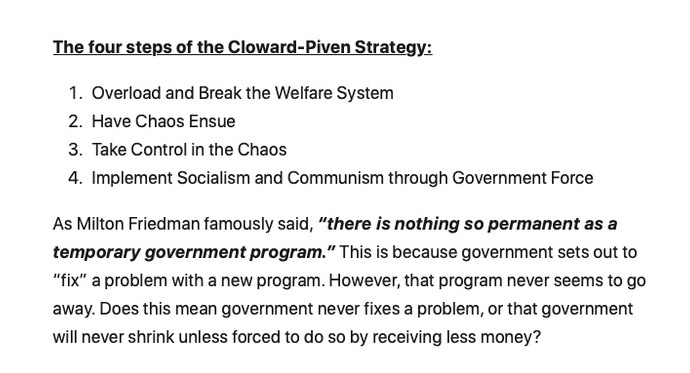
Biden, like Clinton and Obama before him, has been a Cloward-Piven discipile. Who are Cloward and Piven you ask? Two sociologists at Columbia University. (Cloward pass away in 2001, while Piven is still living). Here are Cloward and Piven attending the Voter Registration (aka, Motor Voter Law) Act signing by President “Willie Slick” Clinton.
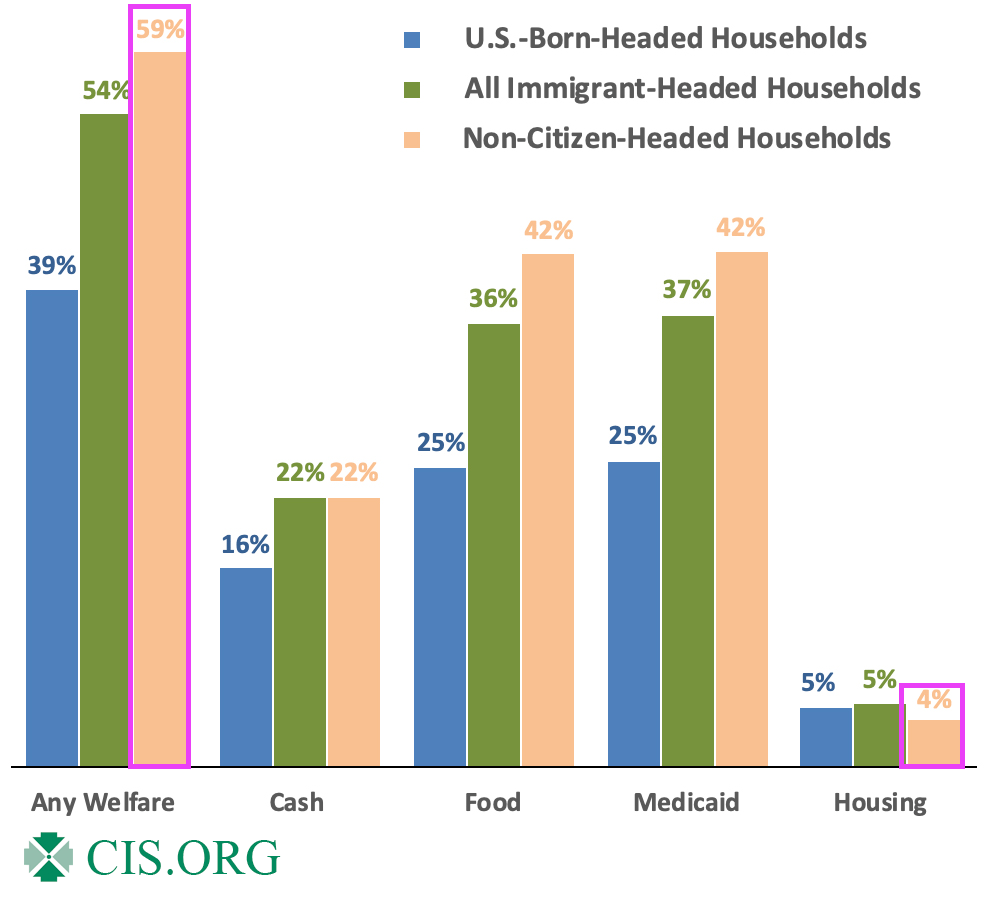
The Cloward-Piven strategy is to overload the welfare system to the point of chaos, take control and implement Marxism through government force. To that extent, Biden and his incoherent sidekick, Kamala Harris, have been wildly successful. Sociology and Political Science are two of the most worthless college degrees (with Management in the Business School being a close third). Taking advice from Sociologists or Political Science majors or faculty is insane.
Biden should be familiar to Latin American, African and Chinese immigrants who are used to Marxist dictators who try to have their political opponents taken of the ballots and prosecucted.
Yes, the US welfare rolls are overflowing with illegal immigrants and unfunded liabilities are out of control. Perhaps Biden and Harris should be replaced with Cloward and Piven (even though Cloward is dead). But Newsom, Hillary Clinton and Michelle Obama share the idiocy of the Columbia sociology faculty members. Hillary even teaches a course at Columbia!
What about compassion for immigrants? Great! Let’s close the borders and return to LEGAL immigration to halt human trafficking, Fentanyl imports, and cartels controlling the border. But Cloward-Piven’s strategy is best accomplished with open borders and weak-willed politicians.
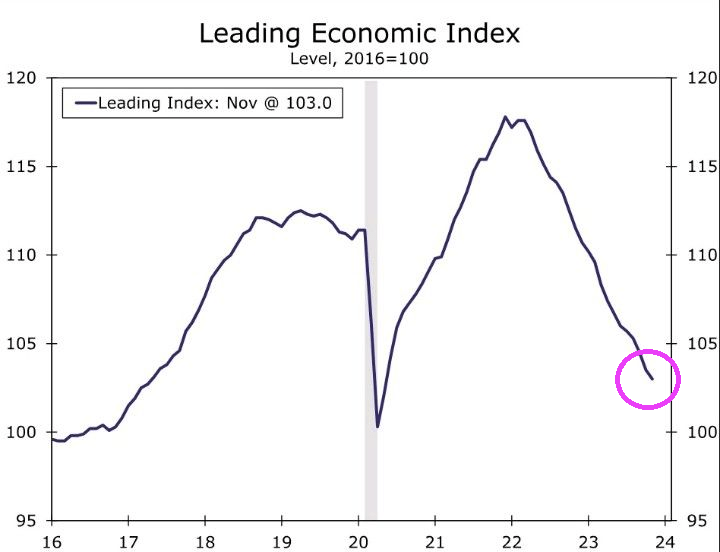
The Conference Board Leading Economic Index® (LEI) for the U.S. declined by 0.5 percent in November 2023 to 103.0 (2016=100), following a (downwardly revised) decline of 1.0 percent in October. The LEI contracted by 3.5 percent over the six-month period between May and November 2023, a smaller decrease than its 4.3 percent contraction over the previous six months (November 2022 to May 2023).
It‘s Biden’s Fiscal Inferno! Insane open borders, insane green spending, wars in Ukraine, Gaza and growing restlessness around Taiwan. Inflation. And a demented 81-year old President in charge.
The deficit is $44 billion higher than it was at the end of November 2022, according to the latest data released by the U.S. Department of the Treasury.
Congress passed a “laddered” continuing resolution in November with a final expiration date of February 2. Conservative House Republicans have been calling for a reduction in federal spending to reduce the budget deficit. Congress must pass another spending bill to keep the government funded past Feb. 2.
The specific cuts the House GOP is considering remains unclear at this time, but any reduction in spending is likely to hit roadblocks in the Democratic-led Senate. Senate Majority Leader Chuck Schumer, D-N.Y., has criticized previous GOP attempts to cut domestic spending levels.
In September, House Republicans were trying to cut annual spending by about $120 billion, which still would not balance the budget. Congressional Democratic leaders were critical of their approach at the time.
Senate congressional leaders are currently debating a foreign assistance package that would provide additional aid to Ukraine and Israel as well as humanitarian assistance for Palestinian refugees along with money for U.S. border security. Senate leaders said on Tuesday that both sides were closer to a deal, but a formal agreement hasn’t been reached yet.
“With regard to the border discussion, I think it’s pretty safe to say that we’ve made some significant progress, but we obviously aren’t there,” McConnell said at the Capitol during his weekly news conference on Tuesday.
On the House side, Republicans have argued that additional aid for Israel and Ukraine should be paid for or “offset” by equivalent spending reductions. Schumer has said that such foreign assistance does not need to be paid for since it is considered emergency spending.
Senators are still in Washington negotiating on the package but the House has left town for the holidays.
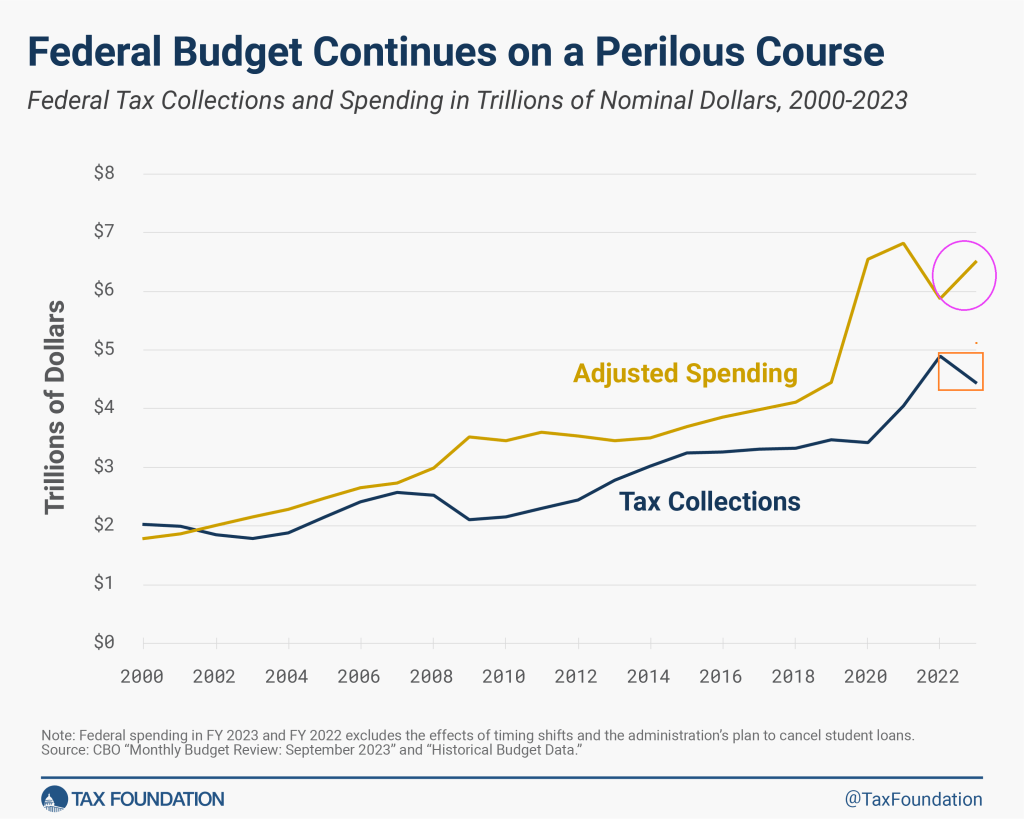
Scott Hodge, president emeritus and senior policy adviser at the Tax Foundation, a nonpartisan tax policy 501(c)(3) nonprofit, said the U.S. Treasury reporting a 13% increase in the deficit compared to November 2022 shows the U.S. government continues to go down the wrong path when it comes to fiscal policy.
“It is being driven by federal spending, which is up by $152 billion, a 17% increase compared to the same month in 2022. The monthly deficit would have been worse if decent economic growth hadn’t boosted federal tax collections by $108 billion, or 19%,” Hodge told Just the News.
“The problem with the federal budget is basic math—the growth in spending continues to outpace the growth in tax collections. This is why our national debit is heading toward $34 trillion. It cannot go on forever without serious economic consequences,” he added.
Maya MacGuineas, president of the Committee for a Responsible Federal Budget, shared a similar perspective on the matter. “The longer we allow our debt to worsen, the less room we ultimately have to respond to the kinds of global emergencies we’re seeing in the world today,” she said.
“This leaves policymakers with a choice: make the hard choices today by paying for our priorities and putting the national debt on a sustainable trajectory, or saddle the next generation with an even worse situation,” she added.
The national debt in January of 2020 was $17.2 trillion, according to historical data from the Peterson Foundation. By contrast, the national debt is currently $33.9 trillion, according to the U.S. Treasury.
And don’t forget that $212.5 TRILLION in unfunded liabilities.
Like the spaghetti western “The Good, The Bad And The Ugly,” Bidenomics has had similar effects on financing. Some good, some bad and a lot of uglies.
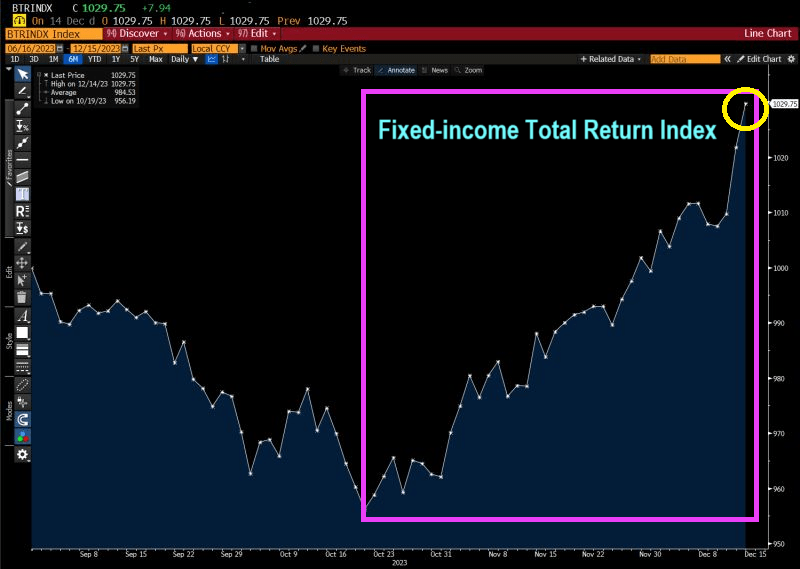
The good! For investors like pension funds the own US Treasuries, inflation has led The Federal Reserve to raise interest rates. This is good for investors holding short-term debt. The Bianco Fixed Income Total Return Index is soaring!!
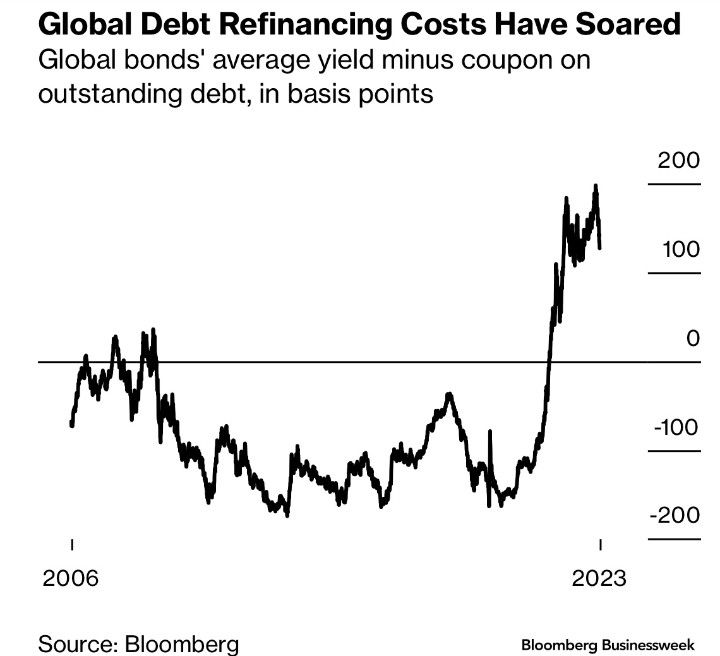
The Bad: Well, the flip-side of the same coin is that debt refinancing costs have soared.
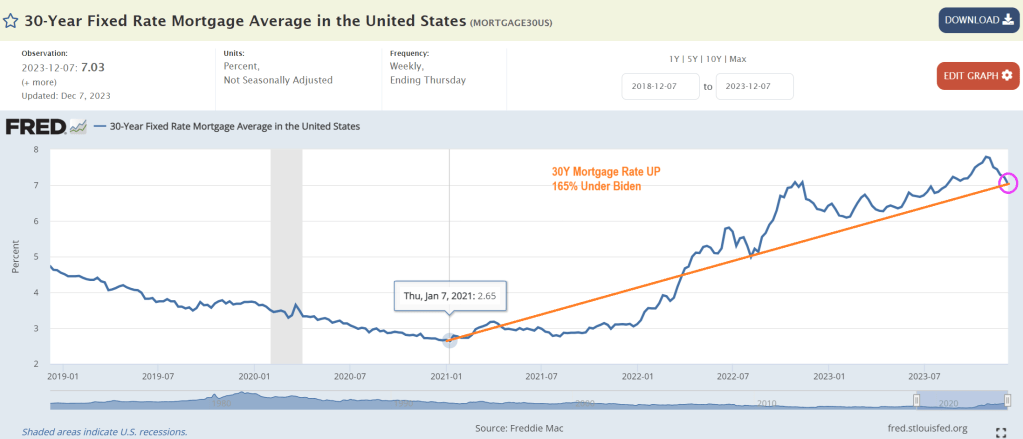
The Ugly. There are many contenders for losers under Bidenomics and current Fed (garbled) policies. But I choose … mortgage demand collapse with rising home prices and rising mortgage rates. Mortgage rates are up 165% under Biden.
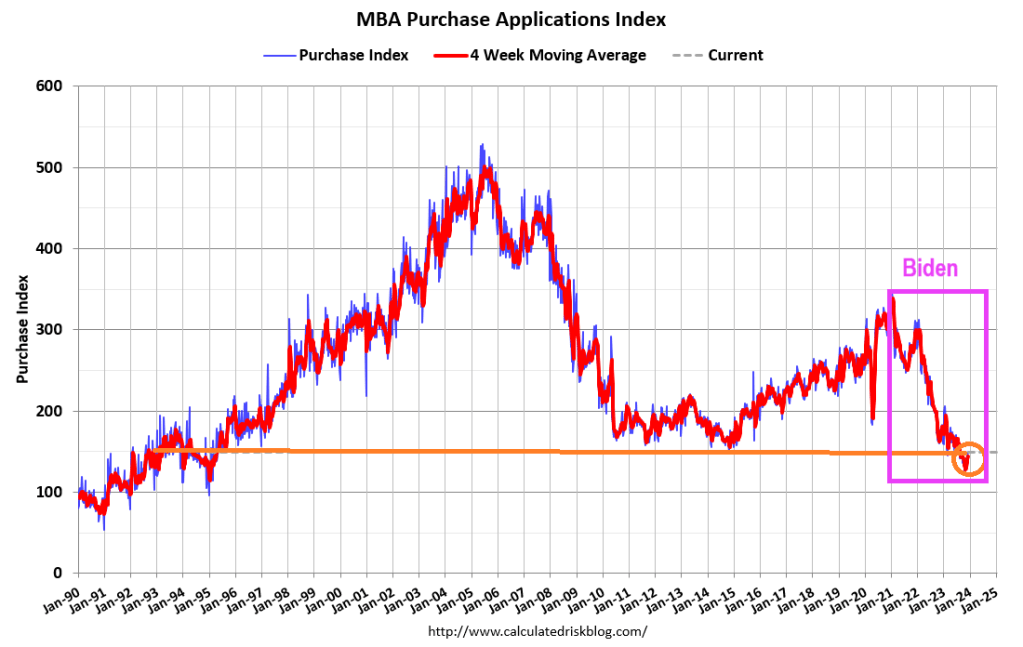
And mortgage demand (applications) have been crushed.
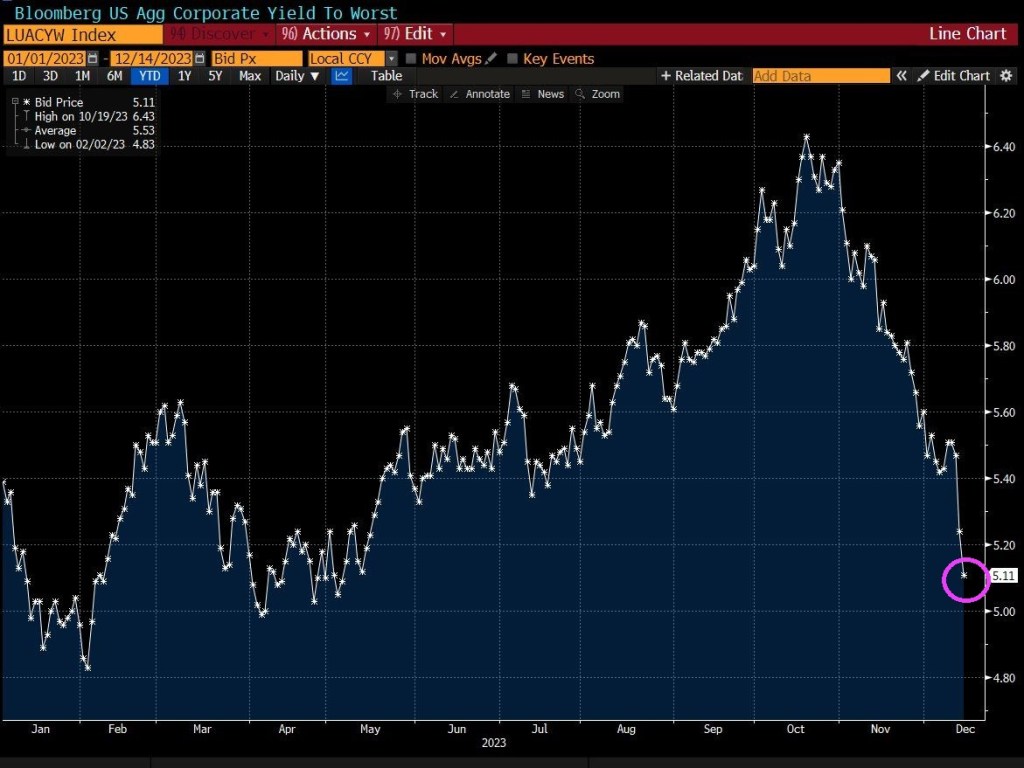
Also on the ugly side, global aggregate corporate yields have collapsed.
So, there have been winners with Bidenomics (the top 1%), and lots of losers.
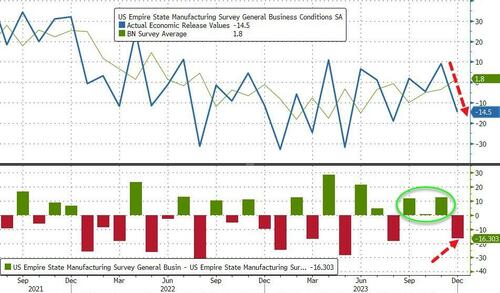
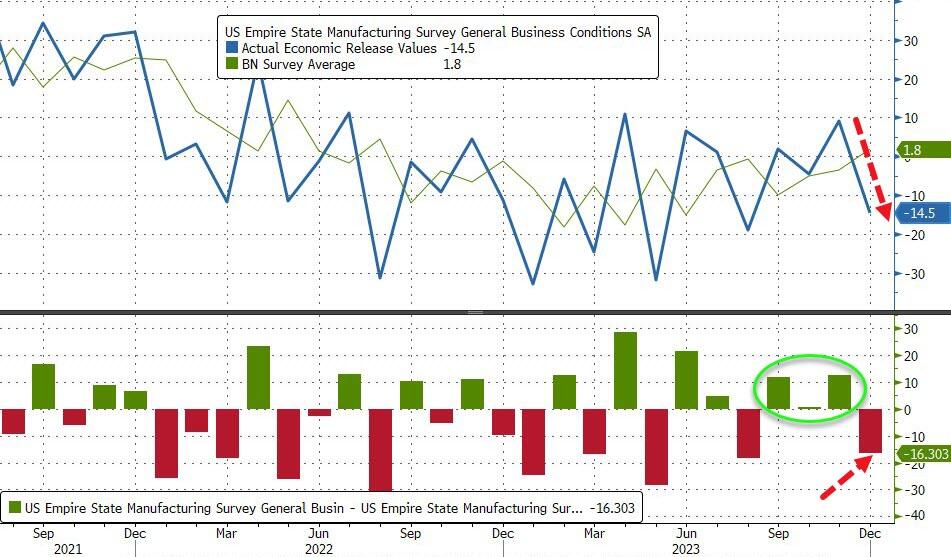
The drop takes the measure from ‘expansion’ at 7-month-highs to ‘contraction’ at 4-month-lows…
Source: Bloomberg
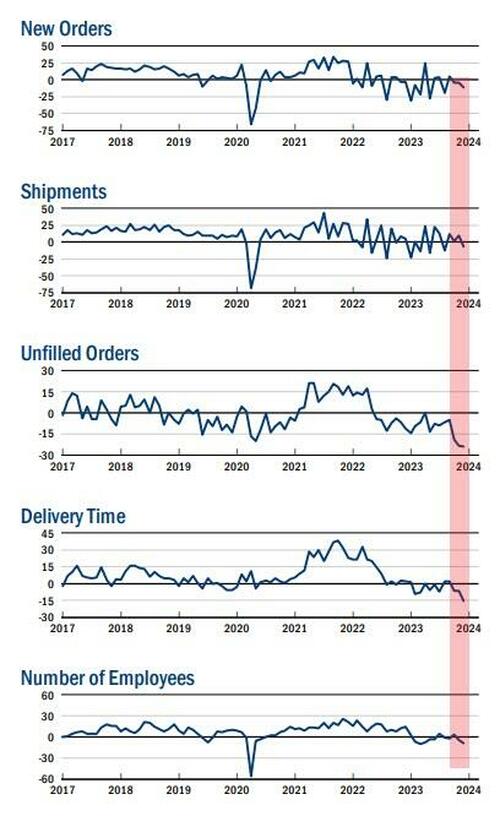
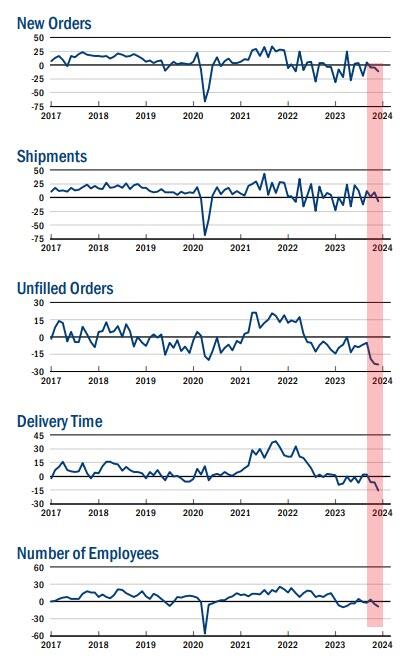
The new orders fell six points to -11.3, pointing to a decline in orders for a third consecutive month, and the shipments index fell sixteen points to -6.4, indicating that shipments fell.
The unfilled orders index held steady at -24.0, a sign that unfilled orders continued to fall significantly.
After rising into positive territory last month, the inventories index retreated fourteen points to -5.2, suggesting that inventories moved lower.
The delivery times index dropped ten points to -15.6, its lowest reading in several years, a sign that delivery times shortened.
The index for number of employees fell four points to -8.4, its lowest level in several months, pointing to a modest decline in employment levels.
On the bright side, the prices paid index moved down six points to 16.7, suggesting an ongoing moderation in input price increases, while the prices received index held steady at 11.5, a sign that selling price increases remained modest.
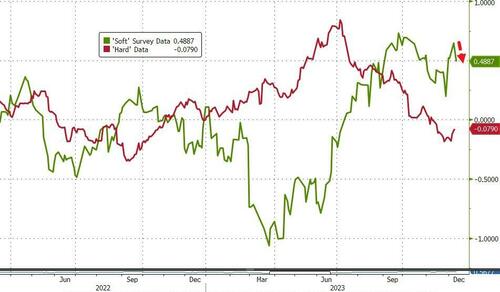
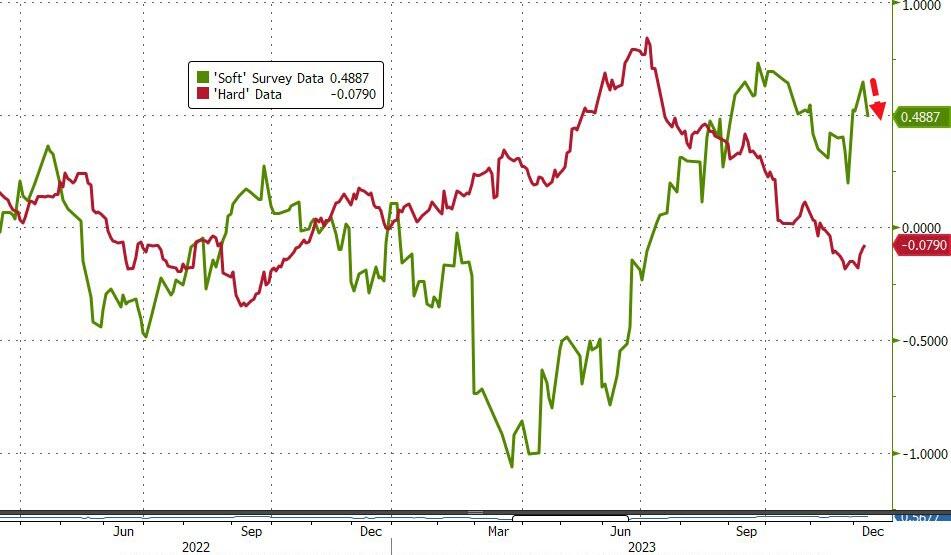
Is this the start of ‘soft’ data’s reversion to ‘hard’ reality?
The Fed – with its six rate-cuts – better hope so.
Traders and investors must spend precious time deciphering them. For those who wouldn’t mind a break from this parlor game, there are some markets that don’t march to the beat of the global policy cycle, and offer diversification benefits for portfolios.
The game was in full flow at Wednesday’s Federal Reserve meeting, as the central bank patiently unpicked the higher-for-longer stitching it had spent many months carefully inculcating in the market.
Anyone who had listened to it on financial conditions, keeping rates restrictive for an extended period, or who thought Powell meant it when he implied he was a Paul Volcker and not an Arthur Burns, is now left trying to figure out if the Fed’s reaction function has indeed changed.
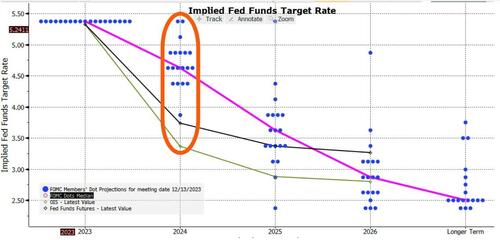
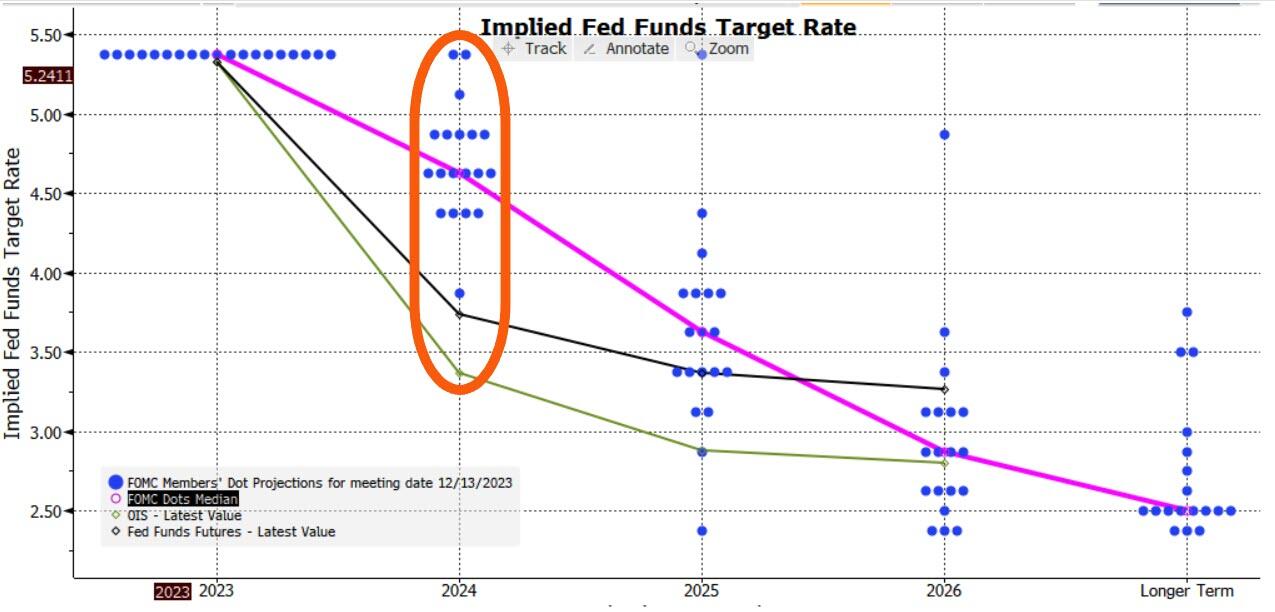
Adding confusion to the game are the dots. They reinforced the dovish message, with the median dot implying three cuts next year versus two back in September.
But with one dot implying six cuts, two implying none and the rest all spread in between, this isn’t exactly sure-footed clarity.
It’ll be repeated again today with the ECB, BOE, the SNB and the Norges Bank all meeting to set rates (the SNB held rates steady and the Norges unexpectedly hiked). For those who can trade only G7 markets, there is not much choice but to play the game.
However, for those looking for markets less reliant on the Delphic utterances of central bankers, there are other options.
The problem is that most bond markets tend to be quite alike over the medium-to-longer term.
Interest rate cycles are typically quite synchronized (with the US the most influential), and capital can flow freely around most of the world.
To show the broad uniformity of bond markets we use a statistical tool called principal component analysis.
PCA is a way of making sense of large data sets. For instance, a retailer may have reams of data on how users use its website: how long they spend on it, which pages they visit, where they hover their mouse, etc. PCA will tell you which input – or combination of inputs – has the greatest explanatory power in determining the total time users spend on the website (something they would want to maximize).
Using PCA on yields from 40 countries, we can show that over half of global bond market moves are described by just one factor.
This not a trivial result. It means we could replace our data on 40 bond markets by this one component and it would capture more than half of the variance of the individual yields.
A bond market that was similar to this component would therefore be a good proxy for the global bond market. However, as the mathematician Carl Jacobi advised, we should always invert. A more interesting question is: which bond markets look least like this factor?
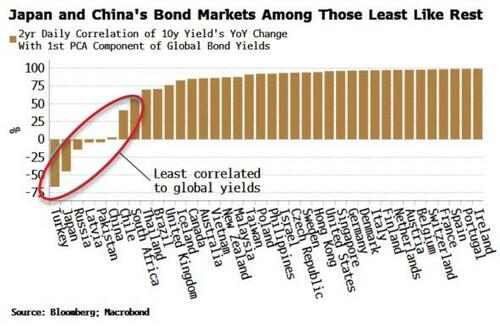
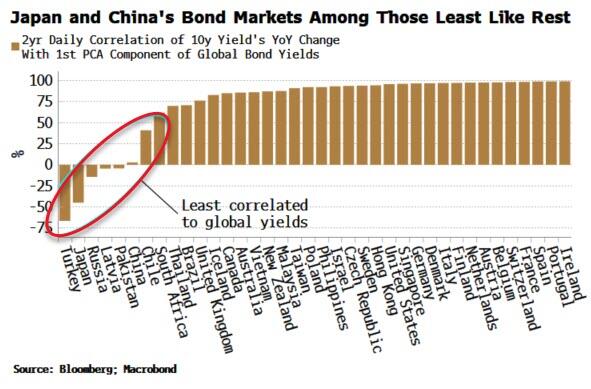
The chart below shows how each of the 40 bond markets are correlated to the first PCA factor. Most have a high correlation – more than 75% – but what stands out is the handful of markets with a low or negative correlation.
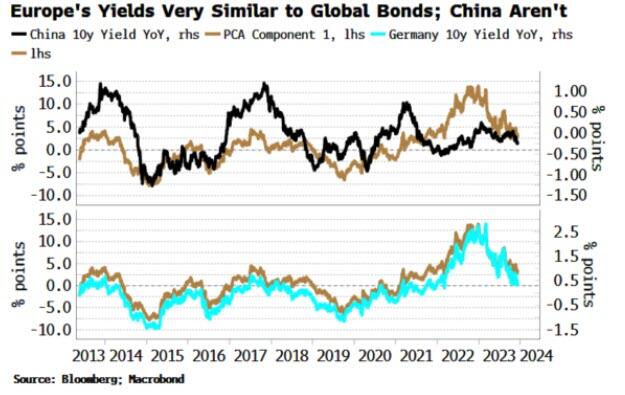
Japan and Turkey are among those with a negative correlation, while China’s correlation is close to zero.
This is intuitive.
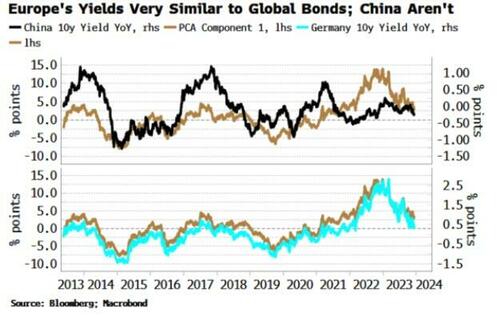
Japan has been running a deliberately counter-cyclical monetary policy, while Turkey until recently was running a through-the-looking-glass one, cutting rates in the face of rampant inflation. And China’s economy is in deflation, at odds with every other major DM and EM country.
The above analysis provides analytical backing for the intuition that Japan et al have provided diversification for global bond portfolios in recent years, while most other markets, e.g. Europe, the US, Australia, New Zealand, etc are low-resolution facsimiles of each other and therefore have delivered few diversification benefits.
Of course, there will be other things to consider before adding a country’s bond index to a portfolio, such as how overbought or oversold it is, how liquid it is, the expected stance of the central bank, and so on.
But if the correlations persist, such a market should produce a more resilient and lower-volatility bond portfolio.
We can extend this analysis to look at stocks.
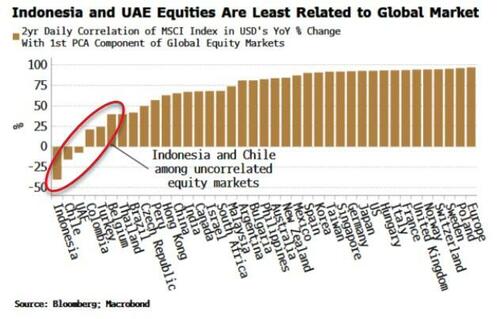
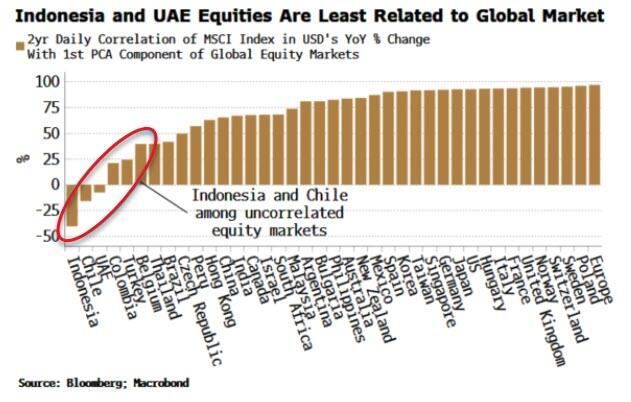
Global equity markets are even more similar to one another than bond markets, with the first component explaining 60% of the total move. Nonetheless, applying PCA offers up some portfolio diversification candidates (using as our data set MSCI country indices in USD).
Indeed, it can be shown that the first PCA component of equity markets is highly correlated to the US’s manufacturing ISM, elegantly demonstrating that in large part global stocks are driven by macro.
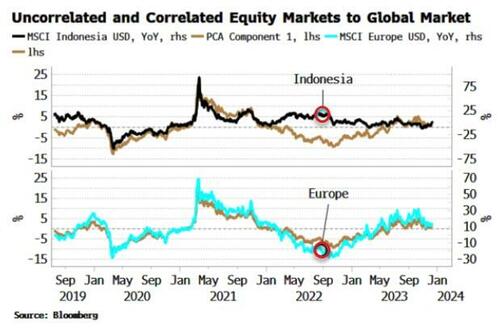
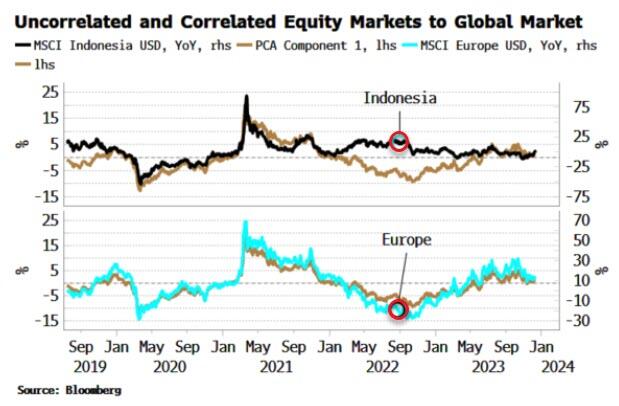
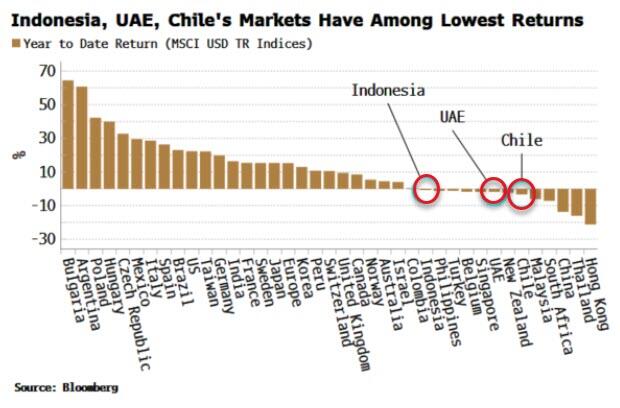
Indonesia, UAE and Chile’s stock markets are all negatively correlated to the global equity move, and therefore the global macro cycle, while European markets move almost in lockstep with it. As the chart below shows, Indonesia’s market (white line) remained supported in late 2022/23, as its market bottomed in July 2022 and rallied through, while other markets went on to make a new low in October of that year.
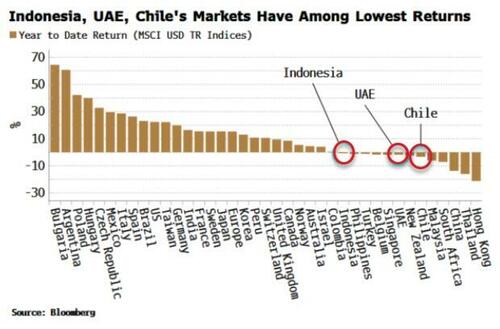
Indonesia et al also have had among the lowest returns of all global equity markets this year. It is relatively common for the markets that are among the worst performers one year to be the among the top the following year.
We can complete the analysis by looking at commodities.
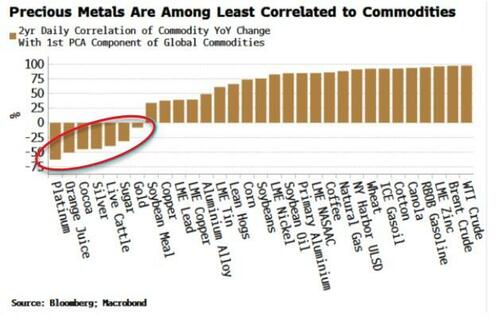
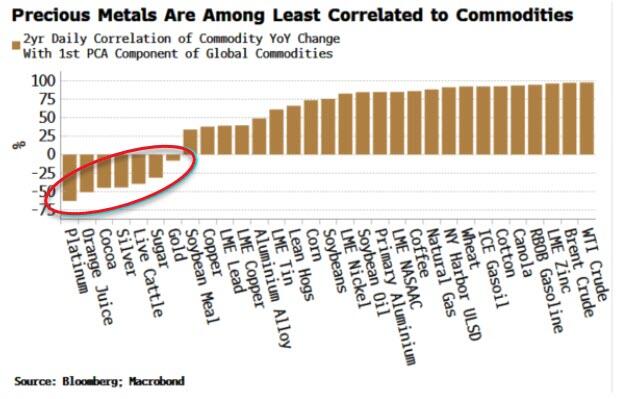
The first PCA component here explains about half the move of all commodities, a similar proportion to global bond markets. PCA shows that precious metals, such as gold, silver and platinum are the most negatively correlated to commodities.
As almost all commodities are traded in dollars, the first component is quite similar to the DXY.
So to some extent we are asking which commodities are most negatively correlated to the dollar. Precious metals typically exhibit a more negative dollar correlation than most other commodities. Further, in the current environment they should offer some protection against inflation.
The lack of variation among macro-driven markets makes portfolio investment challenging as it is easier to add risk rather than uncorrelated factors.
The above PCA analysis shows that Japanese bonds, Indonesian equities and platinum are examples of assets that may confer some diversification advantages for global portfolios.
At the very least, you may not have to pay as much attention to central bankers.















You must be logged in to post a comment.