Home Listings Surge in Turnabout for Supply-Starved US Market (Are Homeowners Seeing An End To Home Price Growth With Fed Rate Increases??)

The Federal Reserve under Berananke, Yellen and Powell kept monetary stimulus out there too long and rates too low, but Powell is now trying to reverse that trend to fight inflation. But how will that impact the housing market?

(Bloomberg – Prashant Gopal) The housing slowdown is helping to solve one of the US real estate market’s most intractable problems: tight inventory.

With fewer buyers competing, the number of active US listings jumped 18.7% in June from a year earlier, the largest annual increase in data going back to 2017, Realtor.com said in a report Thursday. And new sellers entered the market at an even faster rate than before the pandemic housing rally began.

The Federal Reserve is cooling off the red-hot housing market as it fights to curb inflation by driving up interest rates. The resulting spike in mortgage costs is making homes less affordable and pushing would-be buyers to the sidelines. That means properties aren’t selling as quickly and must compete with the growing number of new offerings. 
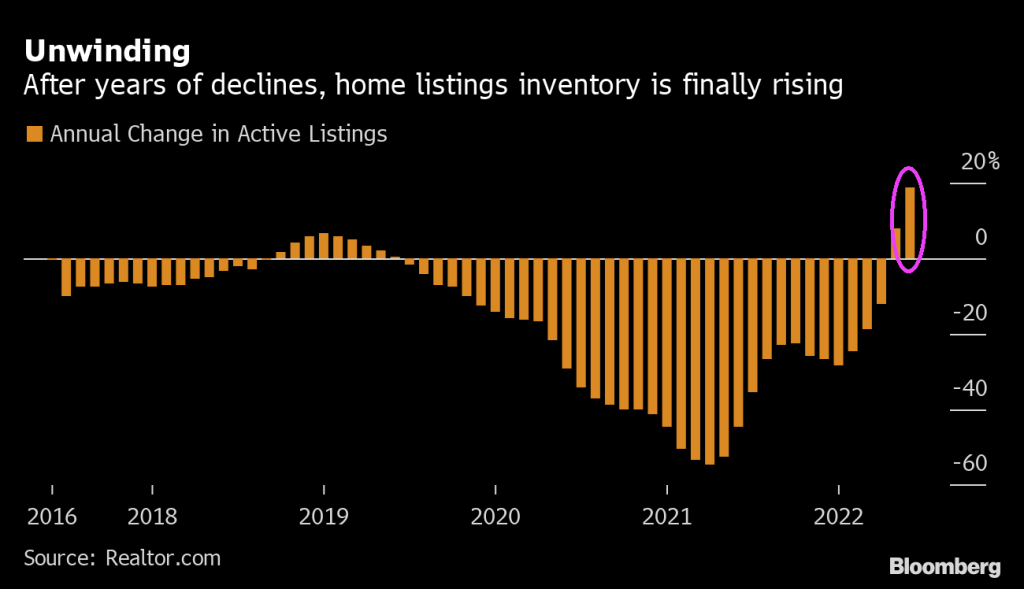
I wonder if it is all the Covid monetary and fiscal stimulus that is finally getting homeowners to put their houses on the market, perhaps fearing the end of the housing price run-up with Fed-induced rate hikes?
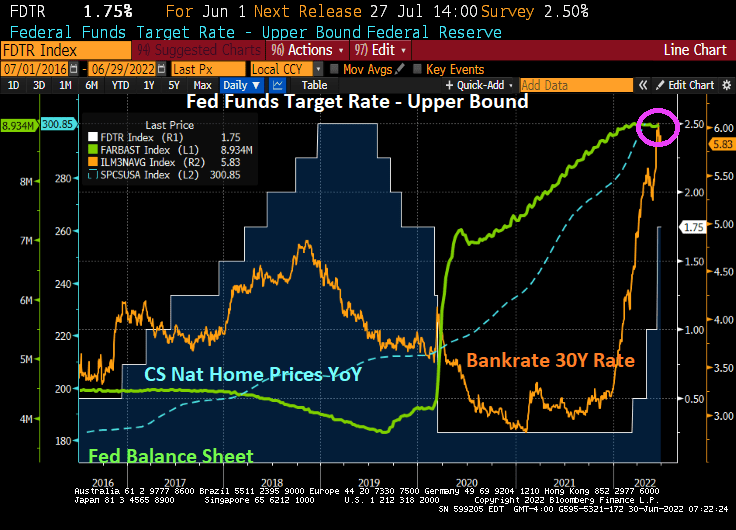
Let’s see if The Fed’s Frolic Room (aka, open market committee) keeps driving rates up and home affordability down. Or is it The End for the house price bubble?

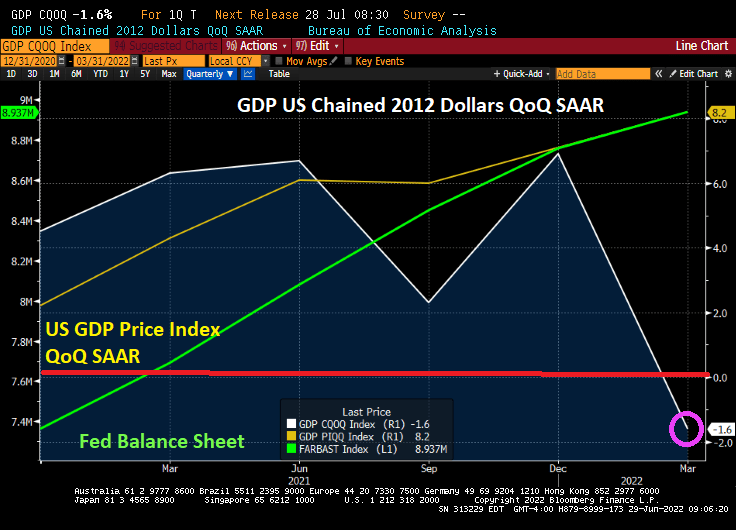
Nothing From Nothing! US Q1 GDP Falls To -1.6% QoQ As GDP Price Index Soars To 8.2% With Massive Fed Stimulus

Nothing from nothing beats the numbers coming out of Washington DC.

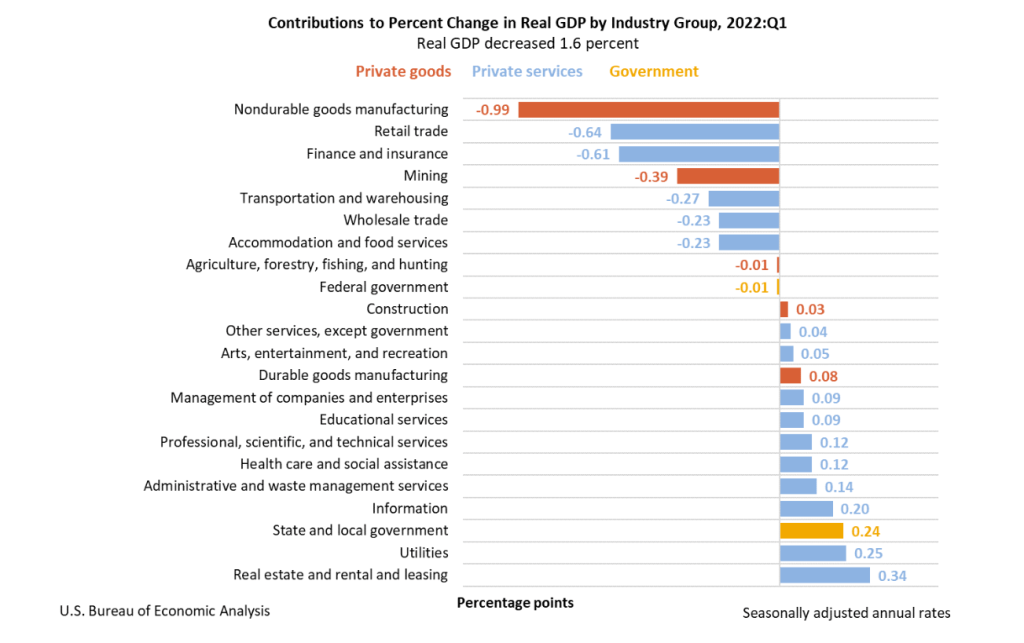
Despite enormous Fed monetary stimulus, Q1 Real GDP fell to -1.6% QoQ while prices rose 8.2%.

And if it weren’t for real estate, it would have been worse.

Personal consumption growth in real terms QoQ declined to 1.8% as Fed money printing slows.

Can the US economy survive without Uncle Spam’s printing press?

The Thrill Is Gone! Richmond Fed Index Plummets To Covid-era Levels (Conference Board’s Consumer Confidence Falls Below 100) As Fed Withdraws Stimulus

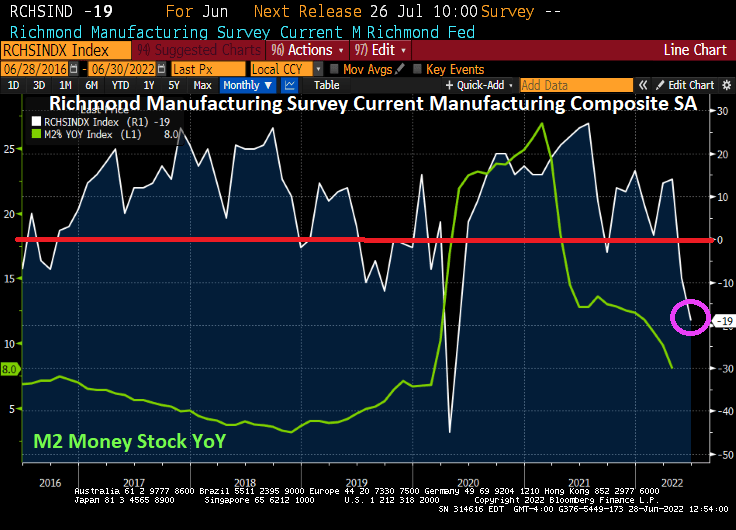
It took a while and trillions in fiscal and monetary stimulus to recover from Covid-era economic lockdowns, but now that the monetary stimulus is being withdrawn, the economy is stalling.

If you look at the chart below, you can see that “The Thrill Is Gone” from monetary and fiscal stimulus.

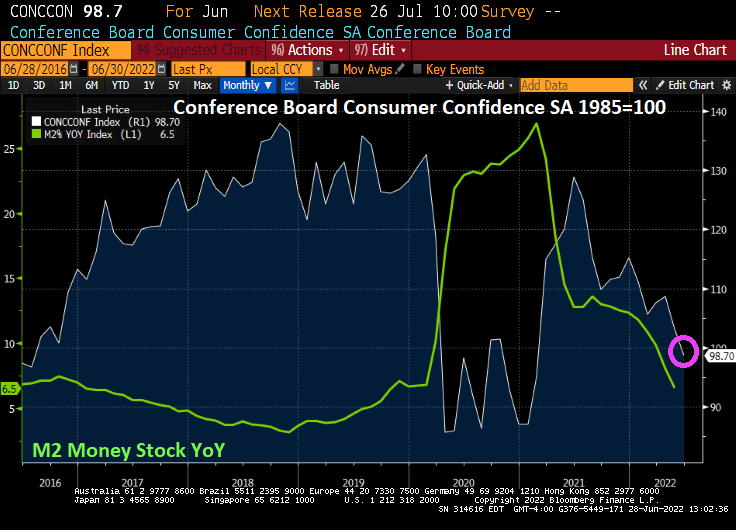
And The Conference Board’s Consumer Confidence Index fell below 100 as M2 Money Stock YoY returns to pre-Covid levels.

You are gonna have to face it, we’re addicted to gov (stimulus).

More On Fed’s Bullard’s “Consumers Healthy” Remark (Consumer Sentiment At Lowest Level Since 1977 While Unemployment Rate At Only 3.6%)

St. Louis Fed President Bullard made a remark the other day that consumers are healthy so a recession is unlikely.

Consumers are healthy? It is true that the US U-3 uemployment rate is low (3.6% versus 14.70% in April 2020 thanks to government shutdowns over Covid). But even though unemployment is low, consumer sentiment is at its lowest point since 1977.

Generally, consumer sentiment is high when unemployment is low, but not this time around. Currently, inflation is at the highest level since March 1980 even though consumer sentiment bottomed-out in April 1980.

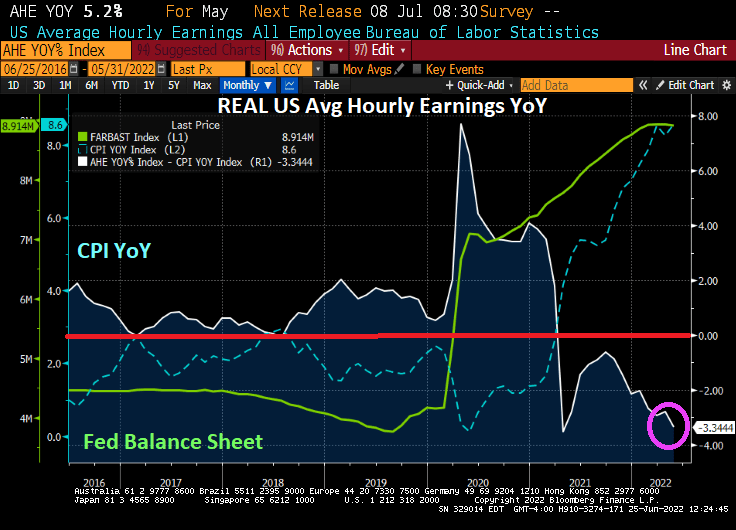
Here is my chart showing that REAL average hourly earnings growth YoY is negative and getting worse, hardly a sign of “healthy consumers.”

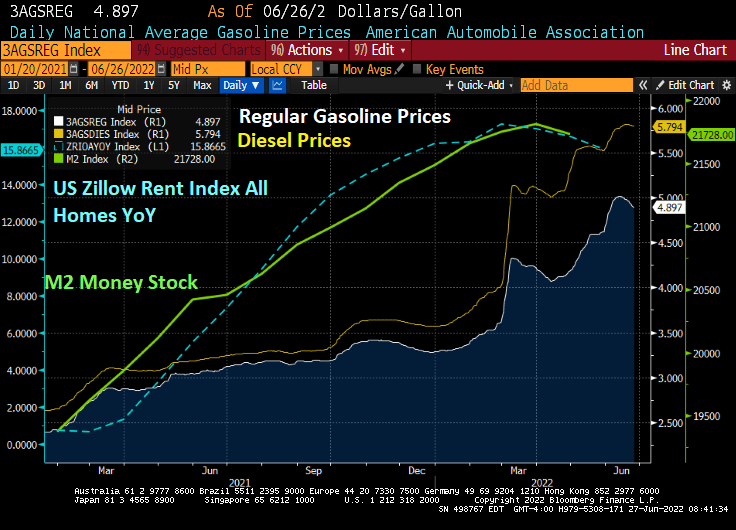
Of course, rising gasoline and diesel prices have risen dramatically since 2021, but are declining slightly thanks to the global economic slowdown (read “lower demand”).

And a M2 Money Stock (green line) declined, US rents (blue line) declined as well.

We are truly living in Birdland. As in bird-brain land.

Sign Of The Times! US Gasoline Prices Decline To $4.94, Diesel Prices Rise To $5.80 As Recession Fears Mount (Reverse Repos At Fed Hit All-time High)

The talk of a gasoline tax “holiday” out of Washington DC is pure Kabuki theater. It is purely a sign of the times with Biden still trying to blame Putin for rising gasoline prices and inflation and ignoring his anti-fossil fuel policies that helped drive energy prices AND inflation through the roof.

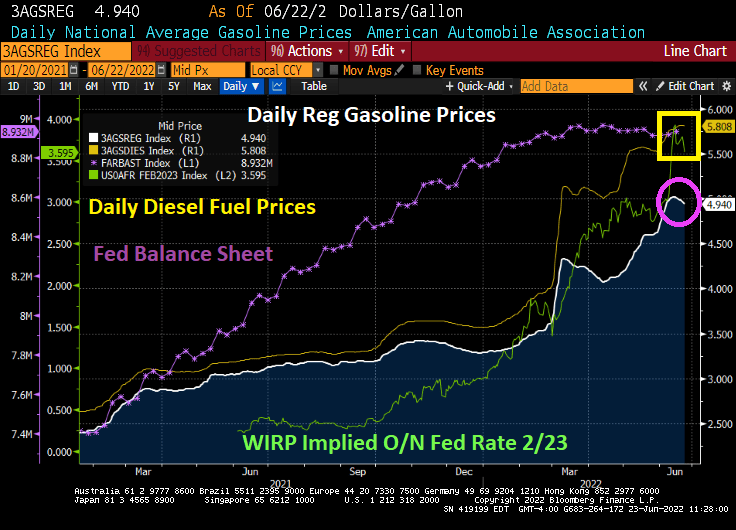
Daily regular gasoline prices have dipped below $5.00 to $4.94 while diesel fuel, the lifeline of the shipping industry, rose slightly to $5.80. I guess the folks shipping food and other goods don’t get a holiday.

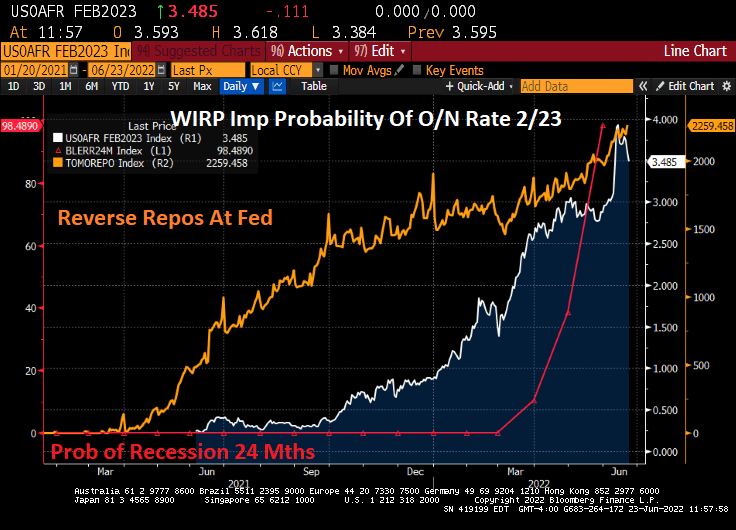
Note that the implied Fed target rate has fallen a bit as the probability of a recession increases.

And why are banks stashing so much money at The Fed in the form of reverse repos? Fear of recession, perhaps?

The Biden Administration is settling all kinds of records, and none are good.

US Real GDP Sinks To -0.002% As Fed Meets To Discuss Monetary Tightening (Declining Purchasing Power Of US Dollar)

While expected, it is still unwelcome news.

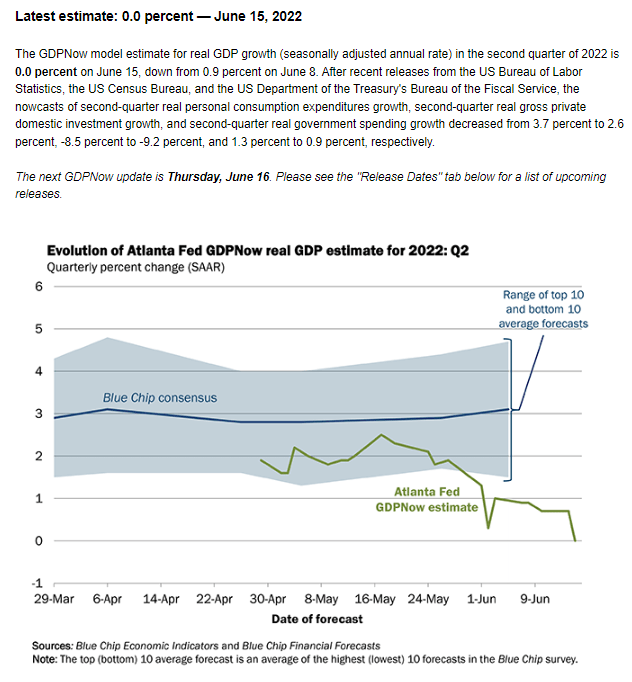
The Atlanta Fed’s GDPNow real-time GDP forecast for Q2 just sank into negative territory at -0.002%.

Let’s see how Real GDP does if The Fed actually withdraws its stimulus needle.

And consumer purchasing power keeps diving as The Fed keeps printing money.

Closing Hell! NASDAQ Tanks -4.58%, 10Y Treasury Yield Spikes +22 Basis Points, 10Y-2Y Yield Curve Flattens To Near Zero (MBS Prices Pull A Titanic)

Not nibbling on baby formula, watching the sun bake, all those people paying $5 per gallon for gas. Wasting away again in Biden/Powellville.

It was closing hell for a terrible day in markets as investors struggle to process the dreadful and seemingly endless inflation report on Friday.

What happened today? The NASDAQ tanked -4.58% and the 10-year Treasury yield jumped 22.2 basis points. Gulp.

The 22.2 bps jump in the 10-year Treasury yield has led to Agency MBS prices pulling a Titanic and sank.

Somehow, I don’t think that Biden and Congress are going to help the middle class and low-wage workers.

Black Monday! 10Y Treasury UP 11 BPS, S&P 500 E-Mini DOWN -2.5% (Mortgage Rate Rises To 5.78%, Bitcoin Keeps Dropping)

Black Monday!

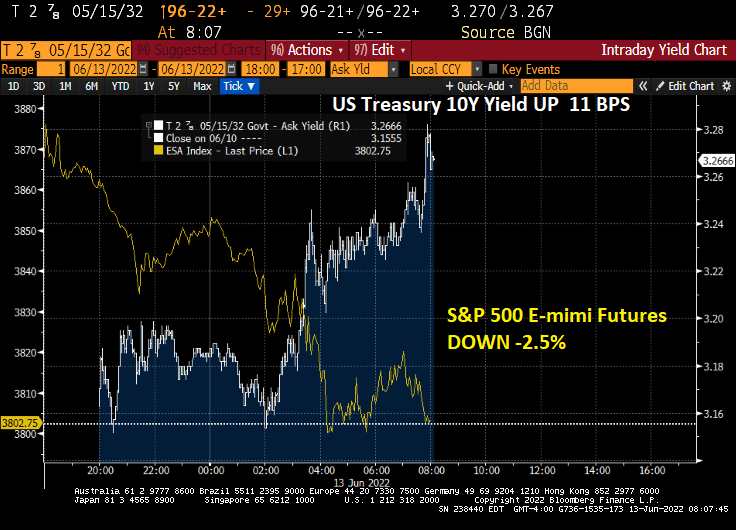
Off to bad start this week. The 10-year Treasury yield rose 11 basis points at 8am EST while the S&P 500 E-mini futures are down -2.5%.

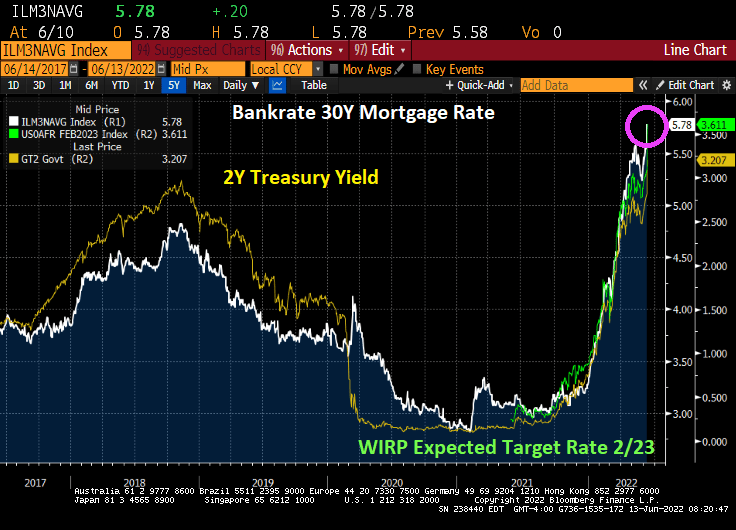
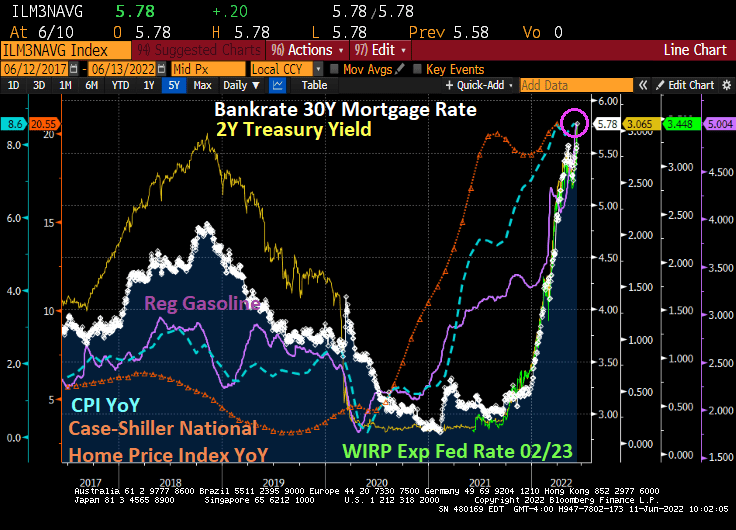
And then we have this scary chart of mortgage rates. Bankrate’s 30-year mortgage rate is now up to 5.78%.

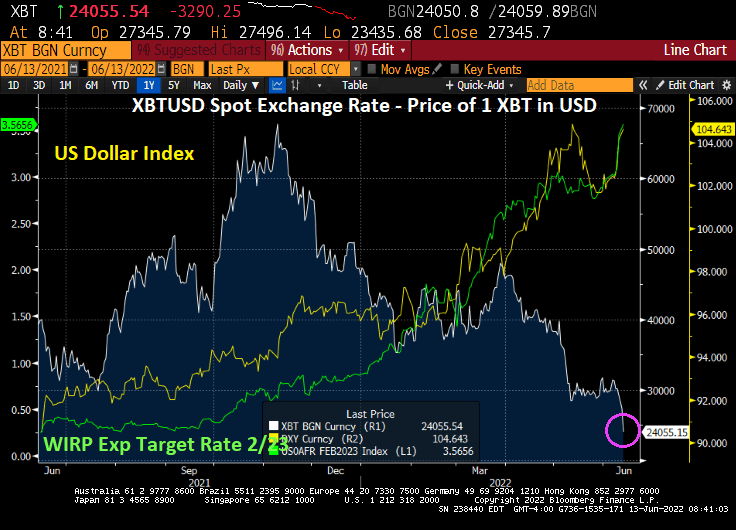
And then we have Bitcoin. Bitcoin is struggling as The Fed tightens the noose on the US economy with expected Fed rate hikes and a rising US Dollar.

I’ve got a whole lotta anxiety over this week.

The dynamic duo.

Weekend Update! US Gasoline Tops $5 (Highest In History), 2Y Treasury Yields Soaring, Mortgage Rates Highest Since 2008 (Inflation Tax Costing Households $5,200 More YoY)

Up, up and away in our inflationary balloon!

Regular gasoline prices have breached the $5 a gallon barrier, the highest in recorded history. And it is even worse in states like California where regular gas prices have been above $7 per gallon.

Bankrate’s 30-year mortgage rate is now 5.78%, the highest since 2008. And rising really fast as The Fed tightens the monetary noose.

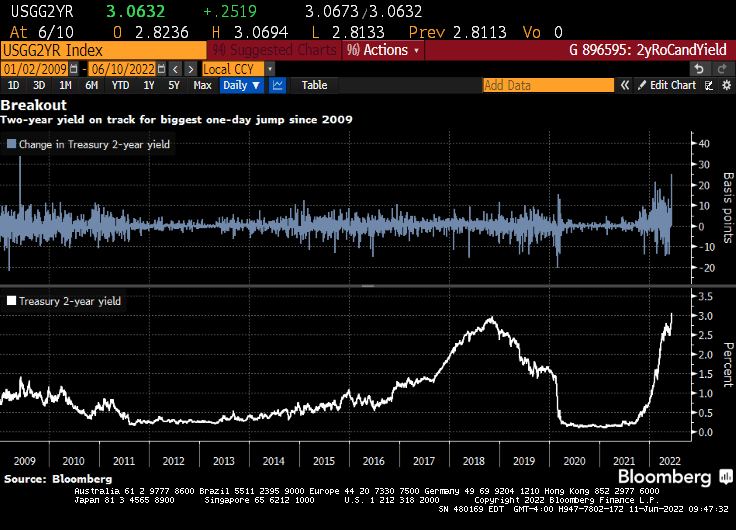
Speaking of noose tightening, the 2-year US Treasury Note yield is rising awfully fast.

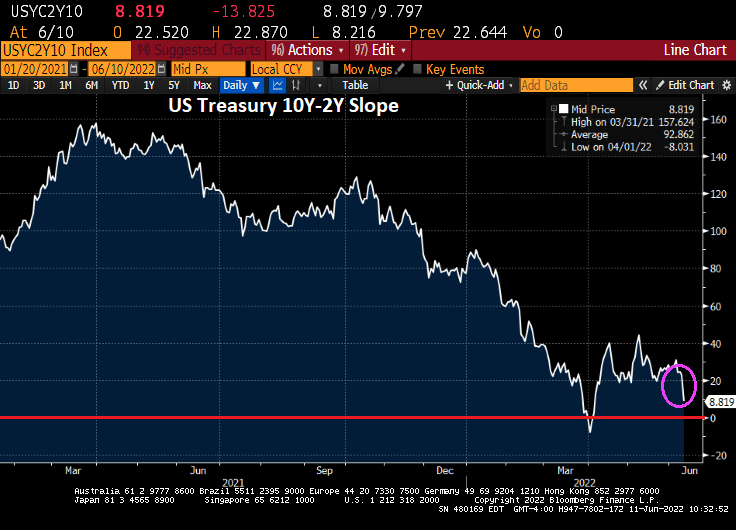
The US Treasury 10Y-2Y curve slope just flattened to 8.819 bps and challenging the 0% grade awfully fast.

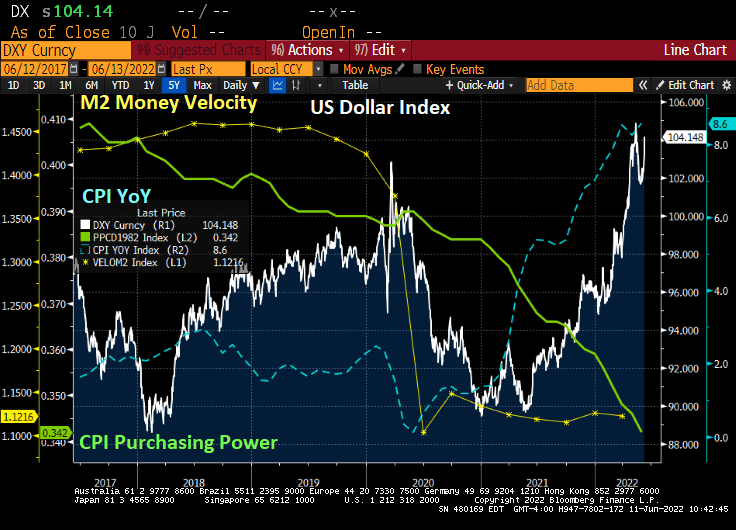
The US Dollar is soaring as US inflation soars, consumer purchasing power (green line) collapses along with M2 Money Velocity.

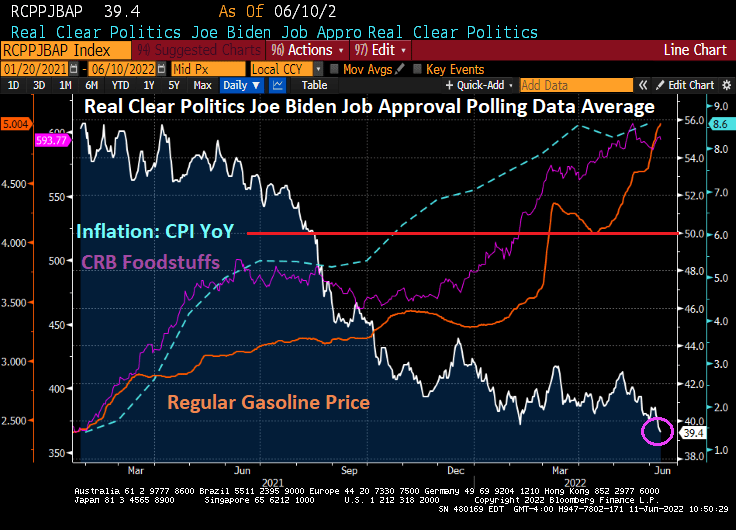
There is little doubt that soaring inflation, gasoline and food prices have hurt Biden’s popularity as well as the Democrats popularity ahead of the upcoming mid-year elections. People for the most part vote with their wallets.

According to estimates by Bloomberg Economics, US households will spend $5,200 more this year than they did last year on the same consumption basket.

That breaks down to $433 extra in expenditures every single month. That is what is called “the inflation tax.” And it hurts.

Call this The Inflation Tax Blues.

Fed Data Shows a Half Century of Moderate Growth in the Fed’s Balance Sheet Through Two World Wars – Then a Seismic Explosion Under Bernanke, Yellen and Powell (Mortgage Rates Rise To Highest Since June 2009)

Wall Street on Parade had an excellent article showing the seismic explosion in the Fed’s Balance Sheet after the housing bubble burst and ensuing financial crisis.

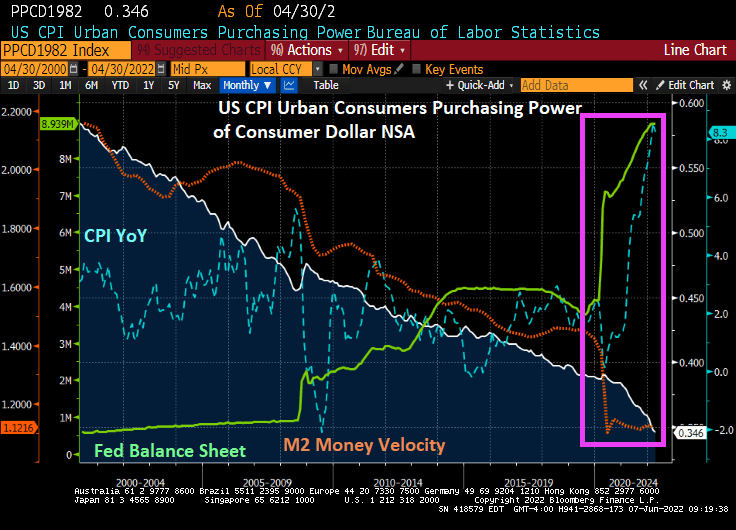
Here is my version of their chart since 2000 where you can seen the seismic shift in the balance sheet (toxic green slime line), particularly with The Fed’s response to Covid. The Fed is signaling a tightening in monetary policy to help reduce inflation (blue line).

But notice that M2 Money Velocity (GDP/M2) is now near the all-time low along with consumer purchasing power.

How BIG is The Fed’s balance sheet? Try more that a third of size of US GDP.

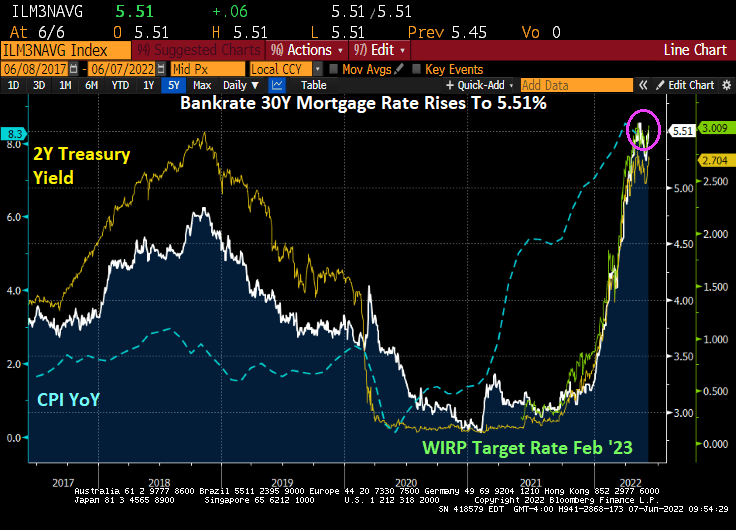
And as The Fed signals its inflation-fighting intentions, mortgage rates have shot up to 5.51%, the highest mortgage rate since June 2009.

Here is a video of the seismic shift in The Fed Balance Sheet, now that they are allegedly tightening monetary policy.

Speaking of seismic shifts, the Atlanta Fed’s Q2 GDP tracker just fell to +0.9%.

The Fed’s noose is tightening on the economy.