Doom Loop? The US Dollar Is Booming, But Will A Doom Loop Follow? (US Treasury Yield Curve Inverted At -20 BPS)

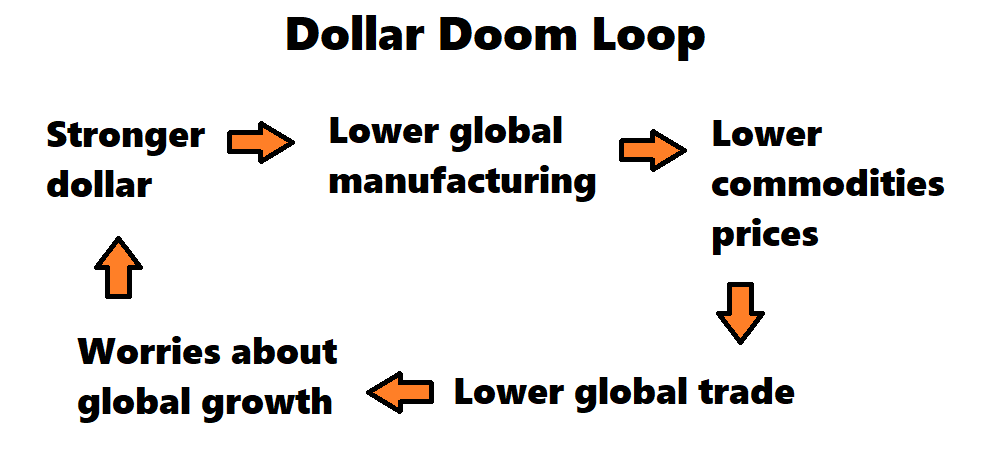
Here we go doom loop de loop?

The dollar’s gain is the world’s pain — and based on its current trajectory, the world may be in for a whole lot more discomfort.

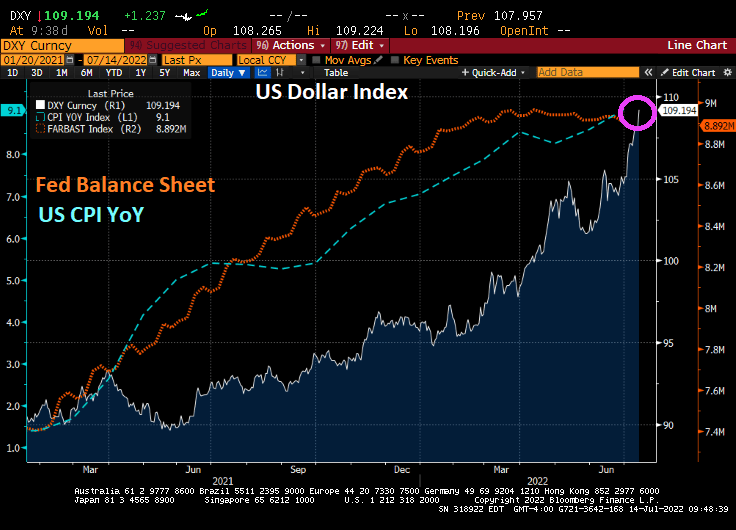
Concerns over global growth have recently sent the US Dollar Index to the strongest level on record, with the greenback hitting multi-decade highs against currencies like the euro and the yen.

But the move risks becoming a self-reinforcing feedback loop given that the vast majority of cross-border trade is still denominated in dollars, and a stronger US currency has historically translated into a broad hit to the world economy.

Against the backdrop of higher-than-expected inflation and still-elevated commodities prices, the concern is that we’re in for a dollar ‘doom loop’ like never before, according to Jon Turek, the founder of JST Advisors and author of the Cheap Convexity blog.

With the Federal Reserve hiking interest rates at the fastest pace in decades, he says, it’s much less clear what could break the feedback loop in the next few months.

The Dollar Doom Loop with US inflation causing The Fed to tighten
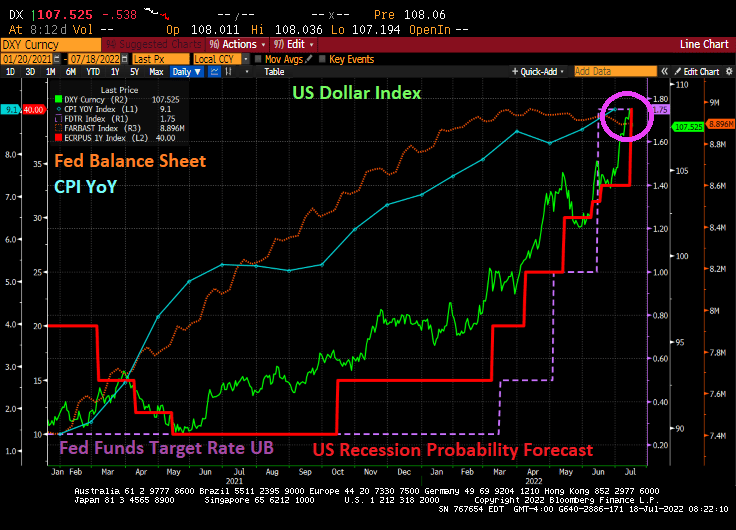
Under Biden’s policies, inflation hit a 40-year high (blue line), and the US Dollar (green line) is strengthening. Then we have The Fed raising the target rate (purple line) and the probability of recession rising with Fed tightening.
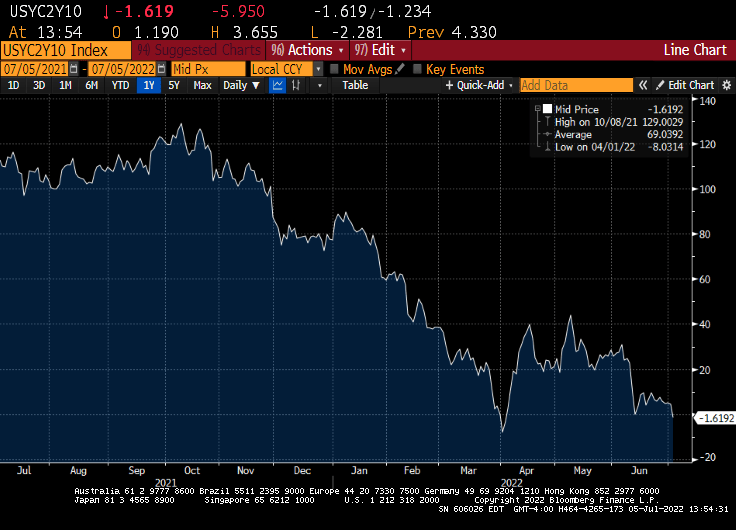
Is a US recession coming? The US Treasury 10Y-2Y yield curve is inverted at almost -20 basis points.

There is a Fed open market committee meeting in one week and they are expected to raise their target rate by 75 basis points according to Fed Fund Futures data. Inflation keeps rising as does the probability of a US recession. So, The Fed will keep on tightening.

Buckaroo! Why The Fed Won’t Be Able To Contain Inflation (Taylor Rule Suggests A Target Rate Of 23.30%, A Bridge Too Far)

The Federal Reserve has behaved like buckaroos! Why? Since the financial crisis, The Fed has left its enormous monetary stimulus outstanding for too long.

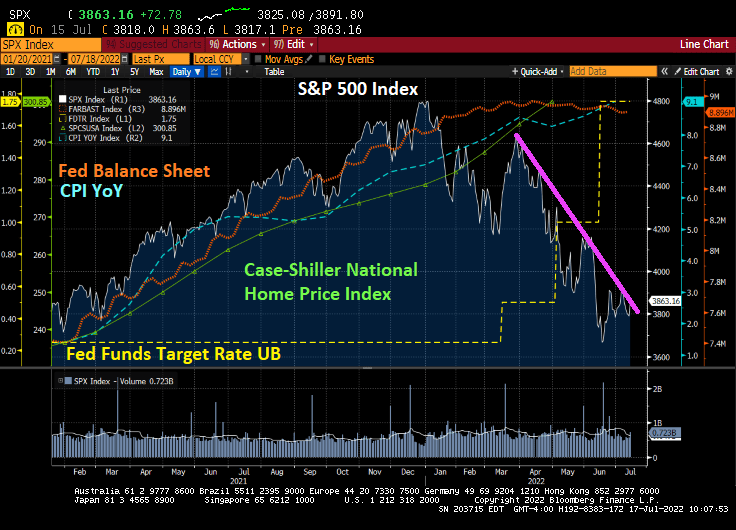
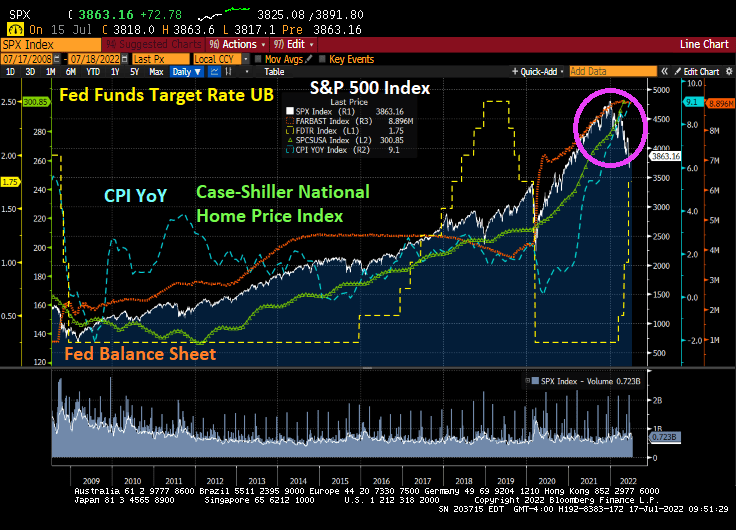
The Fed initiated asset purchases in a series of moves (aka, QE) culminating in Covid QE that has been barley removed. With The Fed’s stimulypto (and Federal spending), we have seen the S&P 500 index soar along with home prices.

Of course, this begs the question as to whether the stock market and housing market can withstand The Fed’s tightening plans.

A closer look at the S&P 500 index and the Case-Shiller National home price index under Biden. The S&P 500 has been declining since The Fed started their monetary tightening. But the Case-Shiller National home price index as of April ’22 was still soaring.
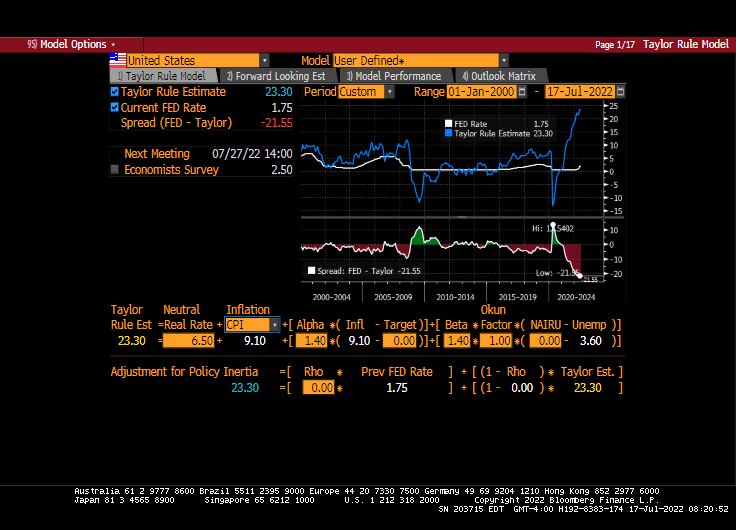
With inflation at a 40-year high, the Taylor Rule suggests a Fed target rate of … 23.30%. It is currently at 1.75%. That is an unrealistic target rate that The Fed will never do. It is, in fact, a Bridge Too Far.

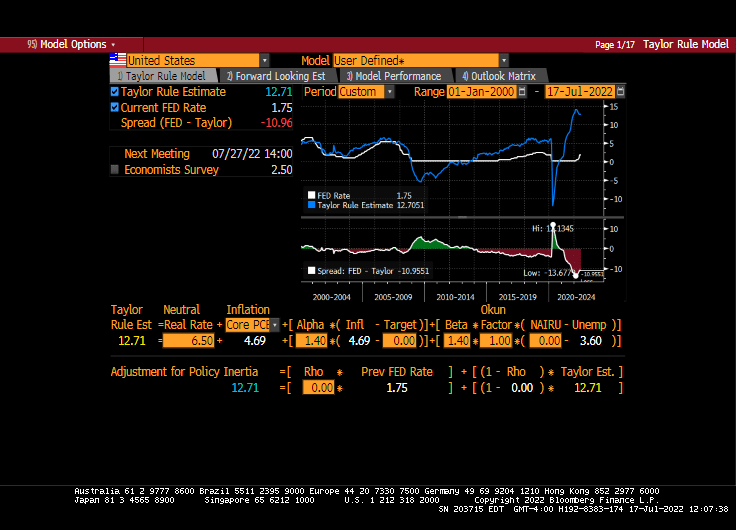
How about the Taylor Rule using Core PCE? It is still 12.71%. Still a bridge too far!

Markets are conditioned to massive Fed stimulypto, so how will markets react to stimulus reduction?

While The Fed is intent on withdrawing SOME of the enormous monetary stimulus, they are still buckaroos. And Biden/Congress still want to distort markets by Federal spending such as the Build Back (Inflation) Better bill that Manchin has blocked … so far.

The Core? Flexible Price Inflation Rises To 18.74% While Core Inflation Plunges To 8.40%, “Fats” Waller Backing 75 Basis Point Hike (30Y Mortgage Rate Rises To 5.83%)

As Americans are painfully aware, inflation is the highest in 40 years prompting The Federal Reserve to remove the massive punch bowl. In fact, Federal Reserve Governor Christopher “Fats” Waller backed raising rates by 75 basis points this month.

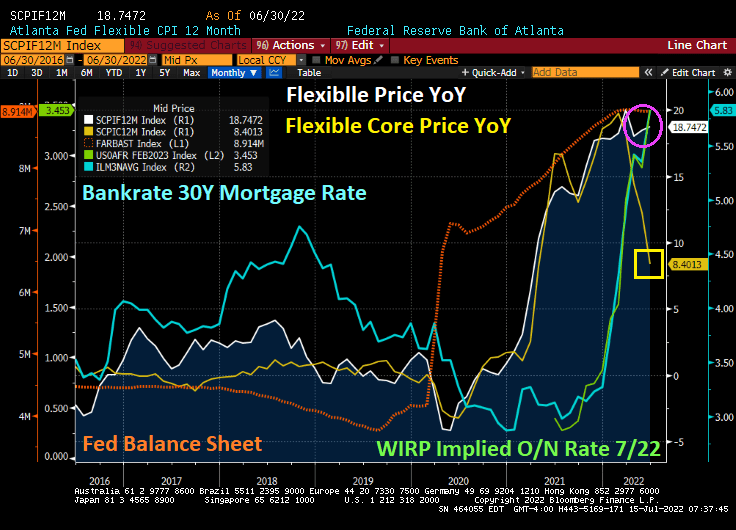
How hot was the recent inflation report? The Atlanta Fed’s flexible price index rose to 18.74% YoY. On the other hand, the CORE flexible price index (less energy and food) plunged to 8.46% YoY. The 30-year mortgage rate from Bankrate rose slightly to 5.83% as the implied overnight rate for the July FOMC meeting rose to 3.45%.

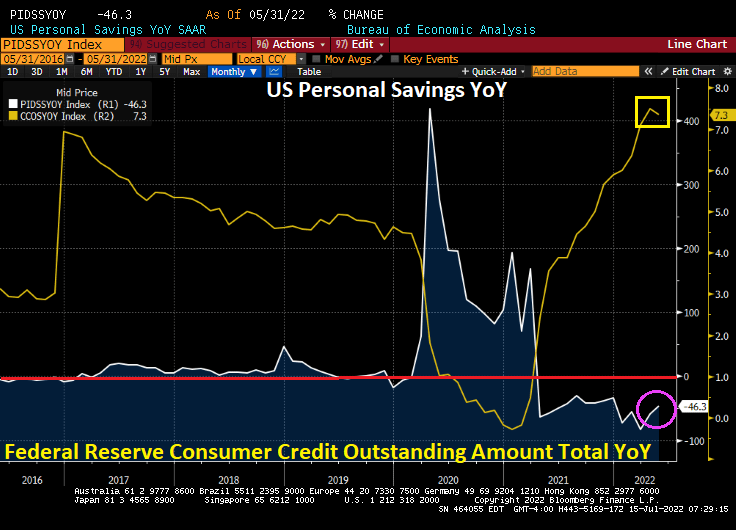
Inflation is ravaging consumers with the savings rate falling by -46.3% YoY while consumer credit rose 7.3% YoY. Yes, thanks to high inflation, consumers are saving less and borrowing more.

When even CORE flexible price inflation is 8.40% YoY, you know that The Fed and Federal government have made serious policy errors.

Bottle Of Wine? Strong US Dollar And Soaring Inflation Is A Brutal Cocktail For S&P 500 Firms (Will The Fed Pivot To QE Again?)

The US Dollar keeps strengthening as inflation skyrockets. Good news?

Bear in mind that a strong dollar is a two-edged sword. The US Dollar Index has risen 16% year-over-year, presenting a big hurdle for US firms with business overseas.

That strength of the greenback will rise until the Fed makes a dovish policy pivot.

And that pivot is forecast to occur at the Feb ’23 FOMC meeting.

But will The Fed pivot?

The Biden Cocktail. A fine wine turned to vinegar.

Fed Fireball? US PPI Final Demand UP +11.3% YoY As Fed May Raise Rates 100 Basis Points At July 27th FOMC Meeting (Stocks In A Sea of Red)

Face it. The Biden Administration has little interest in trying to increase the supply fossil fuel energy which would anger his “green” base (like building more refineries or allowing for more crude oil and natural gas exploration). So, the burden of “inflation fighting” falls on the frail shoulders of The Federal Reserve.

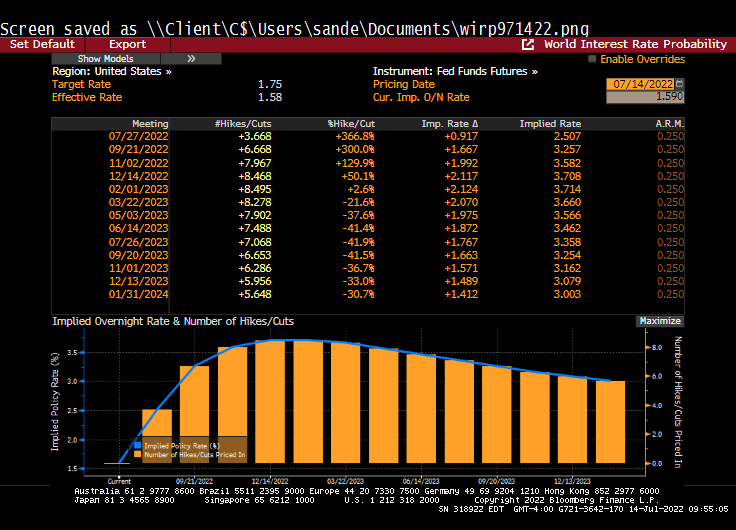
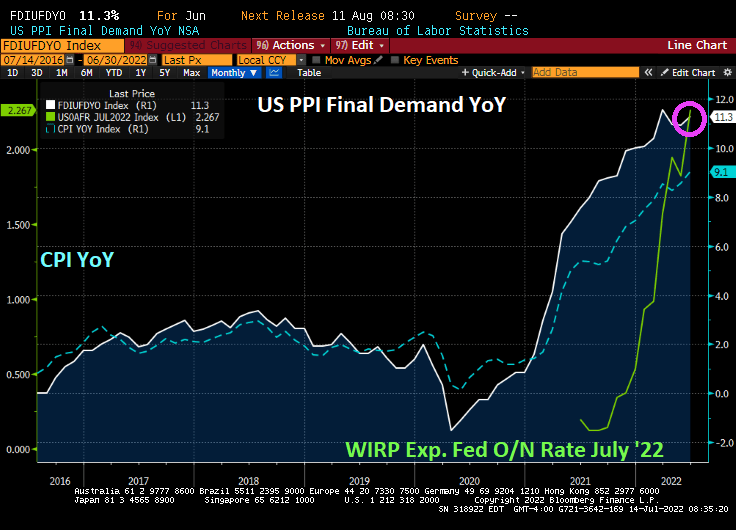
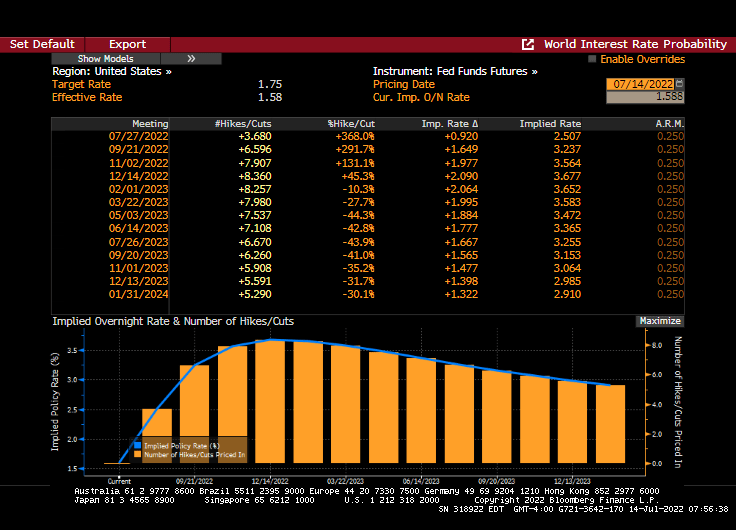
Given today’s US Producer Price Index Final Demand prices rising +11.3% YoY in June, it seems that The Fed has not been able to extinguish the “Tower of Inflation.” But, Fed Funds Futures are pointing to a near 100 basis point (or 1%) increase in The Fed Funds target rate at the July 27th Fed Open Market Committee (FOMC) meeting.
The Fed Funds Futures Data points to a +0.920 (almost 1%) increase at the July 27th FOMC meeting. Followed by rate cuts.

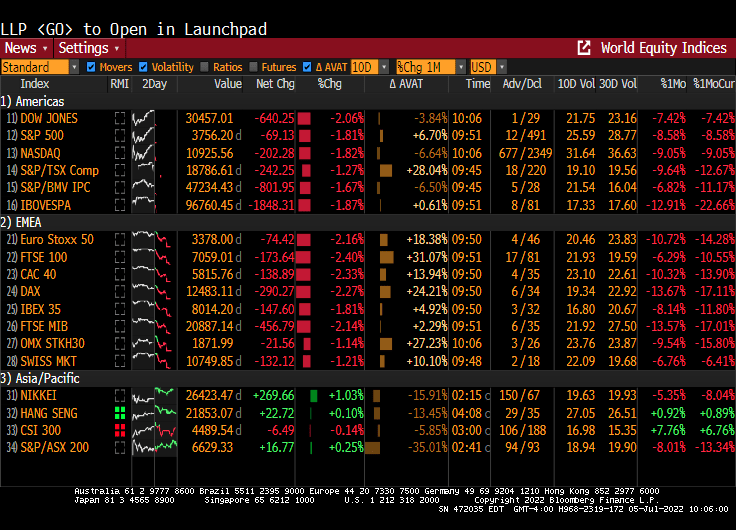
And with the fear of a near 100 basis point increase, today’s stock markets are a sea of red.

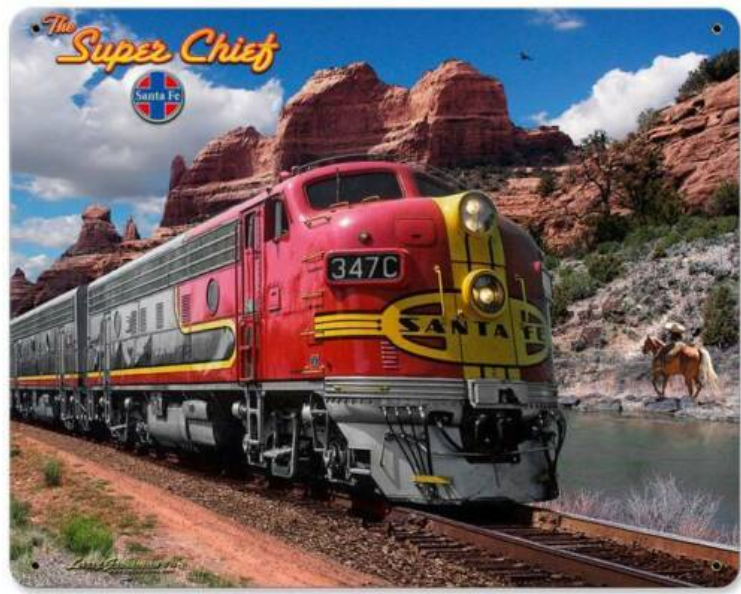
It is up to Fed Chair Jerome Powell and policy error brigade to extinguish price increases caused by 1) bad Biden energy policies and 2) too much spending by Biden and Congress. It is like trying to wave-down the Super Chief train with a cigarette lighter.

Yet, the Frail Fed will try to waive down The Super Chief inflation engine with Fed Fireballs. Aka, rate increases of 100 basis points.

Update! Dow down over 500 points this AM.

Hurt So Good? Copper Down -27% Since March 3rd, Bitcoin Down -70% Since Nov ’21 (Is The Fed Killing Off The Economy Or Just Removing “Free Money”?)

In the court of The Copper King!

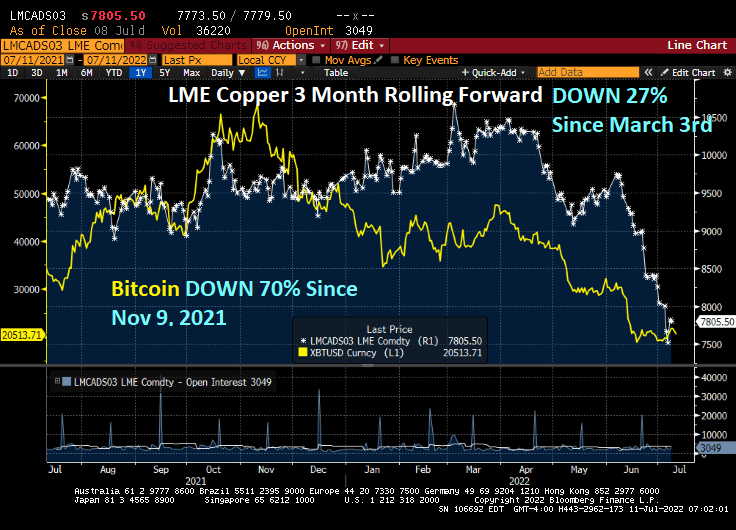
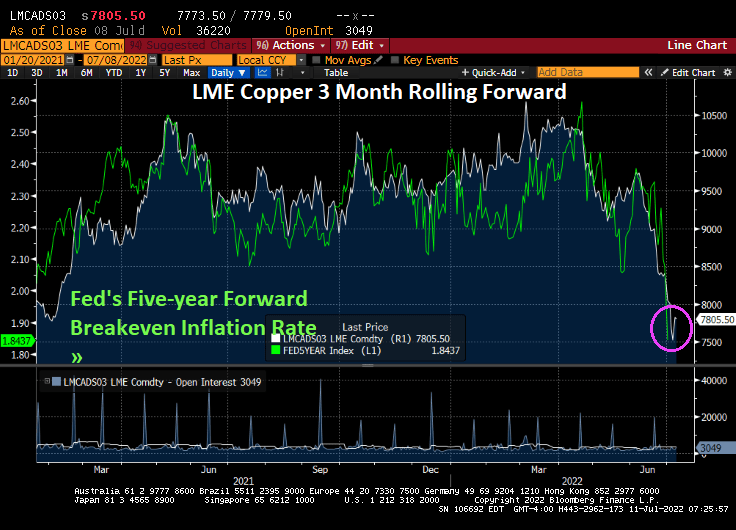
Copper, one of the economic measures of a growing economy, is down -27% since March 3, 2022 as recession looks more likely.

Let’s compare copper with another famous asset, Bitcoin. Bitcoin, a cryptocurrency, is down 70% since November 9, 2021.

As I discussed yesterday, The Fed’s five-year forward breakeven inflation rate has plunged to its lowest levels under Biden as the global economy is slowing.

Notice that copper prices fit pretty well with The Fed’s 5-year breakeven inflation rate.

It looks like The Fed is killing-off the economy in their quest to tame inflation.

The Biden economy doesn’t hurt so good. It hurts bad!

Inflation Nation! Fed’s 5Y Forward Breakeven Inflation Rate Plunges To Lowest Of Biden’s Presidency As Fed Hikes Rates (Mortgage Rates Resume Soaring)

US inflation is the highest in 40 years, yet inflation may be slowing as 1) The Fed cranks up interest rates and 2) the global economy is slowing.

US inflation data in the coming week may stiffen the resolve of Federal Reserve policy makers to proceed with another big boost in interest rates later this month.

The closely watched consumer price index probably rose nearly 9% in June from a year earlier, a fresh four-decade high. Compared with May, the CPI is seen rising 1.1%, marking the third month in four with an increase of at least 1%.

While persistently high and broad-based inflation is seen persuading Fed officials to raise their benchmark rate 75 basis points for a second consecutive meeting on July 27, recession concerns are mounting. There are signs, though, that price pressures at the producer level are stabilizing as commodities costs — including energy — retreat.

But the expectations of inflation, as measured by The Fed’s 5-year forward breakeven inflation rate, just crashed to 1.8437%.

The breakeven inflation rate is a market-based measure of expected inflation. It is the difference between the yield of a nominal bond and an inflation-linked bond of the same maturity.

The USD Inflation Swap Forward 5Y5Y is also falling like a rock as The Fed hikes their target rate (green line).

Could it be that inflation is cooling with Fed rate hikes (but not the shrinking of their $8 trillion balance sheet)?

Currently, Fed Funds Futures are pointing to a Fed target rate of 3.552% by February 2023. And with that, Bankrate’s 30-year mortgage rate rose to 5.75%. Once again, like velociraptors from Jurassic Park, The Fed’s balance sheet is still out in force.

Fed Chair Jerome Powell and Atlanta Fed President Raphael Bostic are keeping The Fed’s balance sheet at near $9 trillion as they hunt assets to inflate.

Money! About That June Jobs Report (The Fed’s Balance Sheet Still Out In Force!)

The Federal Reserve’s policies remind me of the Cabaret tune “Money.” There is still almost $9 trillion in monetary stimulus outstanding.

For all the economic cheerleaders out there like CNBC about the June job report, they generally ignore what is driving the jobs report: The Federal Reserve!

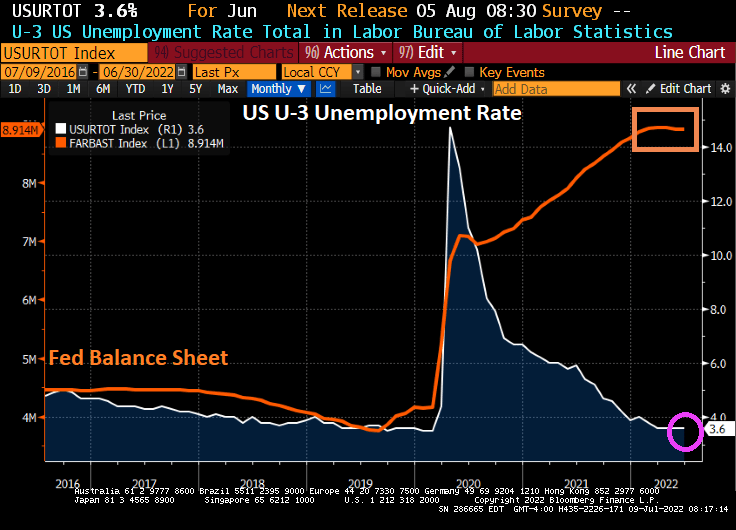
Take the US U-3 unemployment rate. The Biden Administration is proud of the unemployment rate of 3.6%. But if you look at the chart of unemployment relative to The Fed’s balance sheet expansion due to Covid lockdowns, there is still almost $9 trillion of Fed stimulus outstanding.

Of course, the lockdowns were pure economy killers, so opening the economies again led to the unemployment rate falling to 3.6% which is still higher than before the Covid outbreak. But The Federal Reserve has been painfully slow at shrinking its balance sheet, leaving almost $9 trillion in monetary stimulus outstanding.

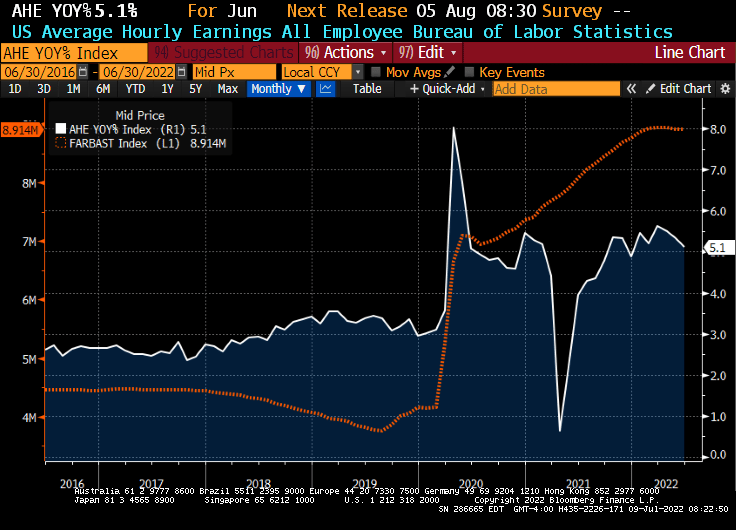
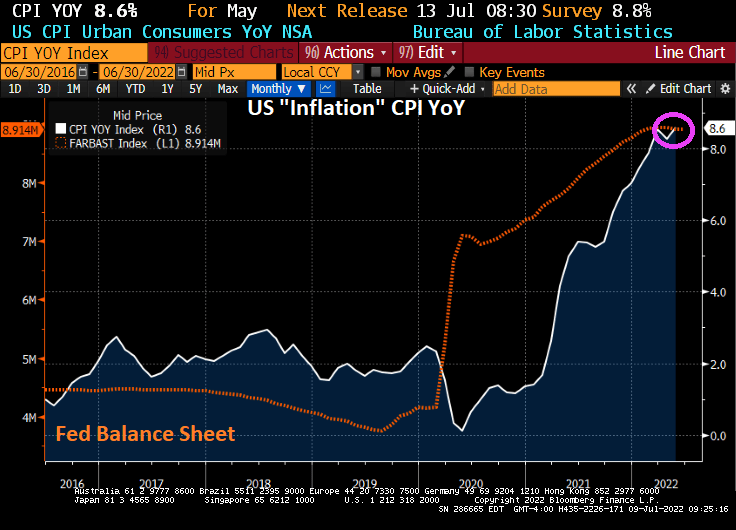
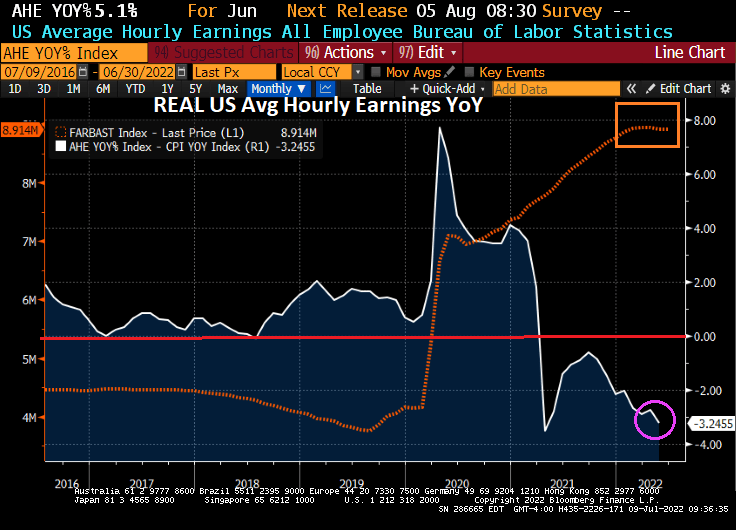
Take average hourly earnings growth. The media is all smiles as US wage growth declined to 5.1%, much higher than pre-Covid.

Then we have inflation, at 40-years highs thanks to massive Fed stimulus (and Federal spending).

And if we deduct inflation from average hourly wage growth, we see REAL wage growth declining at a -3.25% YoY clip.

Lastly, we have the US Dollar. Nothing has been the same since the financial crisis of 2008 and the entrance of The Federal Reserve distorting the economy and prices. Not to mention the US Dollar.

The Fed leaving its monetary stimulus out in force for so long is a major policy error. So what happens when The Fed actually gets serious about withdrawing the monetary stimulus (likely after the midterm elections)?

Bidenflation Strikes! Dow Down 2% As Recession Fears Grow (Check Out M1 Money Growth!)

Lightning strikes!

Inflation has been a disaster for millions of Americans. As inflation grows (highest in 40 years), fears of recession are jolting markets.

The Dow today is down 2%.

Then again, Europe is down even more.

My favorite chart for explaining the surge in inflation is M1 Money Stock around the Covid outbreak in early 2020. Which has NOT been removed.

The US Treasury 10Y-2Y yield curve just inverted.

No, this is not a real ECB currency, but it might as well be.

Slowing! US Personal Consumption Expenditures Drop To 0.2% MoM In May As PCE Deflator Hits 6.3% YoY (US Mortgage Rates Slip to 5.7%, the First Decline in Four Weeks)

The US economy is slowing as inflation ravages consumers. US Regular Gasoline prices, for example, are up 104% under President Biden which helps to slow the economy.

US personal consumption expenditures fell to +0.2% MoM in May as “inflation” or real personal consumption expenditures PRICES rose +6.3% YoY as The Fed’s balance sheet (aka, Master Blaster!) remains.

As I mentioned above, US regular gasoline prices are UP 103% under President Biden, diesel prices (the cost of shipping goods to markets like … food is up 119% under Biden while CRB foodstuffs is up 55% under China Joe.

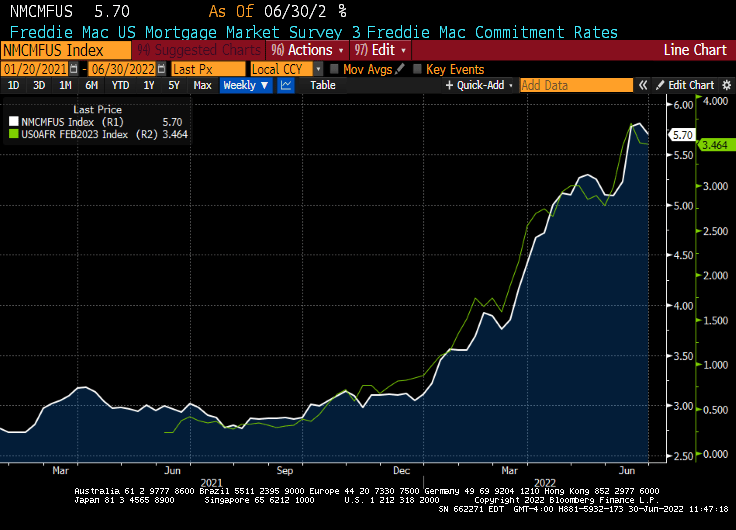
Now we have mortgage rates in the US falling for the first time in four weeks. The average for a 30-year loan was 5.7%, down from 5.81% last week, Freddie Mac said in a statement Thursday.

This year’s Fourth of July celebration is going to cost 18% more than last year’s celebration.

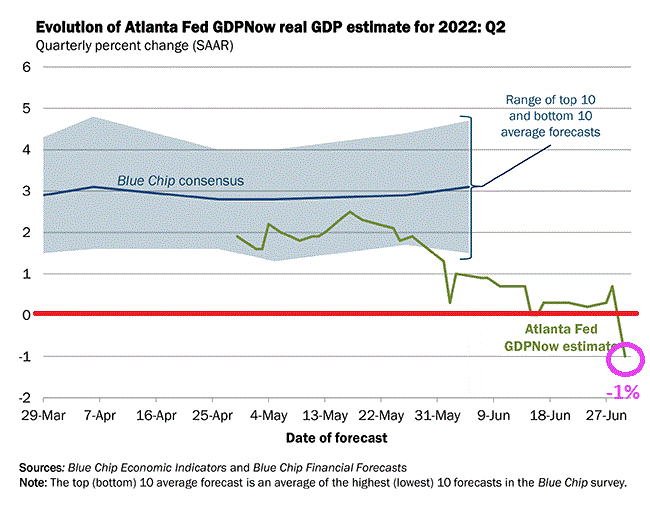
Lastly, the Atlanta Fed GDPNow real time tracker for Q2 is showing … -1% GDP “growth.”

So, yes, the US economy is slowing.