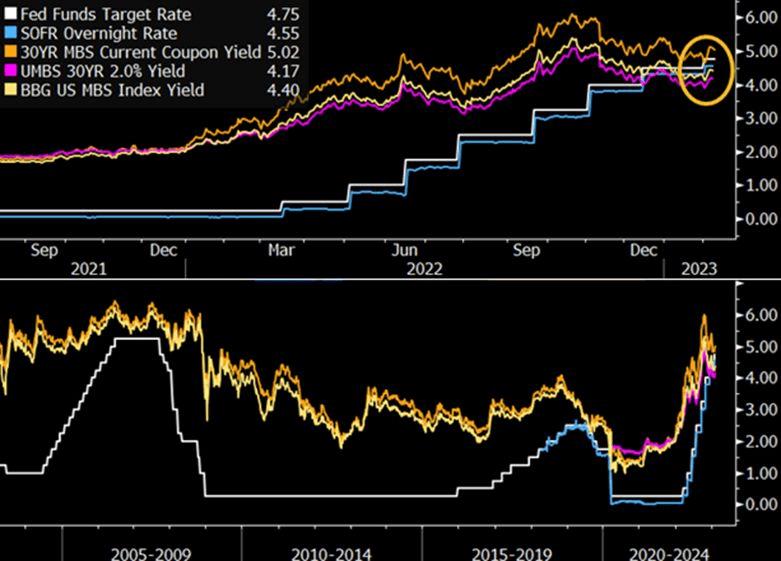
The most recent tightening by the Federal Reserve has pushed the federal funds target rate above mortgage-backed securities yields for the first time in history. Though this poses clear challenges of carry for MBS holders, selective investments in specified pool and collateralized mortgage obligations (CMOs) could provide incremental returns.
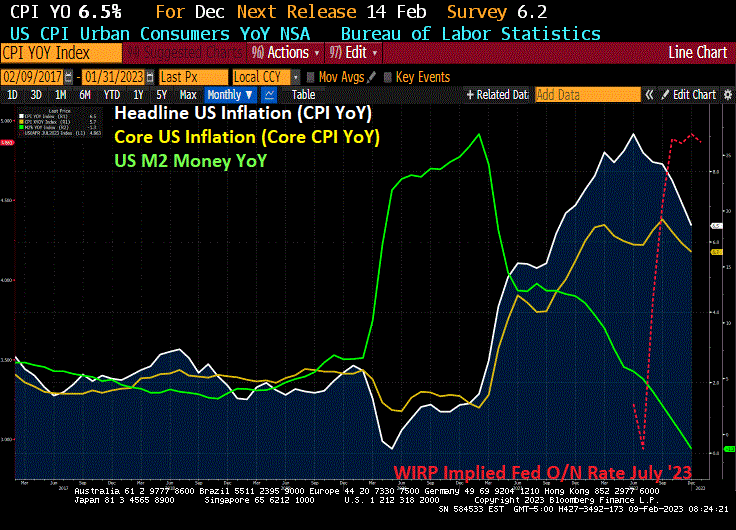
Inflation started under Biden, but the massive expansion in money supply (M2) begin with Covid in 2020.
Once this latest spending splurge kicks in, we will see rising inflation again. After all, Biden and Congress have gotten the taste for massive spending bills (like vampires) and spending likely won’t slow down.
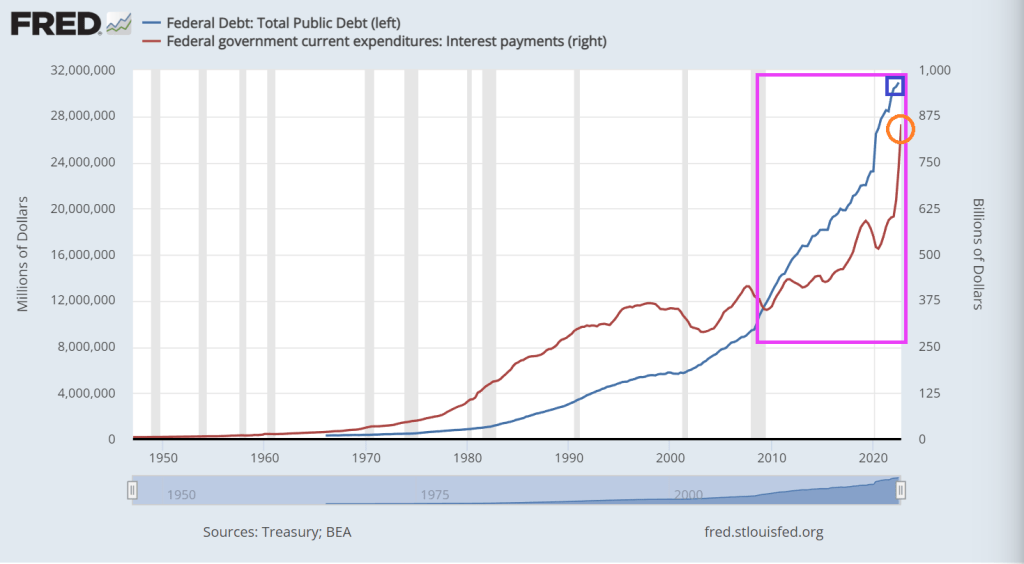
Nothing has been the same since Nancy Pelosi (CA-D) became Speaker of the House in January 2007. In fact, US public debt was at $8.68 trillion when she was handed the gavel and US public debt now sits at $31.55 trillion. That is a whopping 264% increase in the nation’s debt under free-spending SanFranNan. To Pelosi, there is no such thing as too much debt.
To be fair, Pelosi had plenty of help. We had Barack Obama and Joe Biden assume the Presidency in 2009 and in between we had RINOs (Republicans in name only) John Boenher and Paul Ryan as House speakers. In the Senate, the US has had Harry Reid (NV-D), Chuck Schumer (NY-D) and breifly Mitch McConnell (KY-R) as majority leaders. Of course, he had Donald Trump as President for 4 years then a return to the Obama-Biden Presidency with Old Joe as President for the past 2 years.
This chart show how deranged Congress and the Administration became since 2007. On October 3, 2008, President George W. Bush signed the $700 billion Emergency Economic Stabilization Act (EESA) of 2008 after Treasury Secretary Henry Paulson asked Congress to approve a bailout to buy mortgage-backed securities that were in danger of defaulting.
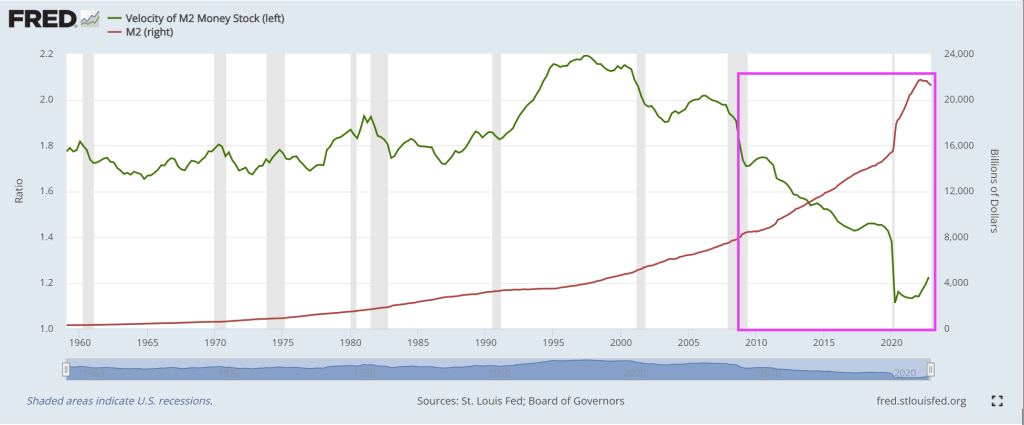
Since 2007, the US has expereienced a housing bubble burst and ensuing financial crisis (2008/2009), then a Covid economic shutdown in 2020 requiring (in the mind of Statists) massive Federal spending in the form of Covid Relief (aka, the American Rescue Plan) for $1.9 TRILLION, then Infrastructure Spending bill for $1 TRILLION, the Inflation Reduction Act (really a green energy spending bill dressed up as an inflation reduction measure) and the infamous pork-laden Omnibus bill. All this Federal spending has driven up M2 Money by 200% since Pelosi first became House speaker.
Look at the chart of M2 Money Velocity (GDP/M2 Money) since Pelosi became House Speaker. It has collapsed.
Pelosi is also notable for her “You have to pass the bill to see what’s in it” speech on the Affordable Care Act and childishly tearing up on camera a copy of Donald Trump’s State of the Union address.
Meanwhile, the US has $181.5 Trillion in UNFUNDED LIABILITIES that will require MORE debt to be issue. Social Security unfunded liability is now $22.46 trillion and Medicare unfunded liability is up to $35 trillion. But if you dare mention “reform” to these massive entitlement boondoggles, President Biden and Senate Majority Leader Chuck Schumer will say “Republicans want to take away your Social Security!” That isn’t what Rick Scott (FL-R) said.
Unfunded liabilities per citizen is now $542,457. I propose that all illegal immigrants crossing the Mexican border (or Canadian border) per forced to pay their share of unfunded liabilities as an entry fee..
While Congress debates cutting spending (Hint: Childish Biden and Schumer said no to any cuts to spending), the US Debt Star gets closer to completion.
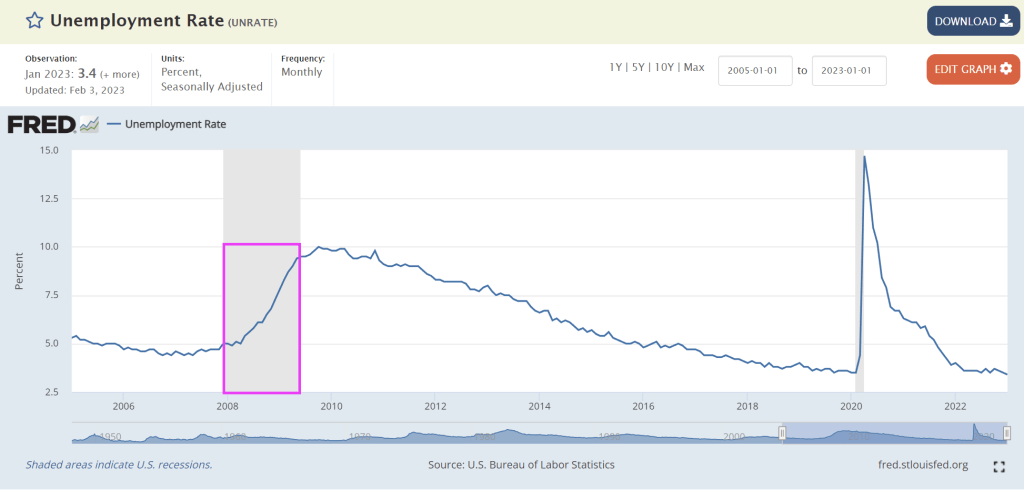
Biden’s State of the Union address saw him bragging about his record job creation (actually, it was the private sector, not Biden than created jobs) and historic unemployment rate. What Biden didn’t mention (along with not discussing the porous Mexican border with fentanyl pouring across or why he failed to shoot down a Chinese spy balloon until after it has passed over numerous military reservation) is that the unemployment rate always hit a low point just prior to a recession.
So, here we sit at 3.4% unemployment. But we also see the US Treasury yield curves (10Y-3M and 10Y-2Y) remaining deeply inverted.
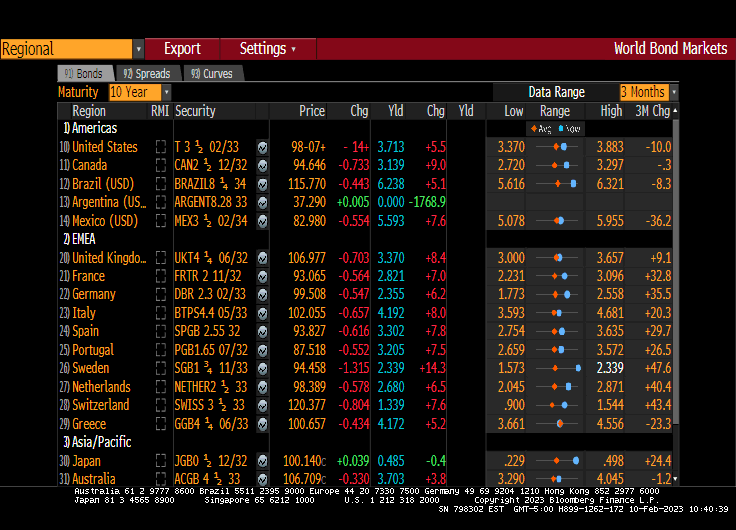
The US Treasury 10-year yield is up 5.5 basis points today.
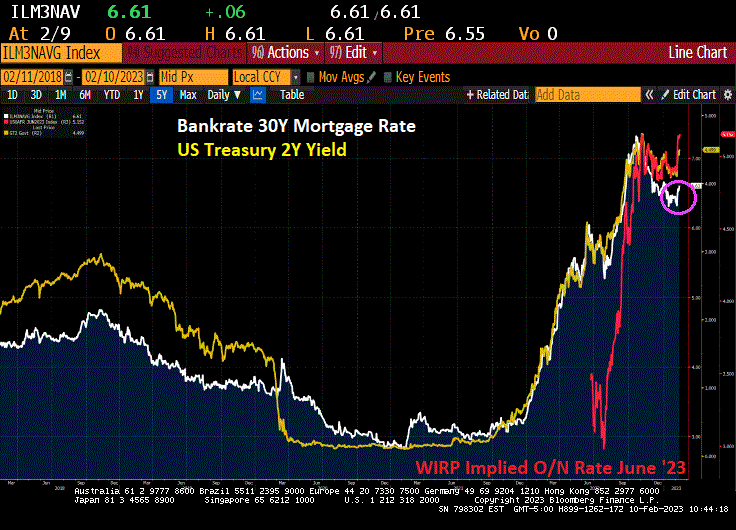
And Bankrate’s 30-year mortgage survey rate is up slightly today.
The one statement that Biden made in his State of the Union Address that was factually accurate was that inflation is coming down. Of course, he then blew it by saying he inherited inflation from Trump which was not true. Headline inflation (CPI YoY) was only 1.4% when Biden was sworn-in as President and rose to 9.1% YoY by June 2021 before finally starting to decline.
But despite the cooling of inflation (and M2 Money growth), The Fed seems hell bent on increasing their target rate, now forecast by Fed Funds Futures to peak in July 2023 at 5.123% before pivoting.
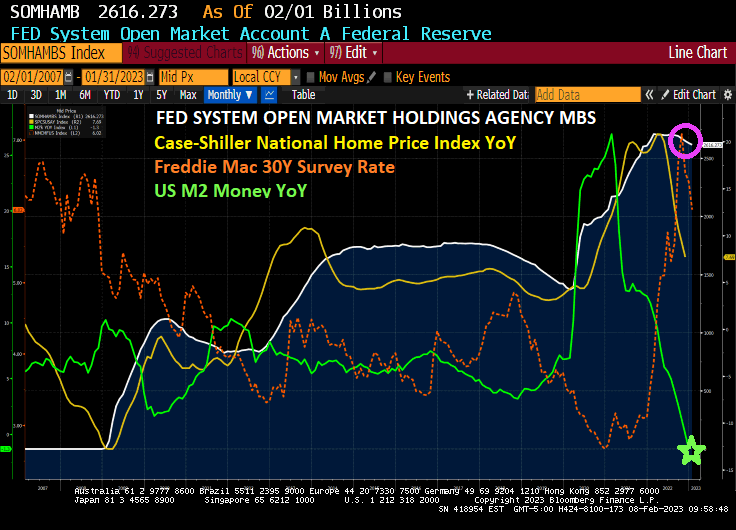
Starting in 2009 with the housing bubble burst and ensuing financial crisis, The Federal Reserve bought agency mortgage-backed securities (MBS) in an effort to provide stability to the then suffering housing and mortgage markets. Flash forward to today and The Federal Reserve still has $2.62 TRILLION in Agency MBS in its System Open Market holdings. And declining very slowly.
All this is happening as M2 Money growth YoY has gone negative and both mortgage rates and home price growth are slowing.
Is the US mortgage market that fragile that requires The Fed to support it?
The answer is yes if we look at the Mortgage Bankers Association weekly applications index. The Refinance Index increased 18 percent from the previous week and was 75 percent lower than the same week one year ago. The unadjusted Purchase Index increased 4 percent compared with the previous week and was 37 percent lower than the same week one year ago.
I noticed that Biden didn’t mention how mortgage purchase applications since he was installed as President have fallen -45%. Mortgage refi applications have dropped -88% since February 5, 2021.
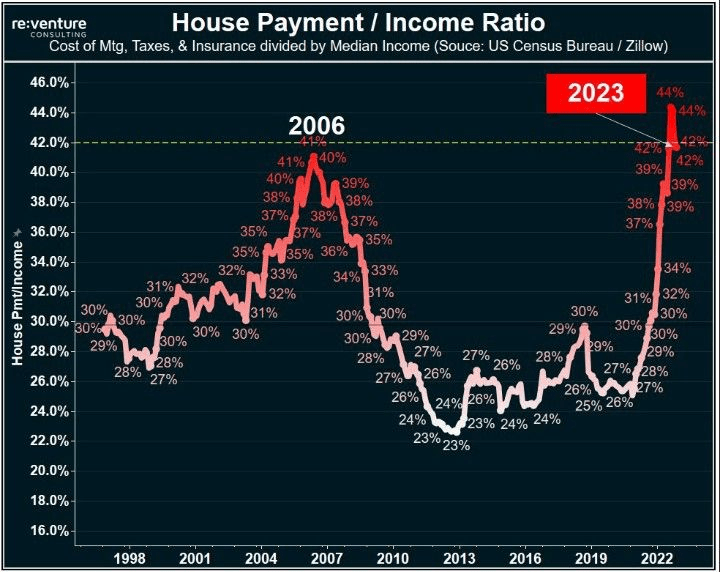
At least the US house payment to income ratio has declined since the peak. But still higher than at the peak of the US housing bubble in 2006.
“The U.S. economy added 517,000 jobs in January, more than doubling Wall Street expectations and turning up its nose at prognosticators of an imminent recession. The unemployment rate dropped to 3.4 percent, the lowest level since 1969. Analysts were expecting it to move in the opposite direction, ticking up to 3.6 percent.”
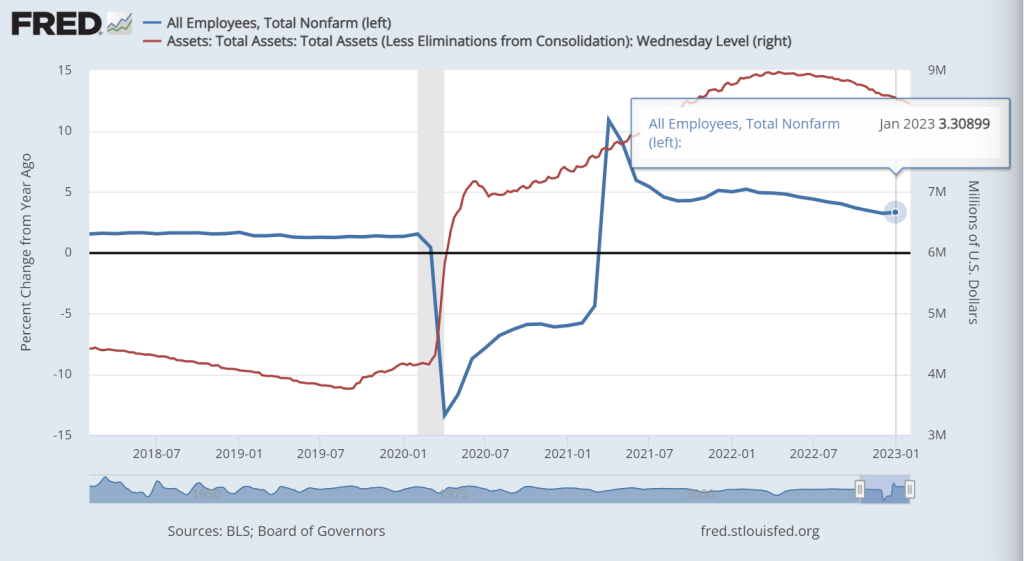
Yes, I was expecting U-3 unemployment to increase to 3.6% as well. What happened? Seasonal adjustments (BLS doens’t provide non-seasonally adjusted data). But the shocking headline (mostly due to seasonal adjustements) was not as surprising if we consider that jobs added in January grew at 3.309% year-over-year. Well, THAT isn’t all that surprising. Particularly since The Fed is slow walking its shrinking of The Fed balance sheet.
And with over 100 MILLION not in the labor force (apparently, the US labor force never really recovered from the Wuhan China virus), the U-3 unemployment rate touted by the media is misleading.
Bear in mind that employment is a LAGGING indicator. For example, the unemployment rate was 4.7% in November 2007 just prior to the beginning of the 2008-2009 Great Recession. So Biden’s bragging about the lowest unemployment rate since 1969 is meaningless in predicting recessions.
So, the January jobs report isn’t as surprising and strong as talking heads screamed about. I wish BLS would release non-seasonally adjusted (raw) data. But since we have a dysfunctional Federal government, I am not holding my breath.
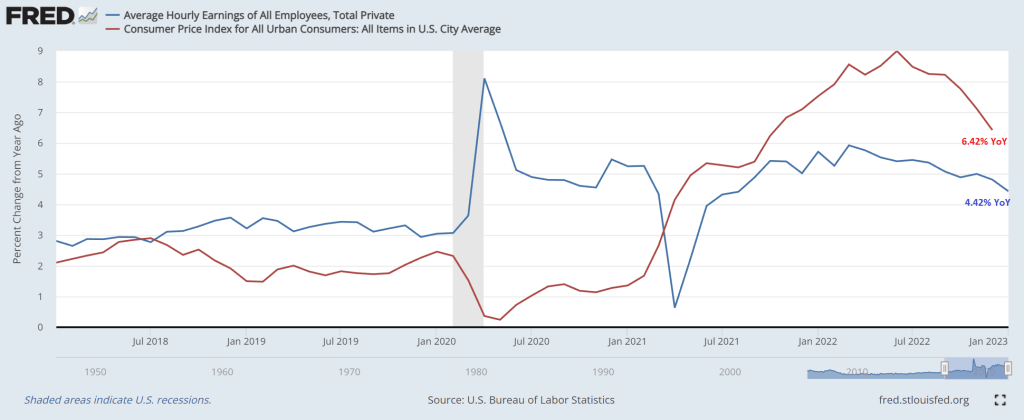
And I wouldn’t consider averrage hourly earnings growth YoY of 4.42% when headline US inflation is 6.42% particularly brag worthy.
Of course, Biden lied about inheriting inflation from Trump. Inflation was 1.28% YoY in December 2020 just before Biden was sworn-in as President. Then again, Biden lies about everything. At least he just refused to comment on the Chinese Spy Balloons.
President Biden had better give his State of the Union Address before the economy worsens any more.
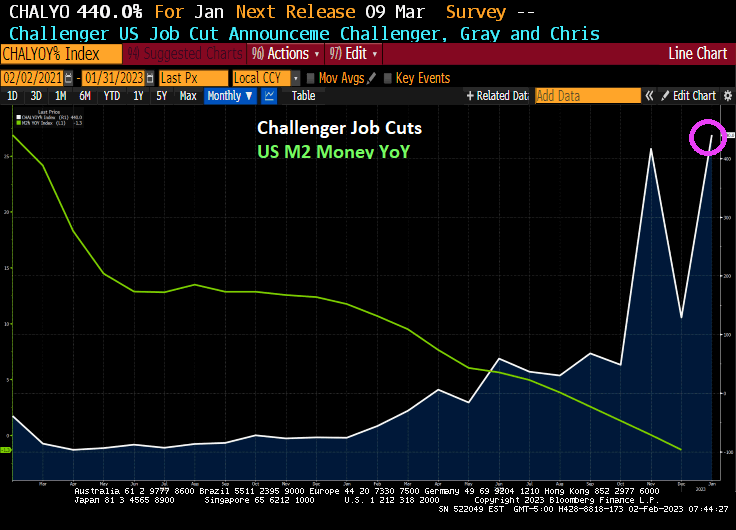
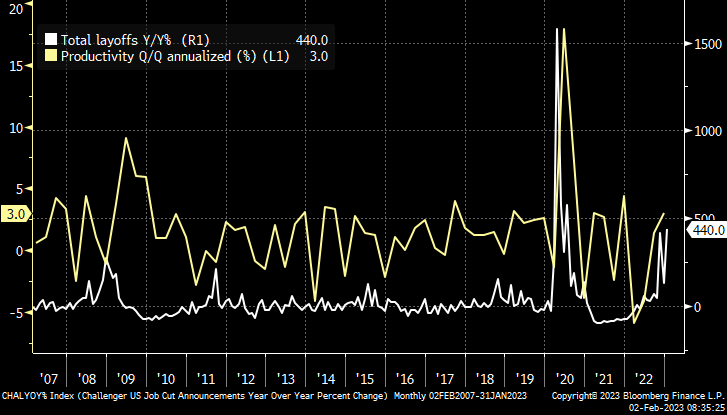
In January, the Challenger, Gray and Christmas jobs cuts index was a doozy. Jobs cuts rose 440%. This is happening as The Federal Reserve keeps its feet on the monetary brake pedal.
The Challenger report shows a big jump of 135.8 percent in layoff intentions to 102,943 in January, up from 43,651 in December and 440.0 percent higher than the 19,064 in January 2022. Many of the job cuts are in the tech sector, but job cuts are now spreading across the economy as a recession looms.
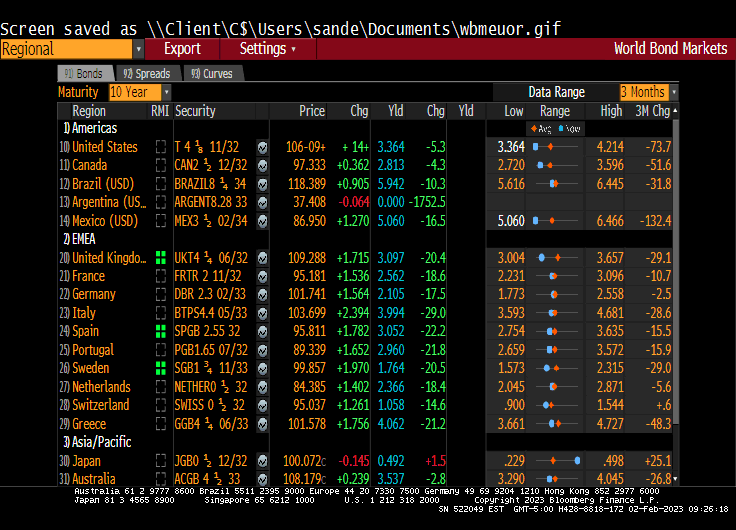
This morning, the US Treasury 10-year yield is down only -3.5 basis points, but it is Europe where the action is. UK is down -16.2 basis points and Italy is down -14.8 bps. UPDATE: US 10Y yield down -5.3 BPS, Italy 10Y down -29 bps.
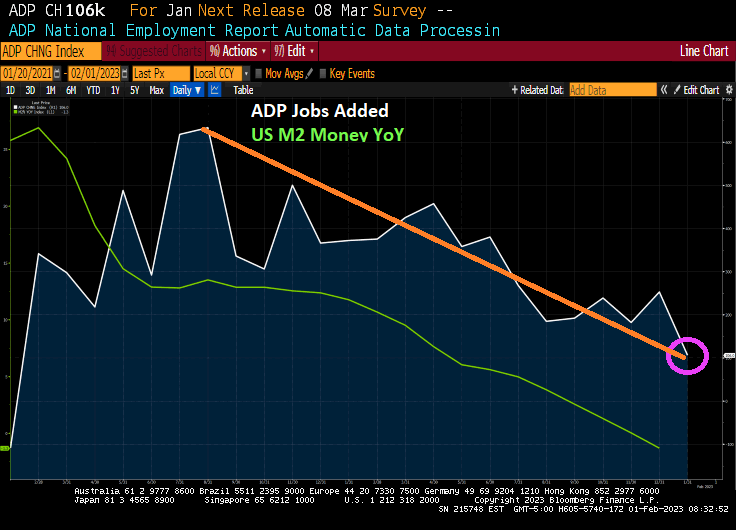
The US economy is slowing down. In fact, ADP jobs added just printed at 106k in January, the lowest reading since August 2021. ADP jobs added follows the slow down of M2 Money growth YoY as The Fed tightens its monetary policy.
Do I detect a trend (orange line)?
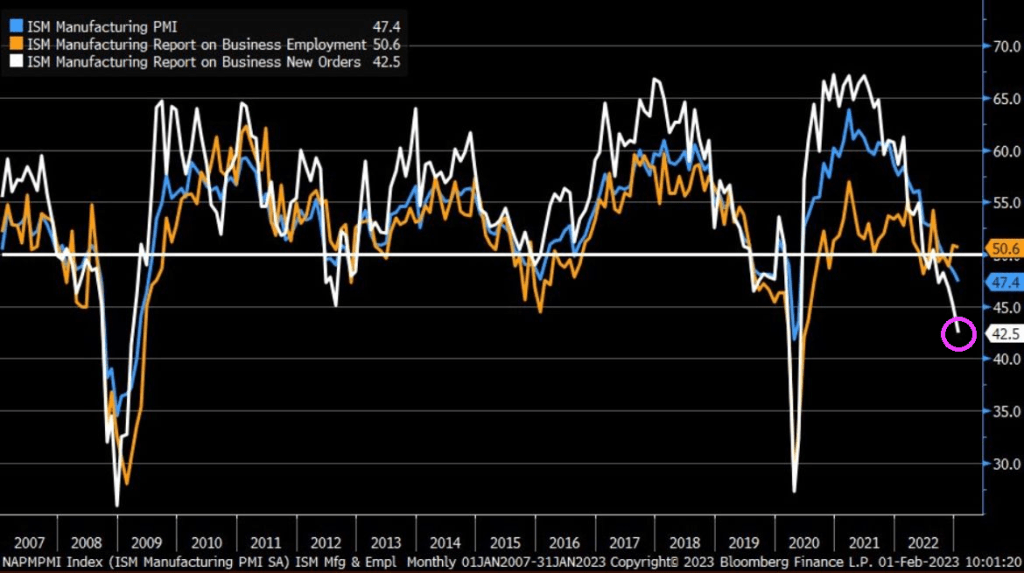
Speaking of trends, check out ISM Manufacturing New Orders. Lowest since Great Recession of 2008 (if I exclude the government economic shutdown Covid recession).
I doubt that January’s ADP report or the ISM Manufacturing report will be mentioned in Biden’s State of the Union address.
The January mortgage applications book is closed. And we are off to another year of rising applications until May. Then the downhill slide.
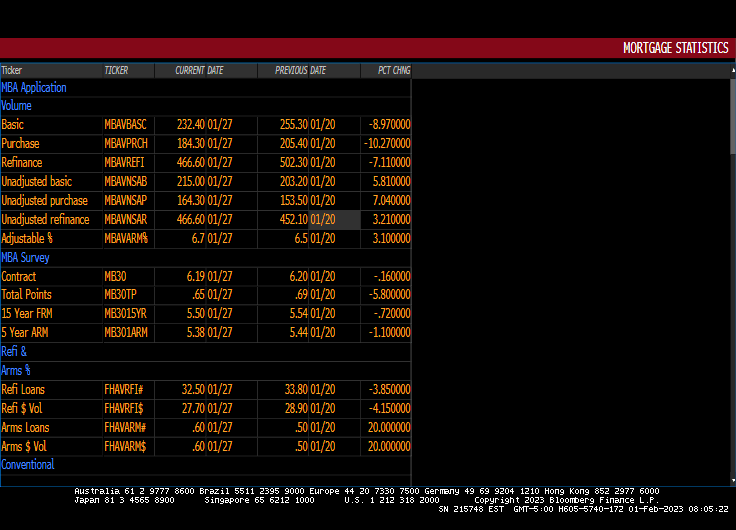
Mortgage applications decreased 9.0 percent from one week earlier, according to data from the Mortgage Bankers Association’s (MBA) Weekly Mortgage Applications Survey for the week ending January 27, 2023.
The Refinance Index decreased 7 percent from the previous week and was 80 percent lower than the same week one year ago. The seasonally adjusted Purchase Index decreased 10 percent from one week earlier. The unadjusted Purchase Index increased 7 percent compared with the previous week and was 41 percent lower than the same week one year ago.
US mortgage rates have been steadily declining since November 2022.














You must be logged in to post a comment.