Another economic report on Bidenomics. This one is for housing.
Realtors Pending Home Sales Index (PHSI)* – a forward-looking indicator of home sales based on contract signings – rose 0.9% to 77.6 in July. Year over year, pending transactions fell by 14.0%. An index of 100 is equal to the level of contract activity in 2001.
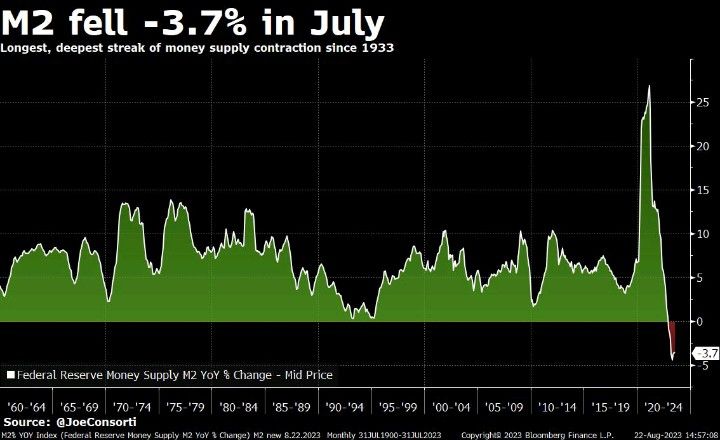
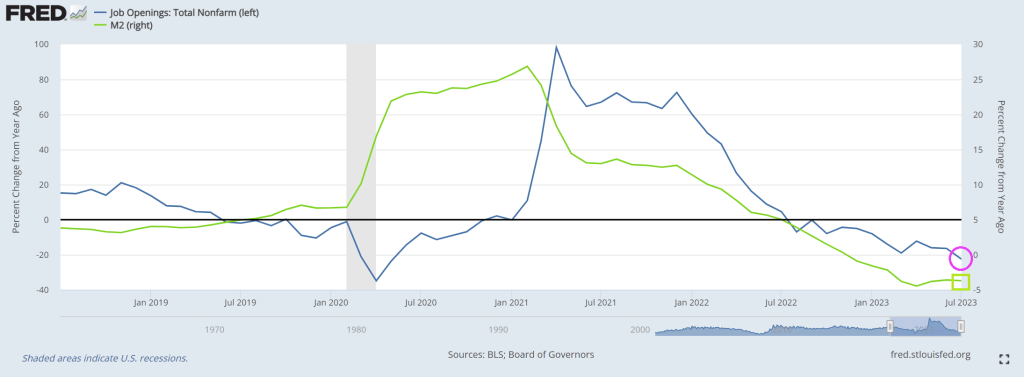
Combine that with crashing M2 Money growth (lowest since 1933 and The Great Depression (and The Dust Bowl). The difference is that the US had the soothing talks of Franklin Roosevelt “I can assure you that it is safer to keep your money in a reopened bank than under the mattress.” —President Franklin Roosevelt in his first Fireside Chat, March 12, 1933. Unfortunately, we have Joe Biden, the WORST public speaker in history and a completely unempathetic person.
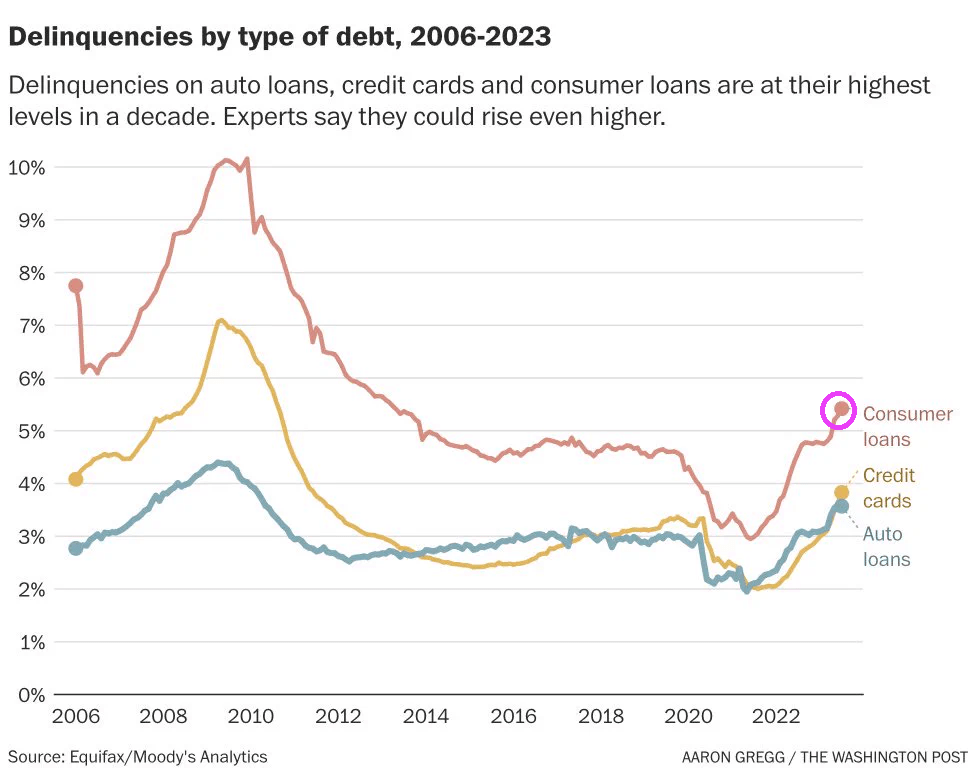
Delinquencies on auto loans, credit cards and consumer loans are at their highest levels in a decade.
Instead of Sleepy Joe, Middle Class Joe, Corrupt Joe (sounds like Cuppa Joe), and any of the multitude of unflattering nicknames, we now have REVEREND JOE.
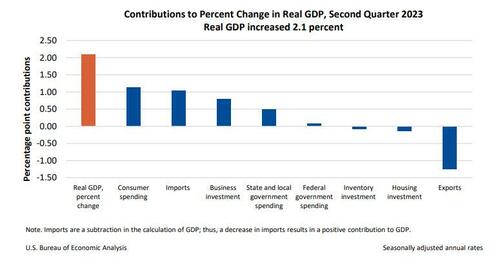
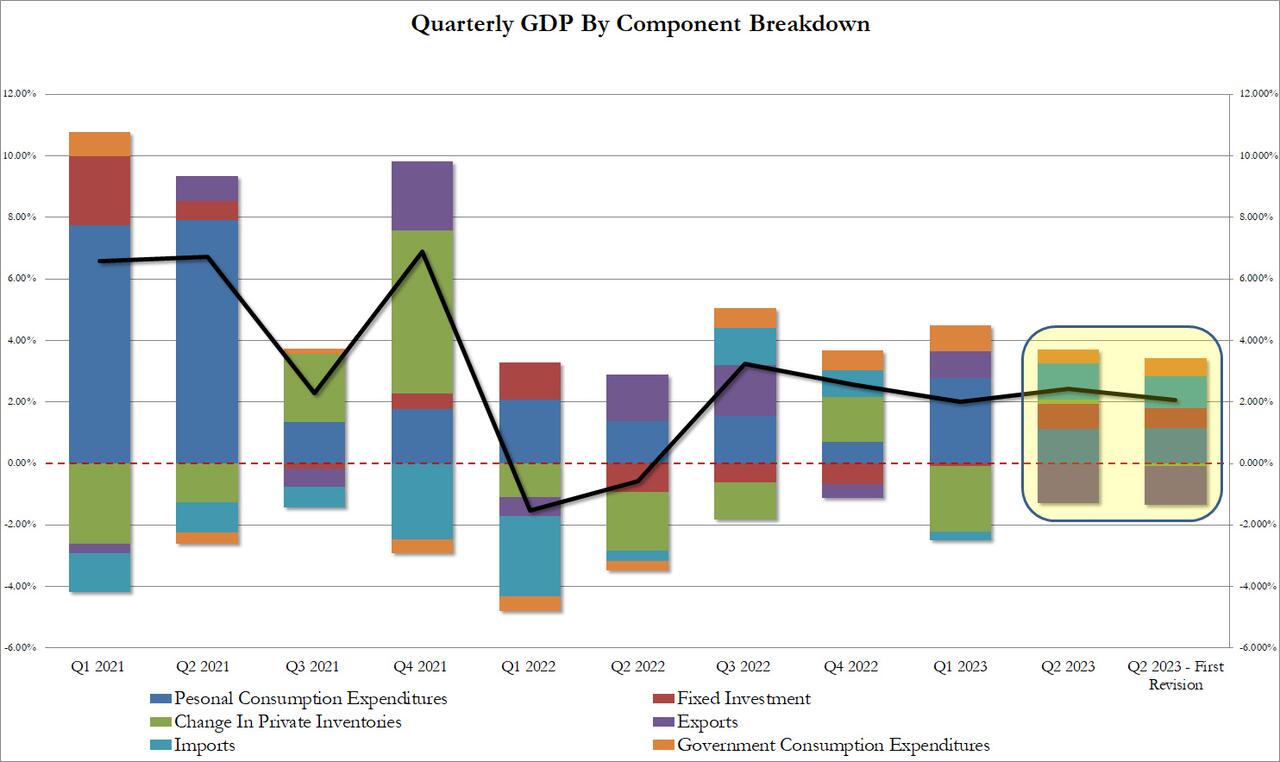
The GDP estimate released today is based on more complete source data than were available for the “advance” estimate issued last month. In the advance estimate, the increase in real GDP was 2.4 percent (refer to “Updates to GDP”). The updated estimates primarily reflecteddownward revisions to private inventory investment and nonresidential fixed investmentthat were partly offset by an upward revision to state and local government spending.
The increase in real GDP reflected increases in consumer spending, nonresidential fixed investment, state and local government spending, and federal government spending that were partly offset by decreases in exports, residential fixed investment, and private inventory investment. Imports, which are a subtraction in the calculation of GDP, decreased.
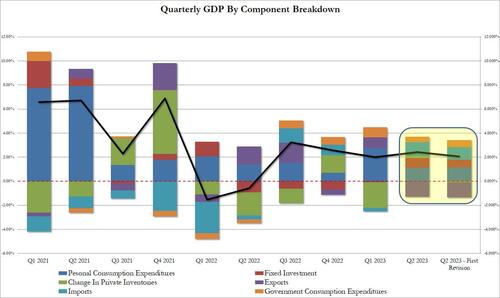
The revision according to the BEA, “reflected a smaller decrease in inventory investment and an acceleration in business investment. These movements were partly offset by a downturn in exports and decelerations in consumer spending and federal government spending. Imports turned down.” In short, everything was uglier,
Taking a closer look at the data, we find the following changes to the bottom line:
Personal consumption added 1.14% to the bottom line print or just over half, up from 1.12% in the original print; annualized this comes out to 1.7% which was below the 1.8% estimate.
Fixed investment contributed 0.66%, down from 0.83%
Change in private inventories now subtracting 0.09% from the bottom line number, a big swing from the positive 0.14% print in the original estimate. And it will be revised even lower next month as more of the “shrink” emerges.
Net exports were also revised lower, with gross exports trimmed from -1.28% to -1.26%, while imports were revised from 1.16% to 1.04%
Finally the ever handy plug that is government consumption (which is a garbage concept since the government does not actually create anything of economic value in the economy but merely allocated graft and embezzlement of public funding), actually rose from 0.45% to 0.58% (of bottom line GDP). Without this revision, Q2 GDP would have printed below 2.0%
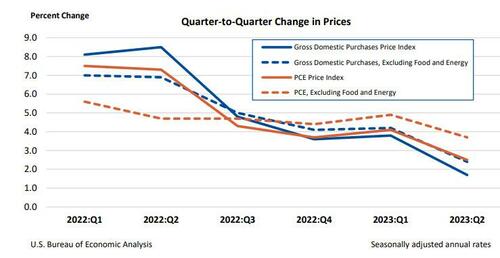
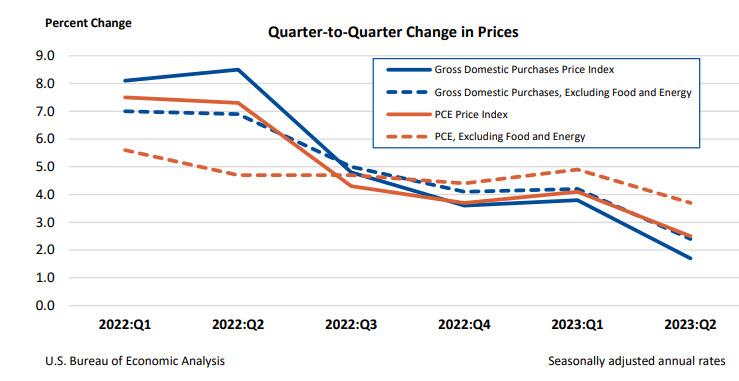
Separately, gross domestic purchases prices, the prices of goods and services purchased by U.S. residents, increased 1.7% in the second quarter after increasing 3.8 percent in the first quarter, above the 1.6% estimate last month but below the consensus 1.8%. Excluding food and energy, prices increased 2.4% after increasing 4.2%.
Personal consumption expenditure (PCE) prices increased 2.5% in the second quarter after increasing 4.1% in the first quarter. Excluding food and energy, the PCE “core” price index increased 3.7% after increasing 4.9%. This number was also revised lower from 3.8% and missed estimates of 3.8%.
Finally, the BEA reported corporate profits decreased 0.4% at a quarterly rate in the second quarter after decreasing 4.1% in the first quarter. Profits of domestic financial corporations decreased 12.1% after decreasing 2.3 percent. Profits of domestic nonfinancial corporations increased 0.9% after decreasing 5.0 percent. Profits from the rest of the world (net)increased 4.4 percent after decreasing 2.0 percent. Corporate profits decreased 6.5 percent in the second quarter from one year ago.
Needless to say, all this is a far cry from the rebound in corporate profits that companies themselves reported in their various GAAP and non-GAAP metrics, which is to be expected in a world where there is now an uncrossable chasm between economic data and its government fabrications.
Then we have M2 Money collapsing, down -3.7% in July. Longest, deepest contraction of money suppy since 1933.
Biden, making Zelenskyy rich again!! The US bought Zelenskyy a new villa! “The document indicates that the villa was purchased by Zelenskyy’s mother-in-law in May 2023. The price of the villa is 150,000,000 Egyptian pounds or approximately $4,850,000.” Thanks Biden!!! America last!
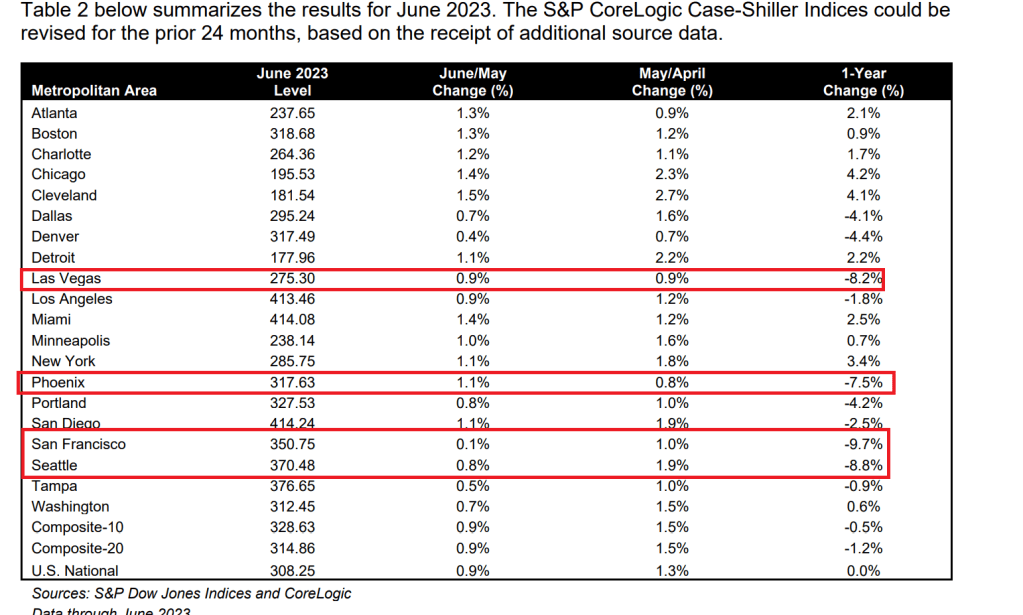
The US housing market is truly bizarro world! San Francisco and Seattle are down near 10% year-over-year (YoY) while Chicago and Cleveland lead in price gains.
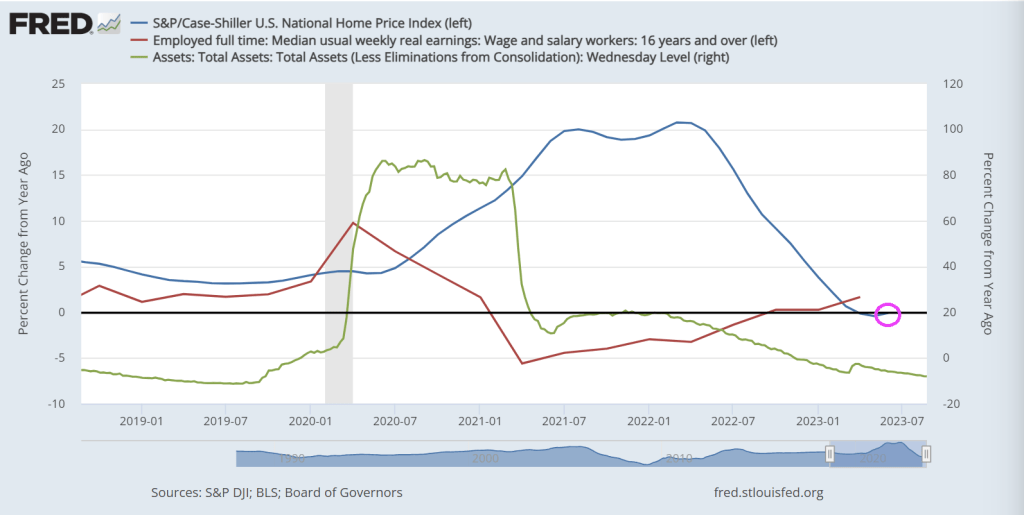
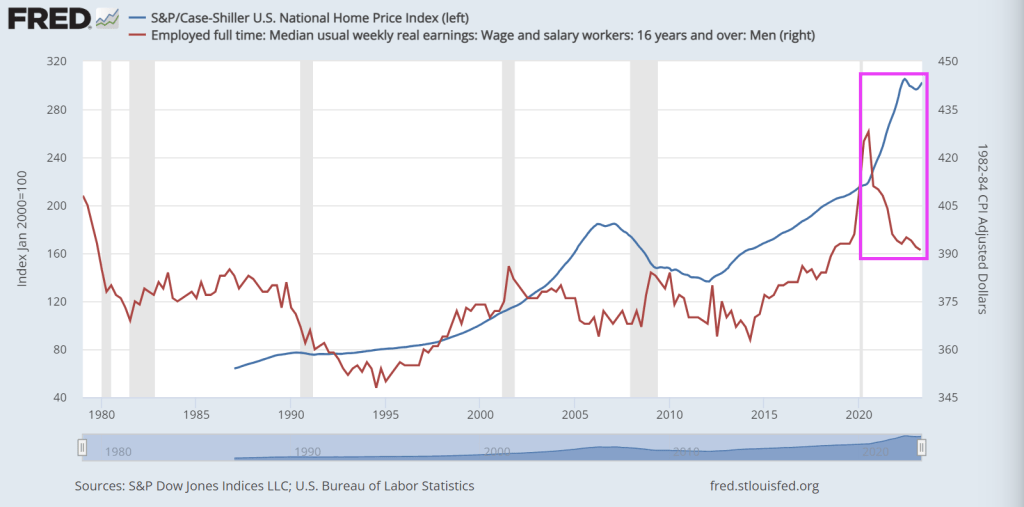
Notice that The Fed’s balance sheet is slowly unwinding (green line) and real weeky “usual” earnings are finally positive after two long years of decline (red line). No growth or loss in home prices at the national level.
How about at the metro level? Chicago, Cleveland, and New York again led the way reporting the highest year-over-year gains among the 20 cities in June. Chicago remained in the top spot with a 4.2% year-over-year price increase, with Cleveland in at number two with a 4.1% increase, and New York held down the third spot with a 3.4% increase. There again was an even split of 10 cities reporting lower prices and those reporting higher prices in the year ending June 2023 versus the year ending May 2023; 13 cities showed price acceleration relative to the previous month.
But The West is where home prices fell and fell hard. The biggest losers were San Francisco (-9.7% YoY) and Seattle (-8.8% YoY). Bubble cities of Phoenix (-7..5% YoY) and Las Vegas (-8.2% YoY) round out the four biggest losers in the nation.
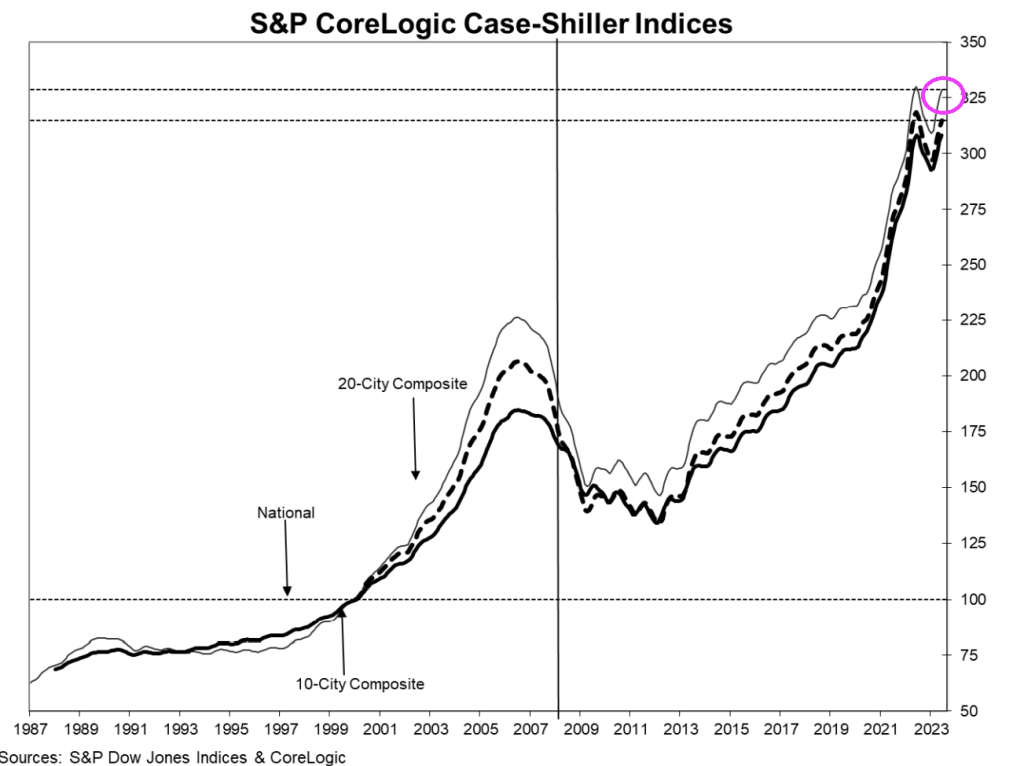
The really interesting chart show the surge in home prices following The Great Recession of 2008 and ensuing financial crisis and post Covid. Of course, the commonality in the surge is the massive expansion of money supply thanks to a hyperactive Federal Reserve.
The puppetmaster of bizarro world? The Federal Reserve!
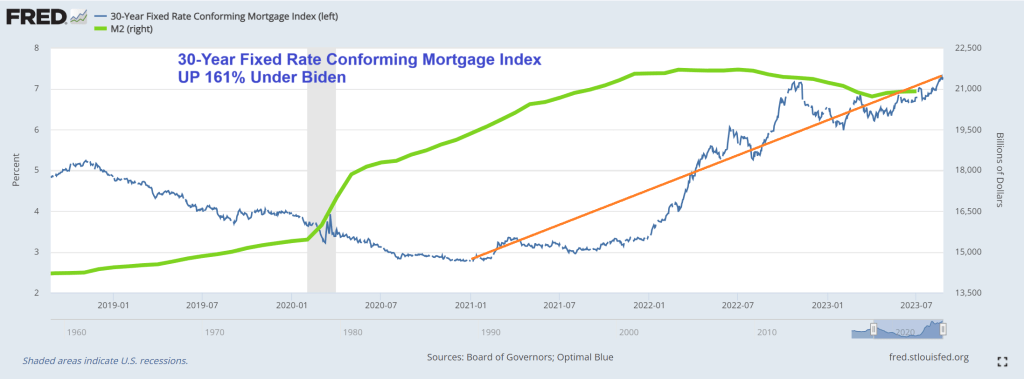
The 30-year conforming mortgage rate is currently 7.23%, up 161% under Biden and Bidenomics (code for massive Federal spending on green initiatives that go to large Democrat donors and Ukrainian oligarchs). Meanwhile, M2 Money supply is up 9.4% under Biden.
At the same time. home prices are UP 26% under Biden while Real Median Weekly Earnings are DOWN -5%.
On a sad note, it looks like The Federal government is starting to rattle its Covid saber just in time for the 2024 Presidential election. Odds are the US will ramp up online voting, early voting, etc. Think of John Fetterman (aka, Walter White’s twin brother) and the Pennsylvania voting experience.
If we look at the Case-Shiller National home price index against real weekly wage growth, you can see the problem clearly. Since Covid and The Fed’s overreaction by providing staggering monetary stimulus, home prices shot up while real median weekly earnings collapsed.
Buying a house requires a much bigger slice of people’s income now — making this the most unaffordable housing market since 1984, by one measure.
And that crushing lack of affordability isn’t expected to improve much in the near future.
At today’s rates, buying a median-priced home would require a monthly principal and interest payment of $2,440 for those making a 20% down payment, according to Black Knight, a mortgage technology and data provider.
That’s $1,172 a month more in mortgage payments from just two years ago, before the Federal Reserve raised its benchmark lending rate 11 times in 18 months, Black Knight found. It’s a 92% increase — and is taking a growing chunk out of household budgets already facing inflation on many fronts.
Currently, 38.6% of the median household income is required to make the monthly payment on the average home purchase, making housing the least affordable it’s been since 1984, according to Black Knight.
“To put today’s affordability levels in perspective, it would take some combination of up to a 28% decline in home prices, a more than 4% reduction in 30-year mortgage rates, or up to a 60% growth in median household incomes to bring home affordability back to its 25-year average,” said Andy Walden, vice president of enterprise research and strategy at Black Knight.
Must as well face it, we’re addicted to gov. Or at least Fed monetary stimulus.
Just look at Personal Interest payments under Bidenomics.
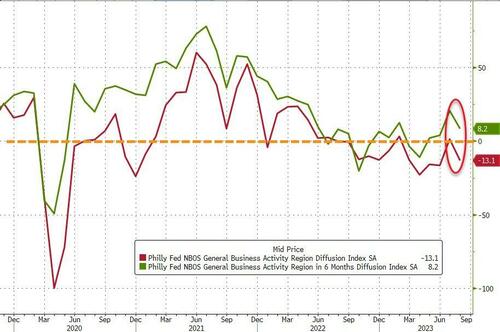
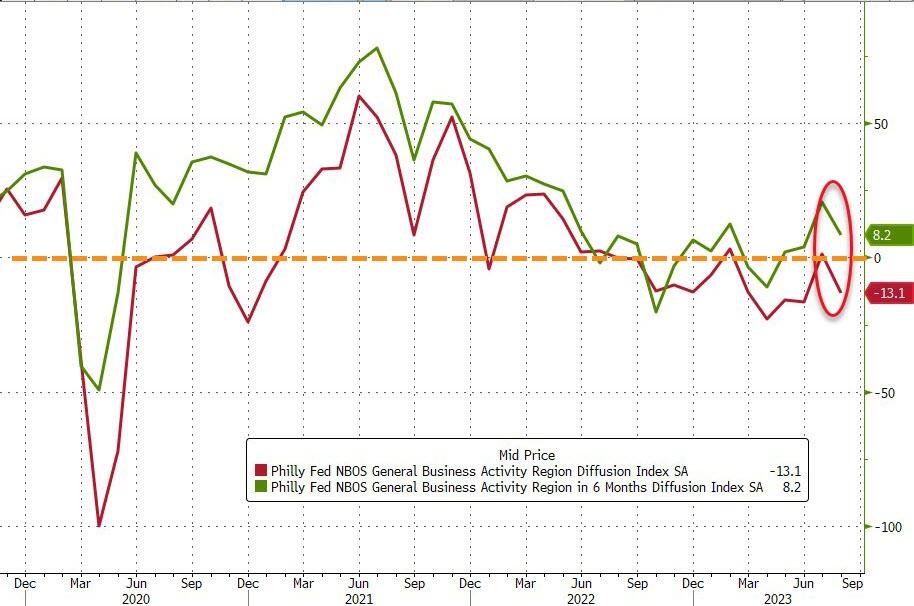
It’s NOT always sunny in Philadelphia. Particularly when the Philly Fed non-manufacturing survey screams stagflation (a nauseating combination of economic slowdown and inflation).
On a non-seasonally-adjusted basis, the Philly Fed Services survey plunged to -20.0 – practically its lowest level since the COVID lockdowns…
Source: Bloomberg
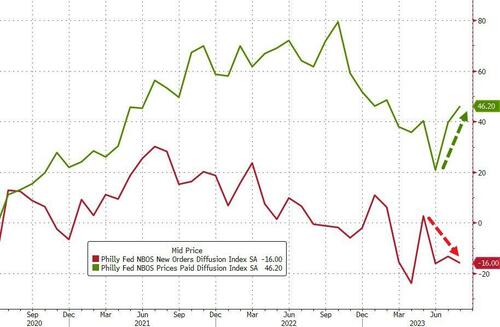
Under the hood it’s even uglier with stagflationary impulses rearing their ugly heads.
Price indicator readings suggest continued increases in prices for inputs and the firms’ own goods and services.
The prices paid index increased 7 points to 46.2 this month. More than 50 percent of the firms reported increases in input prices. Regarding prices for the firms’ own goods and services, the prices received index rose from 7.8 to 14.6.
At the same time the indexes for sales/revenues and new orders both recorded negative readings this month
Source: Bloomberg
Is the ‘Services’ side of the economy finally catching down to the reality of the ‘Manufacturing’ side as savings run dry?
Between The Federal Reserve’s outrageous overreaction to Covid (printing like there was no tomorrow), and Biden’s massive spending spree (lots of moldy (green) spending, we have see horrid inflation.
And The Fed trying (sort of) to combat inflation, we see that 30-year CONFORMING mortgage rate for 80% LTV or lower credit borrowers is up 163.5% under Bidenomics.
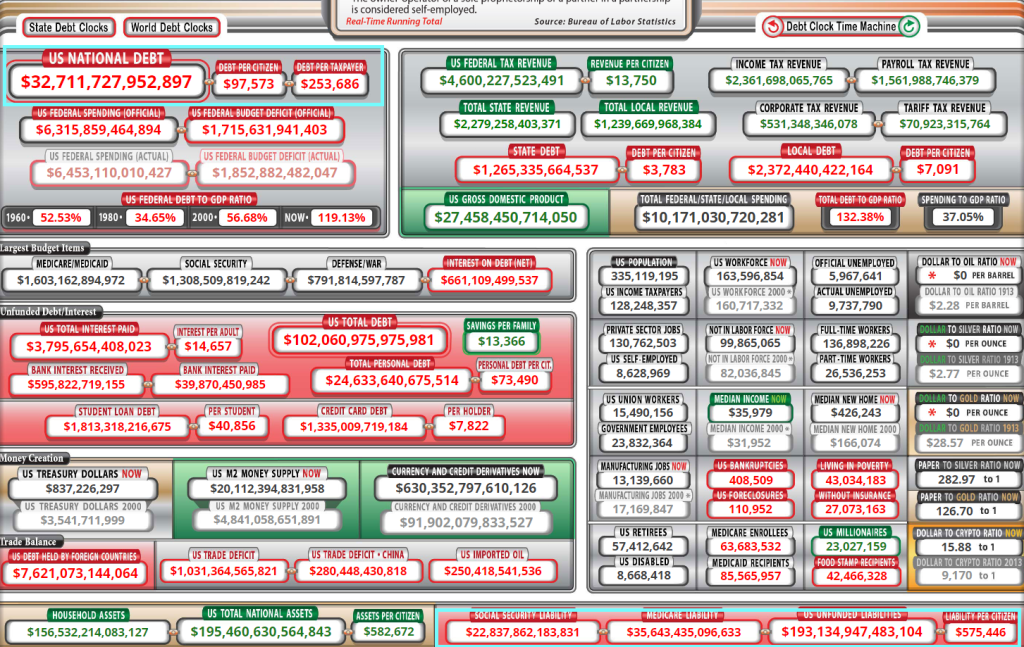
Under Bidenomics, public debt (owed by the US Treasury) is up 19% or greater than $5 triillion. Now wonder Biden throws are billions like it is water.
I seriously want the Biden Administration (and almost every member of Congress) why we are sending billions of dollars to Ukraine while barely giving Maui fire victims barely anything. The US is already $33 trillion in debt with >$193 trillion in unfunded liabilites. I want to ask Biden and Congress HOW the US is going to afford $193 trillion in unfunded liabilites?
Of course, NO ONE wants to face the reality of the disastrous fiscal poliicies of Washington DC politicians. Not McConnell, not McCarthy, not Schumer and especially not Billions Biden. Remember 10% for The Big Guy where Democrats argue that is meaningless. Or mini-me, Robert Reich (Clinton’s labor secretary) who claimed that the US economy is the best he has ever seen! Yes, Reich, for the top 1%. Of couse, no one will ask fools like Reich how we will pay for $33 trillion in debt and the $193 trillion in unfunded liabilies … and fund a war in Ukreiane in seeming perpetuity.
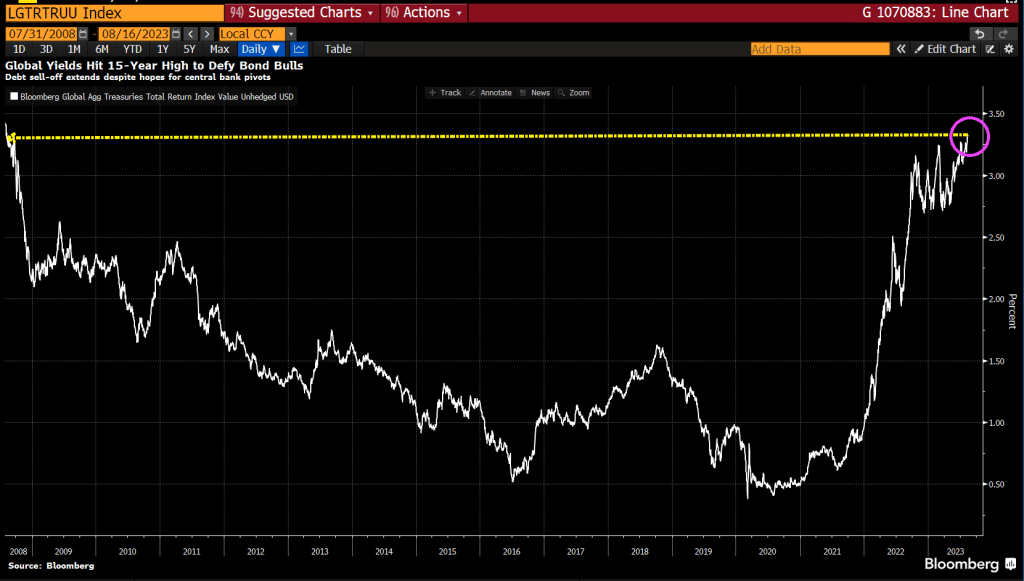
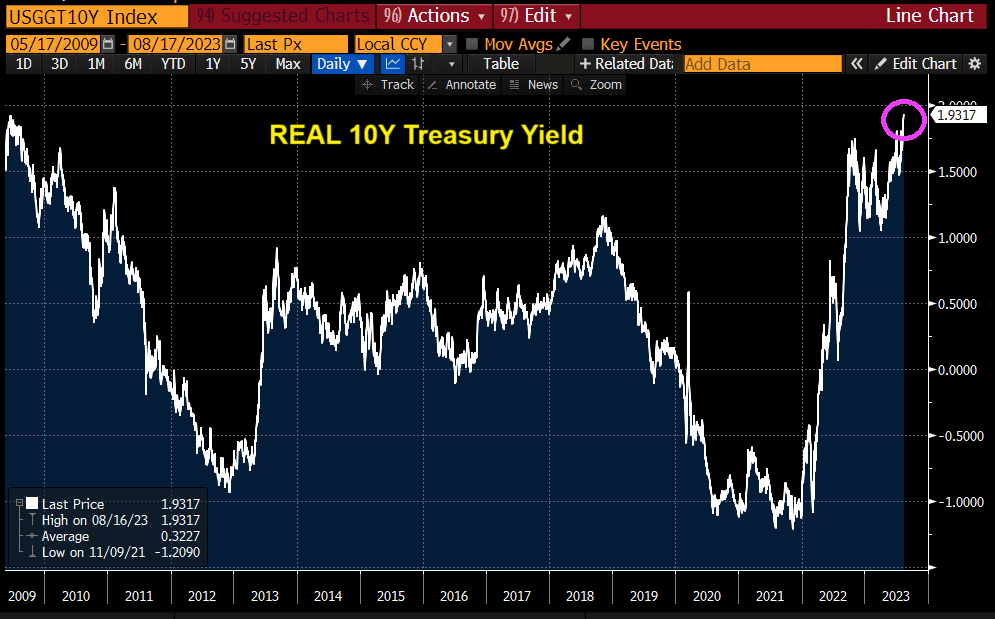
This is very strange. Global Treasury Yields just rose to a 15-year high (2008). This is primarily due to Central Bank moneta
And REAL 10-year Treasury yields also the highest since 2009.
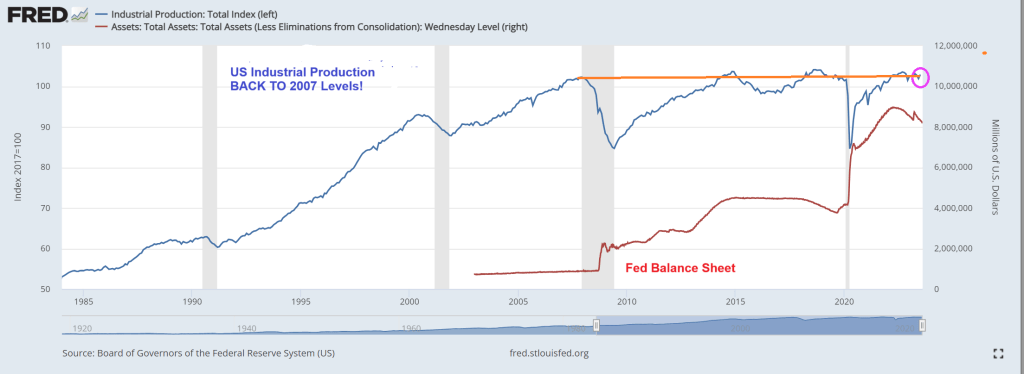
At the same time, US industrial production is at the same level as pre-financial crisis (2007). Despite Federal Reserve monetary stimulypto (remember, The Fed’s balance sheet remains abouve $8 trillion.
This is Obama/Biden/Yellenomics. Trillions of dollars of fiscal (green) stimulus and monetary stimulus only to have industrial production be at the same level BEFORE The Great Recession and financial crisis.
“Ice Cream Joe” Biden is at Lake Tahoe for a week, probably to avoid being asked questions about his tin-ear respoonse to the tragic Maui fires that have killed 106 people so far. Instead, Joe is inappropriately chuckling (showing he doesn’t care!) and taking photo ops of him eating ice cream. The Biden administration angered a lot of people when it was announced that households that have been affected by the fires would only be getting a one time emergency aid payment of $700 while he gives billions for Ukraine.
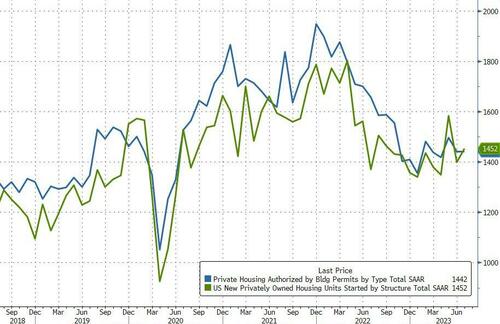
At least housing starts were up 6% year-over-year (YoY).
However, the picture was more mixed with starts rising 3.9% MoM (vs +1.1% exp), but that was impacted by a notable downward revision in June (from -8.0% to -11.7%).Building Permits rose just 0.1% MoM (well below the 1.5% MoM expected).
On a SAAR basis, Permits disappointed (1.442mm vs 1.463mm exp) while Starts were in line at 1.452mm (up from a significantly downwardly-revised 1.398mm in June).
Source: Bloomberg
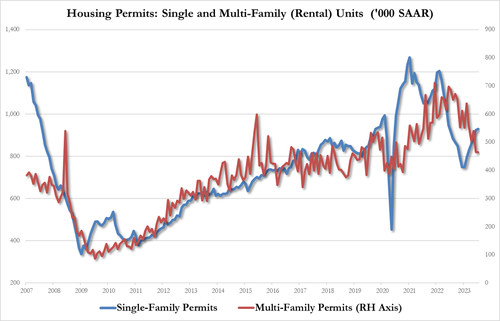
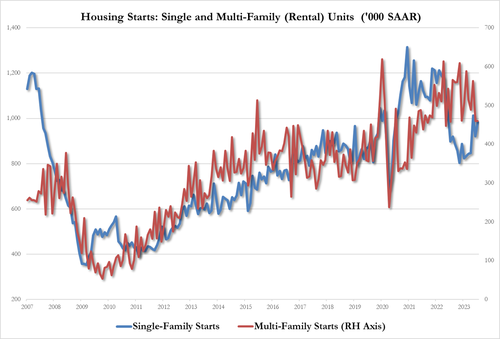
On the Permits side, single-family rose as multi-family fell:
Single-family up to 930K from 924K, highest since June 2022
Multi-family down to 464K from 465K, lowest since Oct 2020
July Housing Starts data followed the same trajectory with rental units growth underperforming single-family:
single-family housing up 6.7% to 983K, up from 921K, highest since May
multi-family housing unch at 460K, tied for lowest since July 2022
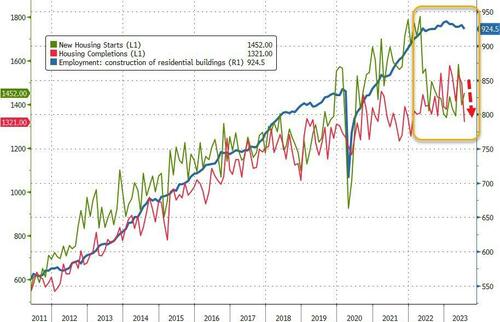
Additionally, we note that while Housing Starts and Completions remain well off their 2022 highs, Construction Jobs remain very close to those highs…
Source: Bloomberg
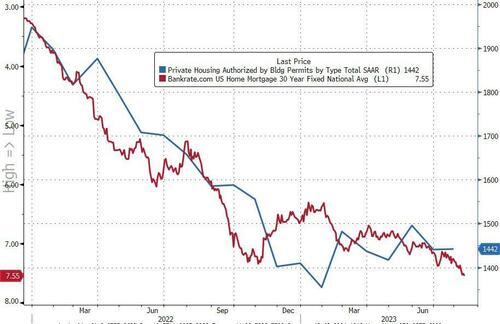
Finally, we note that Mortgage Bankers Association data released earlier this morning showed applications for home purchases dropped again last week (back near 1996 lows) as the contract rate on a 30-year fixed mortgage surged above 7% (highest since Dec 2001).
Source: Bloomberg
This won’t end well.
Speaking of not ending well, mortgage applications decreased 0.8 percent from one week earlier, according to data from the Mortgage Bankers Association’s (MBA) Weekly Mortgage Applications Survey for the week ending August 11, 2023.
The Market Composite Index, a measure of mortgage loan application volume, decreased 0.8 percent on a seasonally adjusted basis from one week earlier. On an unadjusted basis, the Index decreased 2 percent compared with the previous week. The Refinance Index decreased 2 percent from the previous week and was 35 percent lower than the same week one year ago. The seasonally adjusted Purchase Index decreased 0 percent from one week earlier. The unadjusted Purchase Index decreased 2 percent compared with the previous week and was 26 percent lower than the same week one year ago.


You must be logged in to post a comment.