Biden Stew! US $34 Trillion National Debt Is ‘Boiling Frog’ Scenario For Economy (Biden Ignores $213 TRILLION In Unfunded Entitlements)

While ”Angry Joe” Biden screams about democracy (while having his attorney general prosecute his likely Presidential election opponent), and he and Congress continue to spend and borrow like there is no tomorrow (not a bad assumption since Biden is a sickly 81, Pelosi is 83 and assorted other aging policitians in the District of Corruption will never live beyond 10 more years), we are now seeing more attention to the boiling frog problem facing our children and grandchildren. I call this “Biden Stew.”

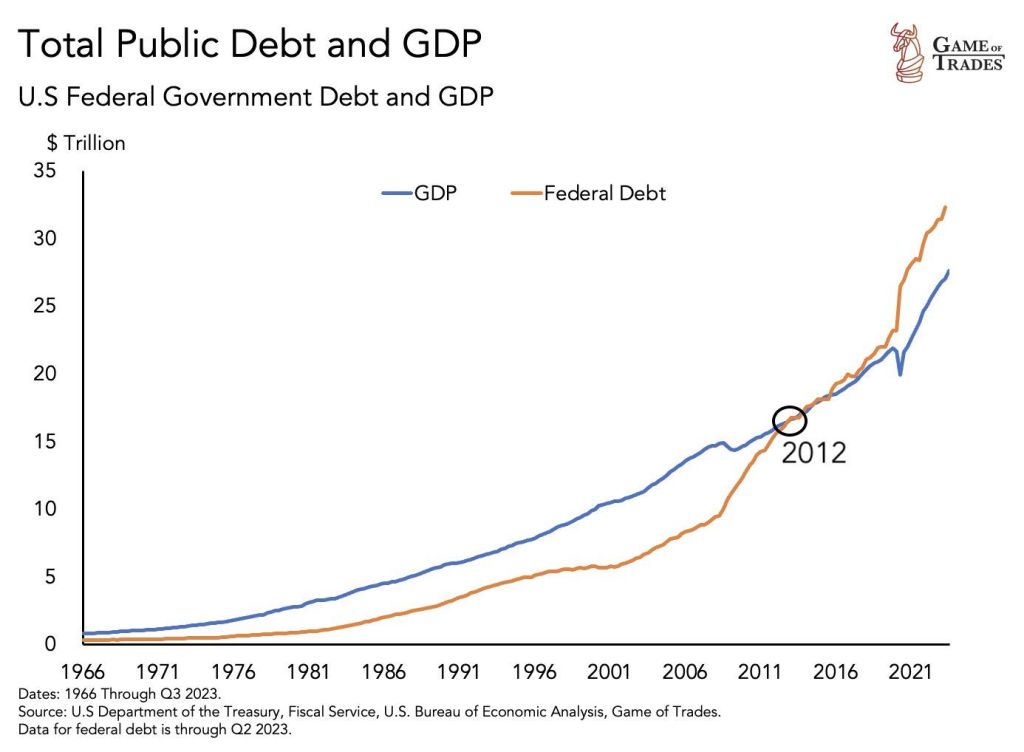
The country’s soaring national debt — which recently surpassed a record-high $34 trillion — is akin to a “boiling frog” for the economy and Wall Street investors, a senior analyst at JPMorgan Chase warned.

Michael Cembalest, who runs JPMorgan’s market and investment strategy unit in the bank’s asset management division, predicted dire consequences for the economy if the Biden administration doesn’t start tackling the debt.

Cembalest wrote in a newsletter published last week by JPMorgan that the country cannot sustain higher deficits and ballooning net interest payments, which are soon expected to exceed the federal government’s total revenue by early next decade.

“The problem for the US is the starting point; every round of fiscal stimulus brings the US one step closer to debt unsustainability,” Cembalest wrote in the newsletter titled “Pillow Talk.”

“However, we’re accustomed to deteriorating US government finances with limited consequences for investors, and one day that may change (the boiling frog analogy).”

The “boiling frog” concept comes from a metaphor used to describe a situation whereby an undesirable set of circumstances is tolerated for an extended period of time — such as a frog that is thrown into water that is gradually heated.

Once the circumstances become too dire — and the water is heated to a boil — it is too late for the frog to act and it is cooked alive.

Cembalest predicted that by early next decade, “all Federal government revenues will be consumed by entitlement payments and interest on the Federal debt.”

“Entitlement payments” refer to Medicaid, Medicare, Social Security, unemployment insurance and other aspects of the federal welfare safety net.

Cembalest wrote that before the next decade he anticipates that “a combination of market pressure and rating agency downgrades” will “force the US to make substantial changes to taxes and entitlements.”

In November, Moody’s lowered the US government’s credit ratings outlook from “stable” to “negative.”

Last summer, Fitch Rating downgraded the federal government’s long-term credit rating from AAA to AA+.

The national debt, which is the total amount of outstanding borrowing by the federal government, stood at $34.006 trillion as of Mondayaccording to the Treasury Department’s official debt tracker. And growing REALLY fast!!

While Biden pushes for MORE Ukraine war funding and cancelling student debt (like a demonic Daddy Warbucks from Little Orphan Annie), he ignores unfunded entitlements of $213 TRILLION.

To be sure, the Biden Stew has been a trainwreck for decades, but Biden has the golden opportunity to act like a leader instead of “Angry Joe” screaming about Democracy as he and his minions attempt to cancel their politicial opponents.

It doesn’t help that The Federal Reserve Board of Governors seems like the cast of the ice hockey flick “Slap Shot.”

The Thrill Is Gone? Large Bank Loan Volumes Continue To Shrink Despite Deposit Growth (M2 Money Growth NEGATIVE For All Last Year!)

Yes, BB King was right … about banking. “The Thrill Is Gone” from bank lending,

I observed yesterday that bank credit growth has been negative for the past year. The entire year!

On the bank deposit front, after losing more than a trillion dollars in deposits in 2023 – and seeing usage of The Fed’s emergency funding facility soar to a record high yesterday – total bank deposits rose by $24.2BN in the week-ending 12/27/23 (on a seasonally-adjusted basis) – that is the 4th straight week of deposit inflows…

Source: Bloomberg

On a non-seasonally-adjusted basis, deposits rose almost in line, up $20.3BN (the fifth week of inflows in a row)…

Source: Bloomberg

Interestingly the sizable deposit inflows are occurring alongside sizable money-market fund inflows…

Source: Bloomberg

…now we know where all that reverse repo liquidation cash is going…

Source: Bloomberg

Excluding foreign bank flows, the picture is even rosier with domestic bank deposit inflows of $33.8BN (SA) and $38.7BN (NSA) – the 5th week in a row of NSA inflows…

Source: Bloomberg

While it may surprise some, on an NSA basis, domestic bank deposits are now back above pre-SVB levels…

Source: Bloomberg

Large banks saw $24BN inflows last week and Small Banks $9.4BN (on an SA basis) and for the 5th week in a row both large and small banks saw NSA inflows (+$30BN and +$8.7BN respectively)…

Source: Bloomberg

On the other side of the ledger, loan volumes continued to shrink (despite the deposit growth). Large bank loan volumes fell $8.2BN (the 4th week of falling loan volumes in a row)…

Source: Bloomberg

Which leave us continuing to highlight the fact that there is potential trouble brewing still as the key warning sign continues to flash red (Small Banks’ reserve constraint – blue line), supported above the critical level by The Fed’s emergency funds (for now)…

Source: Bloomberg

As the red line shows, without The Fed’s help, the crisis is back (and large bank cash needs a home – green line – like picking up a small bank from the FDIC).

All of which keep us wondering, are we setting up for another banking crisis in March as:

1) BTFP runs out…

It was only a 12 month temporary program, and it is going to be hard for The Fed to keep it alive.
The BTFP-Fed Arb continues to offer ‘free-money’ 
(and usage of the BTFP has risen by $32BN since the arb existed), but the spread has narrowed a smidge from a peak near 60bps to 50bps today…

Source: Bloomberg

Which will make it hard for The Fed to defend leaving the facility open after March when its “temporary” nature is supposed to expire.

“In justifying the generous terms of the original program, the Fed cited the ‘unusual and exigent’ market conditions facing the banking industry following last spring’s deposit runs,” Wrightson ICAP economist Lou Crandall wrote in a note to clients.

“It would be difficult to defend a renewal in today’s more normal environment.”

2) RRP drains to zero…

…at which point reserves get yanked which means huge deposits flight.

Source: Bloomberg

Is this the real reason why The Fed ‘pivoted’? It knows what’s coming??

Perhaps we should look at The Fed’s little beige book.

The problem is that The Fed doesn’t know what 7 plus 7 equals. Other than asset bubbles.

Running On Empty? The Free Money Has Run Out (M2 Money Growth Has Been Negative For The Past Year!)

Jackson Browne said it best. The US economy is “running on empty.”

M2 Money growth is negative. And M2 Money growth has been negative for the last year.

The third and largest round of fiscal stimulus was in March of 2021. That’s when Biden’s popularity peaked at 55.1 percent.

Base image from 588 Biden Approval Ratings.

Why Biden’s Approval Rating Is Miserable

Income is rising and so are wages. Even real income is up. But real wages are another matter.

Personal income data from the BEA, hourly wages from the BLS, real hourly earnings and chart by Mish.

Personal Income vs Hourly Wages Notes

  • DPI means Disposable Personal Income. Disposable means after taxes.
  • Real DPI means inflation adjusted using the Personal Consumption Expenditures (PCE) deflator. Real DPI is a BEA calculation.
  • Average hourly earning are for production and nonsupervisory workers.
  • Real wages are deflated by the Consumer Price Index (CPI) not the PCE.
  • The BLS does not report a real hourly wage. I used the CPI-W index for production and nonsupervisory workers, produced by the BLS, as the deflator.

Personal Income Definition

The BEA defines personal income as “Income that people get from wages and salaries, Social Security and other government benefits, dividends and interest, business ownership, and other sources.” 

Rental income is a part of other sources.

Three Rounds of Fiscal Stimulus

  • Round 1, March 2020: $1,200 per income tax filer, $500 per child(CARES Act) – Trump
  • Round 2, December 2020: $600 per income tax filer, $600 per child (Consolidated Appropriations Act, 2021) – Trump
  • Round 3, March 2021: $1,400 per income tax filer, $1,400 per child (American Rescue Plan Act) – Biden

The three rounds of free money fiscal stimulus (literally a helicopter drop), plus eviction moratoriums put an unprecedented amount of money in people’s hands. In addition, unemployment insurance paid people more to not work than they received working.

The third round of stimulus under Biden was totally unwarranted. However, it is also worth noting that Trump wanted a much bigger second stimulus package than the Republican Congress gave him. Trump is no fiscal hero.

For more discussion, please see Why Biden’s Approval Rating Is Miserable in One Economic Chart

The three stimulus packages, on top of supply chain disruptions, energy disruptions due to the war in Ukraine, and Bidenomics in general, set in motion the biggest wave of inflation in over 30 years.

Biden went from an approval rating of 17.2 percent to a disapproval rating of 17.2 percent.

Peak Free Money

In addition to declining real wages, perhaps Biden’s big problem is the free money has run out.

Biden’s popularity peaked in March of 2021 along with stimulus. Was that a honeymoon impact or peak free money?

[ZH: While not a perfect indicator, the lagged US credit impulse perhaps provides a proxy for US fiscal excess and when overlaid with Biden’s approval rating, it is clear that 2022’s re-acceleration did nothing for people’s faith in him… and it’s only got worse…]

I suspect a bit of each coupled with hope of more free money, especially student loan forgiveness.

Sending free money to Israel and Ukraine does not help perceptions of how Biden is doing. And neither does the border or ridiculous energy regulations that cost people money.

Biden keeps telling people what a great job he has done.

I don’t believe it and most don’t either. And that shows up in the polls no matter what reason you assign.

Can Biden scrounge up some more stimulus? Because the private sector is not doing well under “Open Borders Biden.”

Bidenomics Housing Market: Average US Household Can Afford Only Cheapest 16% Of Listed Homes (WORST Housing Affordability In History!)

Some content on this page was disabled on May 23, 2024 as a result of a DMCA takedown notice from Adtech lt, UAB. You can learn more about the DMCA here:

https://wordpress.com/support/copyright-and-the-dmca/

US Fiscal Inferno! US Government Debt Now Bigger Than US Economy, But Unfunded Liabilities (Promises) Are $632k Per Citizen (As California’s Governor Newsom Gives Away Free Healthcare To Illegal Immigrants)

Yes, the US is engulfed in a fiscal inferno!

US government debt is now bigger than the US economy. This was unseen until 2012 when debt surpassed GDP for the first time.

In addition to almost $34 trillion in debt from our crazy spending, out-of-control government, we are on the hook for almost $213 TRILLION in unfunded liabilites (promises made to Americans that will likely not be honored).

The sad thing about the US Debt Clock summary is the $632,195 share per citizen of unfunded liabilties. That raises two questions. First, how can California’s Ken doll Governor Gavin “Greasy” Newsom give away free healthcare to ALL illegal immigrants? Second, since the invasion of illegal immigrants began under Biden/Mayorkas, will they be on the hook for the unfunded liabilities which they disordinately consume? Not likely. Maybe we should charge each illegal immigrant $632k admission fee.

California’s Ken doll Governor and fiscal imbecile Gavin Newsom.

Bidenomics In One Chart! Top 1% (Donor Class) Have More Wealth Than Middle Class

Bidenomics is the pride of the donor class.

After all, much of the Federal spending splurge in green energy has gone to big donors, including the Chinese.

The top 1% of US earners now have more wealth than the middle class.

Biden’s song. All he wanted to do was destroy the US middle class. And The Fed’s snakejuice flows to the 1%.

Hey Joe! SOFR Suddenly Soars To Record High As Key Funding Spread Hints At Imminent Liquidity Crunch

Hey Joe (BIDEN)! Please stop destroying the economy!! (Here is my favorite version by Jim Pons and The Leaves!). The most lame version? The Byrds and David Crosby.

Over a month ago (and well before the Fed’s “shocking” dovish pivot) as the Fed’s Overnight Reverse Repo tumbled below $900 billion for the first time since June 2021 amid a growing debate of where and when the Fed’s reserve scarcity constraint will be hit, we warned that liquidity is rapidly approaching the reverse repo constraint level which could emerge as soon as the RRP facility dropped to $700 billion, at which point the market’s all-important credit plumbing will start to crack.

We didn’t have long to wait because just a few days later, on December 1 (just after the customary month-end window dressing period) when reverse repo tumbled to a fresh multi-year low of $765 billion…

… things indeed broke as we explained in “Sudden Spike In SOFR Hints At Mounting Reserve Shortage, Early Restart Of QE” (in which we correctly previewed the coming Fed pivot at a time when most were still dead certain that Powell would only care about inflation for months to come): that’s when the the all-important SOFR rate (i.e., the new Libor) unexpectedly jumped 6bps to 5.39%, the highest on record…

… also resulting in the largest SOFR spike vs ON RRP since Jan ’21, which hit 6bps.

The spike caught almost everyone by surprise, even such Fed-watching luminaries as BofA’s Marc Cabana because it was with “no new UST settlements, lower repo volumes, and lower sponsored bi-lateral volumes.”  More ominously, and confirming our take from three weeks ago, Cabana warned at the time (full note here) that “the move is consistent with the slow theme of less cash & more collateral in the system” – i.e., growing reserve scarcity –  and “may have been exacerbated by elevated dealer inventories, bi-lateral borrowing need, and limited excess cash to backstop repo. If funding pressure persists, it risks Fed re-assessment of ample banking system reserves & potential early end to QT.”

Then, the mini liquidity crisis disappeared almost as fast as it emerged, as SOFR rates eased off and the SOFR-Fed Funds spread normalized once GSE cash entered the market as it does every month….

… until today when not only did SOFR hit a new record high, ironically at a time when the market is pricing in more than 6 rate cuts in 2024…

… but the spread between the SOFR and the effective Fed Funds rate just spiked to the highest level since the March 2020 repo crisis…

.. with a similar move also observed in the spread between SOFR rate and the O/N Reverse Repo which similarly blew out to the widest since the start of 2021.

While there was no specific catalyst behind the sudden spike, two factors are the likely culprits: the year-end liquidity crunch, and the recent sharp increase in the Fed’s reverse repo facility, which has increased from a multi-year low of $683 billion on Dec 15 to yesterday’s $830 billion, and which STIR strategists expect will shoot up above $1 trillion in today’s final for 2023 reverse repo operation as a whopping $300+ billion in short-term liquidity in pulled from markets in just days.

That’s the bad news.

The good news is that come 2024 in a few hours, and specifically the first day of trading on Jan 2, we expect the reverse repo facility to plummet back to $700 billion once the year-end window dressing is over (especially with total US debt rising above $34 trillion to start the year), and floods the system with fresh liquidity which will stabilize the monetary plumbing at least until reverse repo dips below that key level of $700 billion at which point we expect the SOFR spikes to become a daily occurrence, and one which the Fed will no longer be able to ignore.

Indeed, one can already see traces of this in the repo market, where the rate on overnight GC repo first surged to 5.625% at the open on the final trading day of December before dropping to 5.45%, according to ICAP. It has since climbed back to 5.50%. But that’s still lower than where repo rates for Dec. 29 were trading during the prior session, as markets now start frontrunning the coming reverse repo liquidity flood.

Of course, once reverse repo eventually tumbles to $0 some time in March, all bets are off and the narrative shift to the next QE will begin.

“Say, can I sniff you if you take Trump off of Maine’s Presidential ballot??”

More Bidenomics! Bank Bailout Fund Usage Soars To Another Record High As Fed Losses Exceed $130 Billion

Nobody but Biden could so handicap an economy with horrible fiscal policies, massive debt, inflation and open borders. And then go to the Virgin Islands for yet another taxpayer paid vacation. Biden has spent 40% of his Presidency on vacations.

Bidenomics is a disaster for the US middle class. And Bidenomics with its inflation has led The Fed to counterattack and raises interest rates, leading to losses for The Federal Reserve (which is paid for by US Treasury) of over $130 billion.

The Fed’s balance sheet shrank by $11.3BN last week to its lowest level since March 2021, but still remains elevated.

Source: Bloomberg

Usage of The Fed’s bank bailout facility rose by another $4.5BN last week to a new record high of $136BN…

Source: Bloomberg

The BTFP-Fed Arb continues to offer ‘free-money’ (and usage of the BTFP has risen by $26.7BN since the arb existed):

The rate on the Fed’s Bank Term Funding Program – which allows banks and credit unions to borrow funds for up to one year, pledging US Treasuries and agency debt as collateral valued at par – is the one-year overnight index swap rate plus 10 basis points.

That figure is currently 4.83%, down from 5.59% in September.

For institutions that have an account at the Fed, they can borrow from the BTFP at 4.83% and park that at the central bank to earn 5.40% – the interest on reserve balances.

Source: Bloomberg

The 57bp spread is the widest level since the Fed introduced the facility to support a struggling banking system after the collapse of California’s Silicon Valley Bank and Signature Bank in New York.

https://www.zerohedge.com/markets/2023-sees-greatest-annual-money-market-inflows-ever

Nobody but Biden!

Alarm! US Pending Home Sales Index Sink To New Record Low In November, Down -5% YoY

Alarm! With rampant inflation, The Federal Reserve has raised rates to tame inflation. And with the rate increases, US pending home sales have fallen -5% since last year.

With new home sales plummeting (playing catch-down to reality) and existing home sales bouncing very modestly off record lows (SAAR), pending home sales were expected to rise modestly MoM in November (+0.9%). However, Pending Home Sales missed expectations, unchanged in November (from an upwardly revised October decline of -1.2% MoM).

That left Pending Home Sales Index still down over 5% YoY…

Source: Bloomberg

That leaves the Pending Home Sales Index at a new record low…

Source: Bloomberg

The index of contract signings for existing homes declined in the South, the biggest US housing market, to the lowest level on record.

Pending sales climbed in the other three regions.

The trend in pending home sales appears to tracking mortgage rates (with about a one-month lag), suggesting things may be about to pick up more solidly in the next few months…

Source: Bloomberg

“Although declining mortgage rates did not induce more homebuyers to submit formal contracts in November, it has sparked a surge in interest, as evidenced by a higher number of lockbox openings,” Lawrence Yun, NAR’s chief economist, said in a statement.

“With mortgage rates falling further in December – leading to savings of around $300 per month from the recent cyclical peak in rates – home sales will improve in 2024,” Yun said.

Optimism – from a realtor – whoever would have thought!?

The Banks Are Not Alright! Banks Continue To Lose Deposits (21 Straight Weeks Of Negative Bank Credit Growth)

While The Who Sang “The Kid’s Are Alright” ,the same can’t be said of banks.

It has been nine months since the spectacular and sudden collapse of Silicon Valley Bank.

After witnessing three of the four largest bank failures in U.S. history in 2023, the attention of the media and the markets has turned elsewhere. Banking crisis? It is as though it never happened. Having fallen by some 40 percent in March, the NASDAQ Bank Index has recovered to within 15 percent of its high from February. In the last few months, nearly all markets have gone on a bull run, including bank stocks.

Yet, and despite the relative quiet, the banking sector is not in great shape. Here are some of the reasons why.

Banks continue to lose deposits. According to data from the Federal Deposit Insurance. Corp. (FDIC), U.S. banks have now lost deposits for six consecutive quarters. While the pace has slowed from the first quarter of 2023, in which nearly $500 billion of deposits were removed from the banking system, approximately $190 billion of deposits have been withdrawn in the last two quarters. Indeed, U.S. banks have lost a net $1.1 trillion of deposits since the beginning of 2022 when interest rates began to rise.

With customer deposits growing scarce, U.S. banks are instead relying on emergency funding lines from the Federal Reserve Banks and the Federal Home Loan Bank (FHLB) system. FHLB bond capital raising, of which the proceeds are used to fund the banks, is up 89 percent year over year through November and looks set to reach $1.1 trillion for 2023. Use of the Bank Term Funding Program, the emergency line put in place by the Fed in March 2023, reached an all-time high last week at $131.3 billion.

This does not reflect normal market operations.

This is a sign that the bank funding markets aren’t operating properly, and that the regulators are stepping in to help prop up the system.

The growing gap between the rate on the Federal Reserve’s nascent funding facility and what the central bank pays institutions parking reserves suggests officials will let the program expire in March, according to Wrightson ICAP.

“In justifying the generous terms of the original program, the Fed cited the ‘unusual and exigent’ market conditions facing the banking industry following last spring’s deposit runs,” Wrightson ICAP economist Lou Crandall wrote in a note to clients.

“It would be difficult to defend a renewal in today’s more normal environment.”

What happens then?]

So much for the liabilities side. But banks face challenges on the asset side as well.

Unrealized losses on investment securities, which is the same problem that got SVB into trouble a year ago, continue to rise. U.S. banks reported unrealized losses of over $684 billion in the third quarter, up 22 percent from the second quarter. Of these unrealized losses on securities, $294 billion are categorized as available for sale (AFS), as opposed to held to maturity (HTM), whereby the bank intends to hold the asset and (hopefully) recapture principle at the end of the term. The high amount of AFS suggests that if interest rates remain “higher for longer,” then a portion of these losses will begin to realize in 2024 as they are sold by the banks. This will pressure profitability and capital levels.

Net income is declining across the banking system generally, but particularly among the smaller community banks. Credit quality is deteriorating, but has not yet reached crisis level. Commercial real estate continues to drive the increase in problem loans.

To grow (or at least slow the decline) of deposits, banks are going to have offer rates that are somewhat competitive with money market funds (considering that bank deposits are insured by the FDIC and thus relatively safe), and that offer positive real (i.e., after inflation) returns. With inflation persisting in the range of 3–4 percent, this means that banks will have to offer 4–5 percent to be relevant. This isn’t going to work for the banks. They won’t be able to maintain profitability. And it won’t work for the U.S. Treasury, which itself is committed to trillion-dollar bond issuances each quarter, which also must offer a positive interest rate above investor perceptions of inflation and the deteriorating fiscal condition of the U.S. government.

If funding costs rise further, or if unrealized losses begin to realize, banks will start taking hits to their capital levels. This will spook the markets, including depositors, and we may find ourselves in round two of deposit runs. To head off these challenges, some banks are looking to merge. There have been 78 bank deals announced in the second half of 2023, mostly among the smaller and community banks. But this won’t work in many situations where the result is the proverbial “two drunks holding each other up.”

Investor optimism is permeating markets going into year-end, with most all asset classes continuing to rise. But we must not lose sight of the banks. They are not out of the woods yet. While there is a “goldilocks” scenario in which the banking sector makes a soft landing, the risk of another set of bank failures in 2024 remains meaningful.

And we have 21 straight weeks of negative growth in bank credit. And The Fed still has a staggering amount of financial stimulus outstanding.

With all hell breaking loose around the world, President Biden has gone on yet another vacation, this time to the Virgin Islands to stay at the home of a big donor. But his handlers run things, not Vacation Joe.