Inversion Therapy? Yield Curve Continues Inversion As Fed Slows Down Treasury Purchases (Mortgage Rates Climb To 4.91%) Biden Orders Autos Have 49 MPG By 2026

Its official! I submitted my resignation from George Mason University effective June 1, 2022. I will miss teaching the students, past and present.

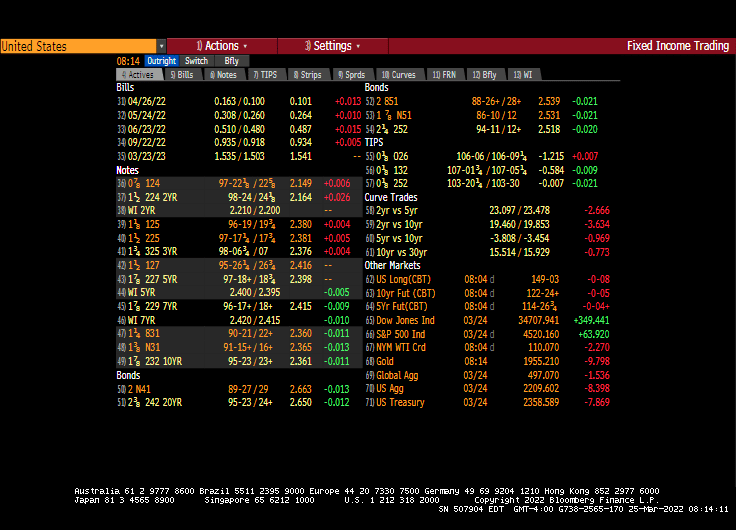
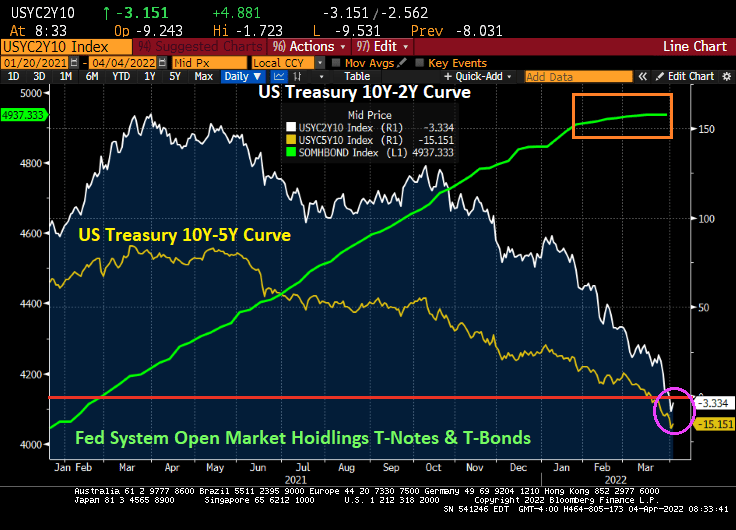
But back to the US Treasury yield curve. It remains in reversion (meaning shorter-term Treasuries have higher yields than longer-term Treasuries, usually a sign of impending recession. The Fed has actually started quantitative tightening (QT) and the growth rate of Treasury note and bond purchases has slowed to a crawl.
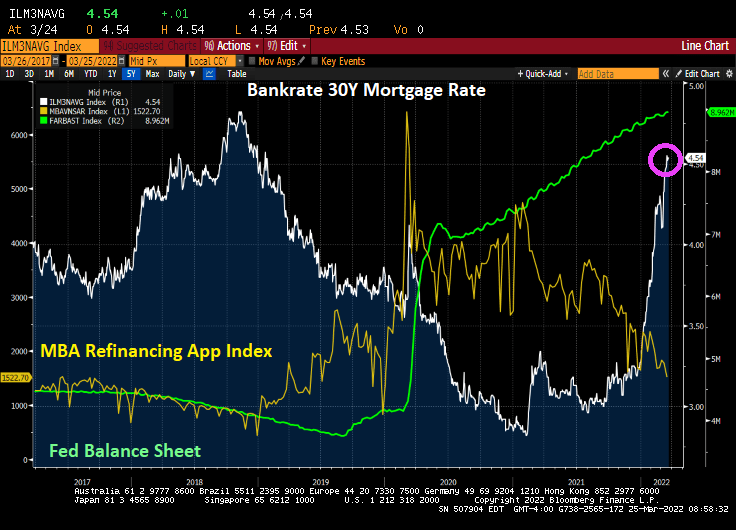
Meanwhile, Bankrate’s 30-year mortgage rate rose slightly to 4.91%.

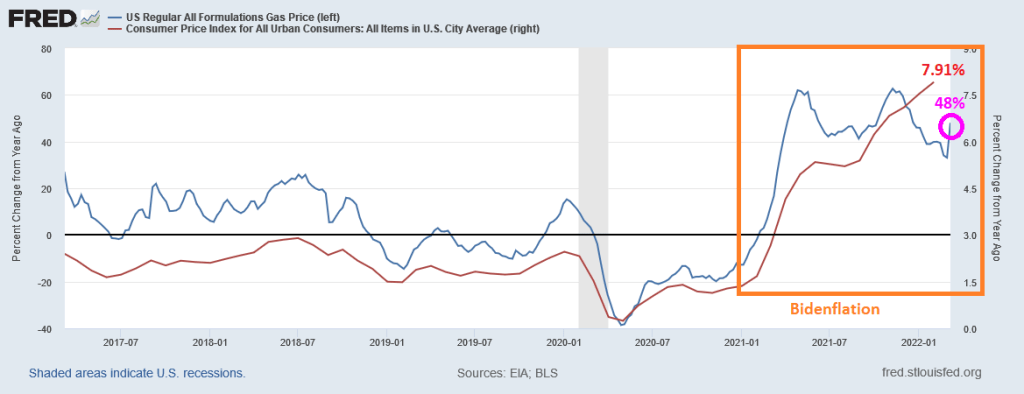
Meanwhile, President Joe “The Big Guy” Biden has ordered carmakers to increase their average fuel economy to about 49 miles (78.8 kilometers) per gallon by 2026. Of course, this is intended to kill-off gasoline-powered autos and make all cars electric or hybrid like the Toyota Prius.

According to Kelley Blue Book, the average transaction price for an electric vehicle in April 2021 was $51,532. That’s more than $11,000 higher than what you’d pay at the dealership for a full-size gas-powered car, and nearly $30,000 more than the average compact car sale.

This can be the Democrat’s midterm election slogan: “Making living in the USA unaffordable!”

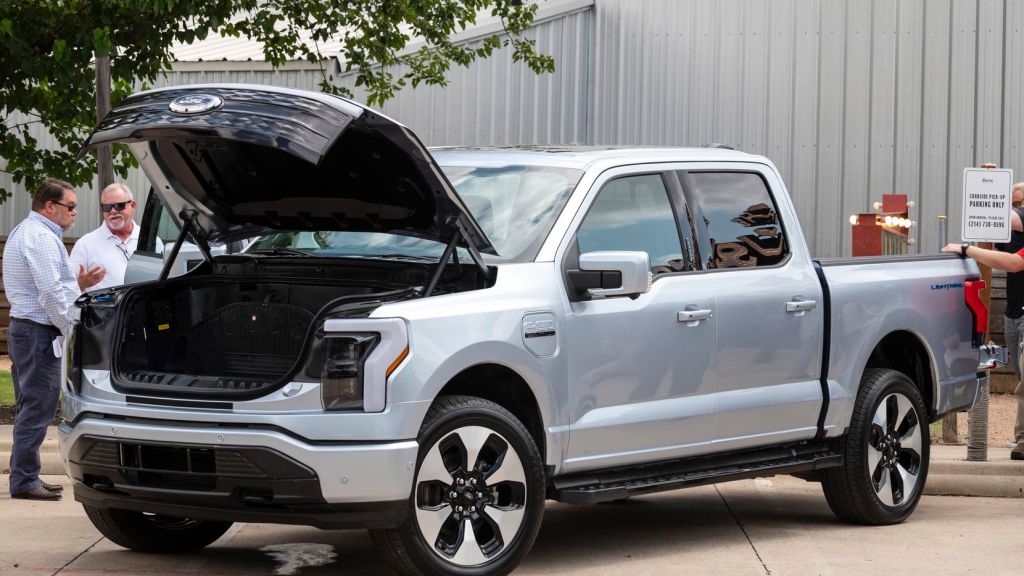
The middle-class unaffordable Ford F-150 Lightning at nearly $100,000. Thanks Joe!
Alternatively, you can buy a Buick Envision (made only in Shanghai China) with up to 24 city / 31 highway MPG. Well, kiss that baby goodbye under Biden’s new MPG mandate.

Zoltan! US Dollar Purchasing Power For Consumers Sinking Faster Than The Titanic As Zoltan Pozsar Suggests Bretton Woods III With Money Backed By Commodities

Zoltan!

(Forbes) – Credit Suisse’s Zoltan Pozsar argues Bretton Woods II crumbled when the G7 countries seized Russia’s foreign exchange reserves. Keeping money inside financial institutions like the IMF was considered risk free. That is clearly no longer the case. Similarly, Bretton Woods I collapsed when Nixon took the US of the gold standard back in 1971 when dollars were convertible to gold at a fixed exchange rate of $35 an ounce. This led to Bretton Woods II, backed by “inside money” or the dollar, which itself is not linked to gold or any other commodity.
Now the basis of this system, which has operated for the past 50 years, is being called into question. The sanctions on Russia, which showed that reserves accumulated by central banks can simply be taken away, raised the question of “what is money?”

That question may explain why Pozsar believes a huge shift in the way the world organizes money and reserves is now underway, “creating a “Bretton Woods III backed by outside money,” (gold and other commodities). Including crude oil and bitcoin.

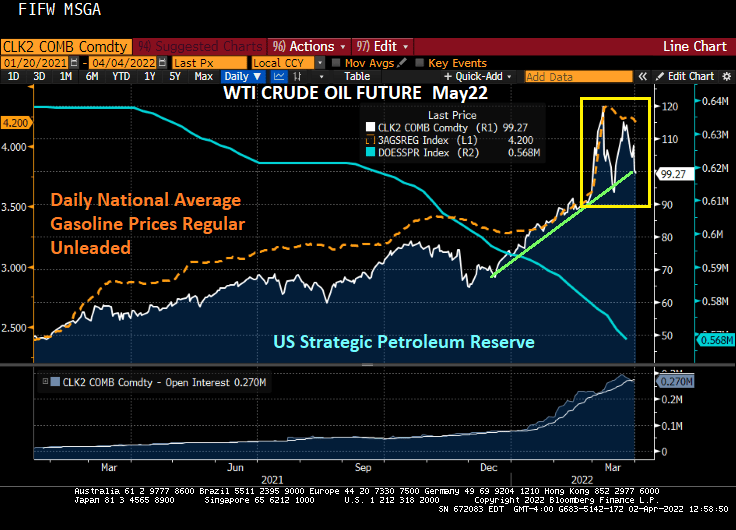
At least crude oil has fallen below $100 as Biden merrily drains the Strategic Petroleum Reserve (SPR). Gasoline prices have fallen slightly as this is being done before the midterm elections with political, not economic, intent. Once the midterms pass, will Biden continue draining the SPR until there is little left forcing the US to convert to “green energy”?

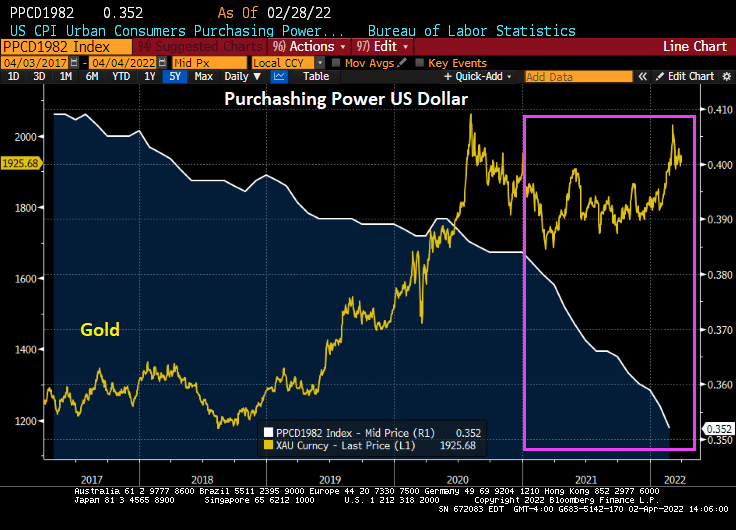
The purchasing power of the consumer dollar took a plunge under Biden as other commodities such as Bitcoin and crude oil soared.

An alternative asset, gold, have generally risen under Biden’s Reign of Error, but particularly after the Russian invasion of Ukraine.

Politicians love to spend money, often recklessly. And with The Fed monetizing Federal government expenditures, the purchasing power of the US dollar for consumers is sinking faster than The Titanic.

The Powellenburg Omen! Will Powell Pop The Asset Bubble Created By The Fed’s Repeated Policy Errors? (Blackrock Rises, NVR Homes Gets Crushed)

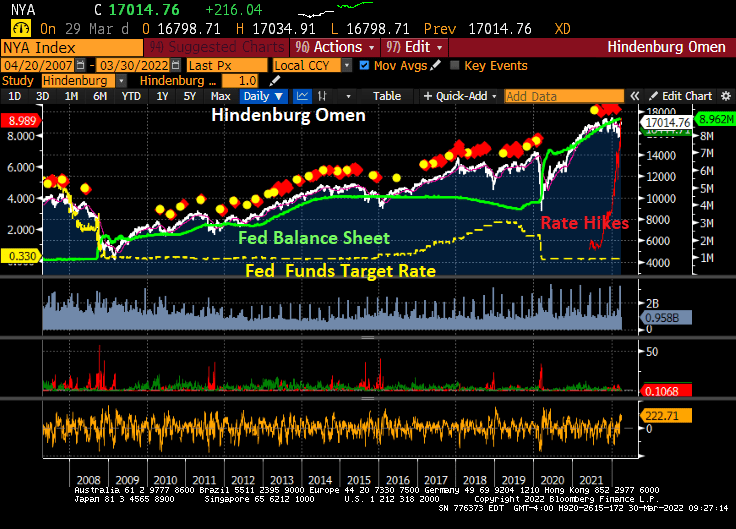
As of today, Jerome “Nero” Powell and The Gang at The Federal Reserve have not trimmed the Fed’s balance sheet and have only raised their target rate once under President Biden.

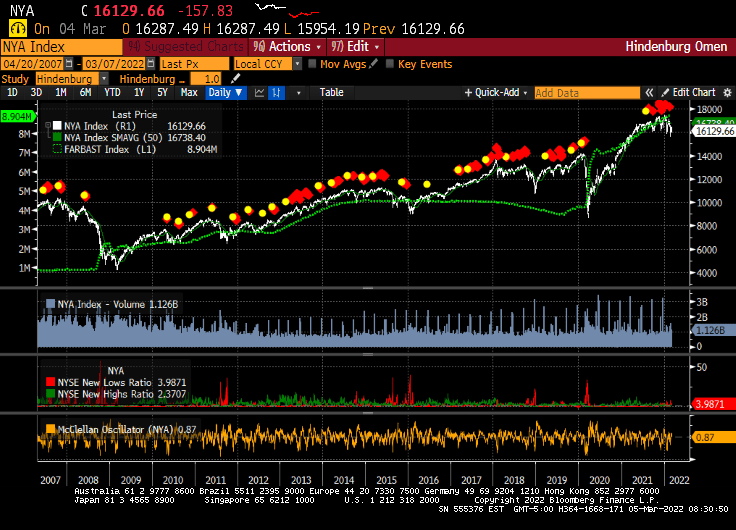
Here is the Hindenburg Omen, named for the catastrophic explosion on May 6, 1937 at Lakehurst Naval Air Station in New Jersey. The Hindenburg Omen was flashing red before the stock market correction of late 2007-2009. But, the Hindenburg Omen has flashed red repeatedly since the financial crisis, yet the S&P 500 index has kept rising. The reason? Repeated policy errors by The Fed leaving monetary stimulus in place for too long leading to a bubble forming in the stock market.

The Shiller CAPE (Cyclically-adjust price-earnings) ratio is at the second highest level since the 1800s. The highest point was the infamous Dot.com bubble and bust in 2000/2001.

Since The Fed continues to say “We have a plan!” to slow/shrink The Fed’s balance sheet and raise their target rate … it has not done anything yet (other than a 25 basis point bump at the March meeting).

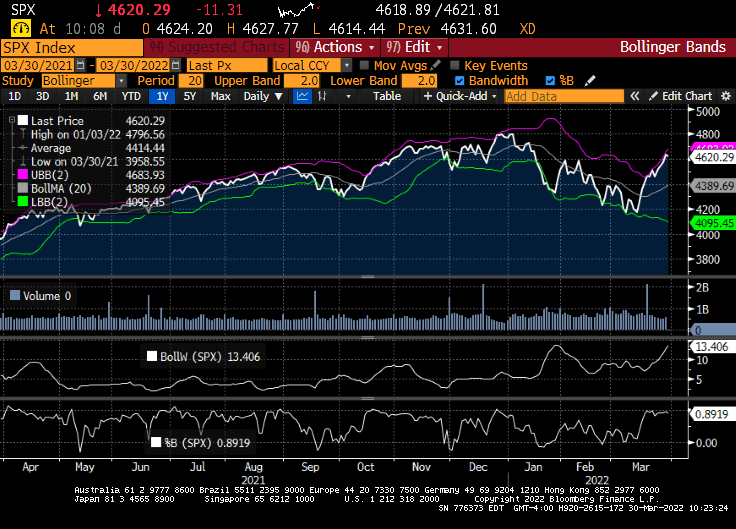
I am not advocating technical analysis for stocks, but the Bollinger Band analysis for the S&P500 index is showing the S&P 500 index near the top band indicating that a decline in likely.

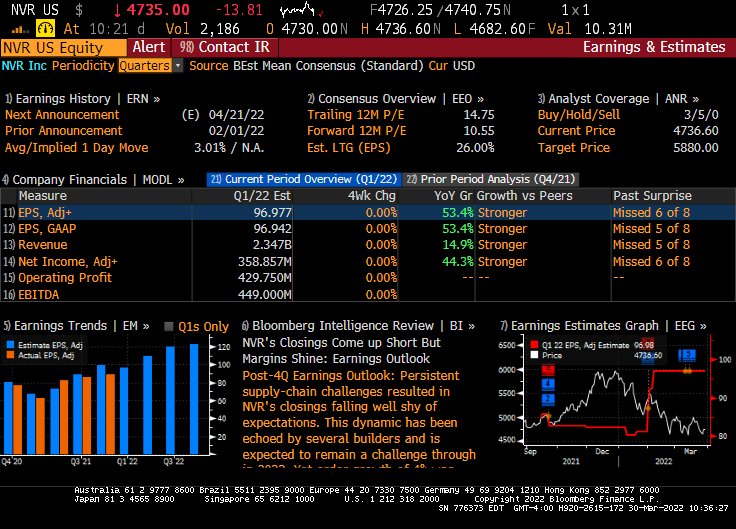
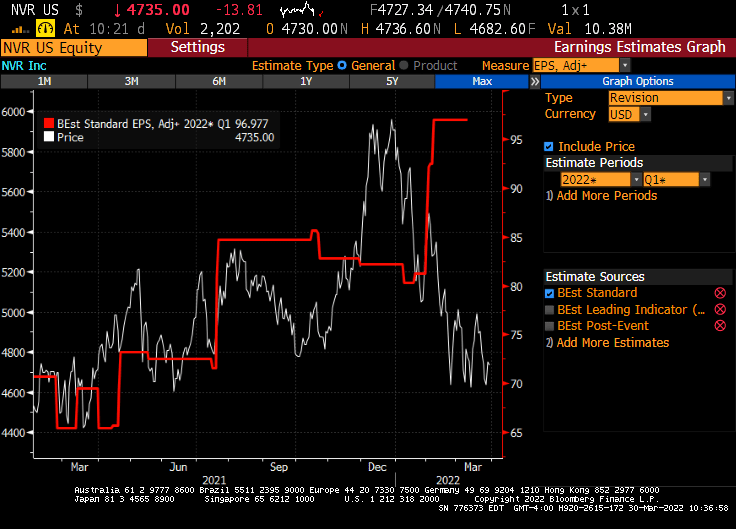
Today, the US equity market in essentially flat given the massive uncertainty about the Russia/Ukraine situation and whether the US economy is slipping into darkness. But this morning, Federal government blessed companies (healthcare, solar energy and Blackrock) are doing quite well, while homebuider NVR is taking it on the chin thanks to hints that The Fed will raising rates.

Now, NVR (Northern Virginia Homes, Ryan Homes) had explosive earnings growth in their February 1, 2022 report.

But the market is pricing in the crushing Fed rate hikes that are expected.

So, will Foul Powell pull a Volcker and raise rates and crush the economy (and stocks)? Or will Foul Powell And The Fed gang let inflation burn out of control, but preserve the massive asset bubbles?

Trouble In Potomac City! US Treasury 10Y-5Y Curve Goes Further Into Inversion As Mortgage Rates Keeps Rising

We’ve got Trouble in Potomac City!

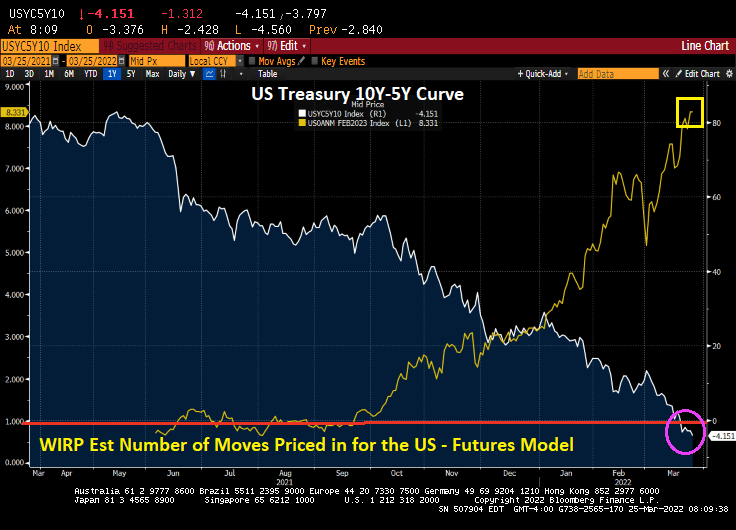
The US Treasury 10Y-5Y curve is going deeper into inversion.

The short end of the Treasury curve is rising, as expected, but declining at the 5 year tenor and beyond.

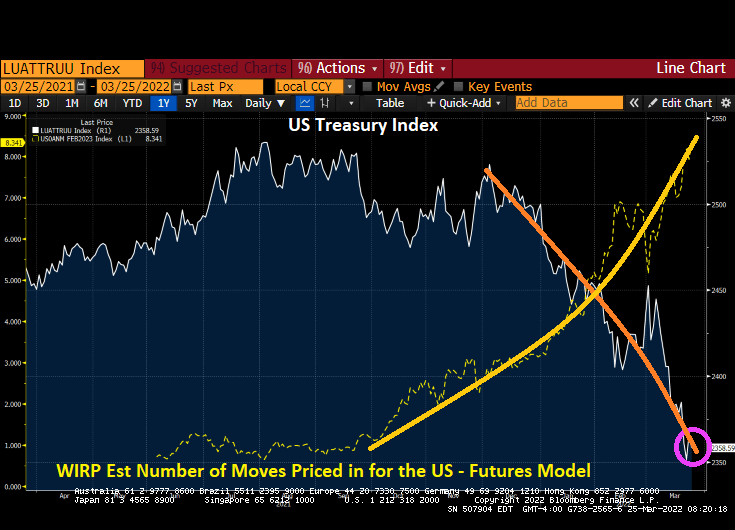
The aggregate Treasury Index is plunging as Fed Funds Futures signal 8.341 rate hikes over the next year.

Mortgage rates? Climbing as mortgage refinancing applications fall (as expected).

Is The Federal Reserve actually run by The Office’s Michael Scott?

Trouble With The (Yield) Curve! 10Y-2Y Slope Approaching Inversion As Fed Plans Rate Hikes And Bitcoin Falls

The US Treasury yield curve (10Y-2Y) is rapidly approaching inversion at 20.5 bps (where the 10-year yield is lower than the 2-year yield). But the 10Y-3M curve is generally steepening at 173.33 bps.

Of course, the driving force behind the flattening of the 10Y-2Y curve is the rapidly rising 2-year Treasury yield (orange line). The last time the 10Y-2Y curve inverted was in 2019, prior to the COVID outbreak in early 2020.

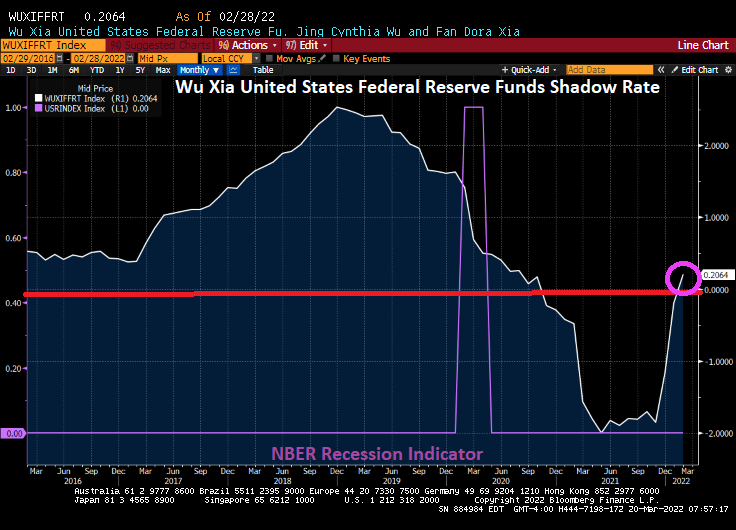
The Wu Xia United States Federal Reserve Funds Shadow Rate has finally climbed back into positive territory.

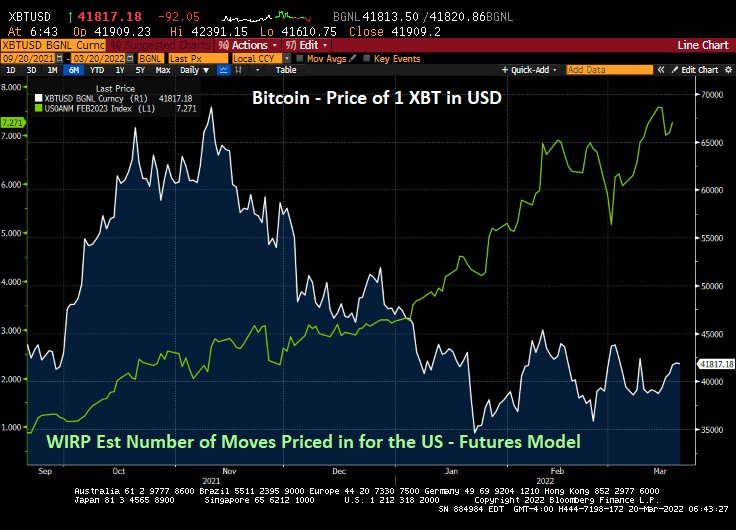
At last look, The Federal Reserve is forecast to raise their target rate 7 times over the coming year. And with the increasing forecast of rate hikes, we are seeing the cryptocurrency Bitcoin fall from near $70,000 to $41,817.

President Biden announced that he will be issuing an executive order to combat rising energy prices (the rising energy prices that he caused in the first place with … executive orders). Let’s see what happens next.

Hello t-r-o-u-b-l-e.

Fed Week! 10Y Treasury Yield UP 11.1 BPS, Mortgage Rates UP To 4.33%, Oil Down 7.5% (Russian, Ukraine Sovereign Curves Collapsing)

Yes, it is the much anticipated Fed Week! The Fed Open Market Committee (FOMC) will announce it decision (probably the first rate hike under Biden of 25 basis points).

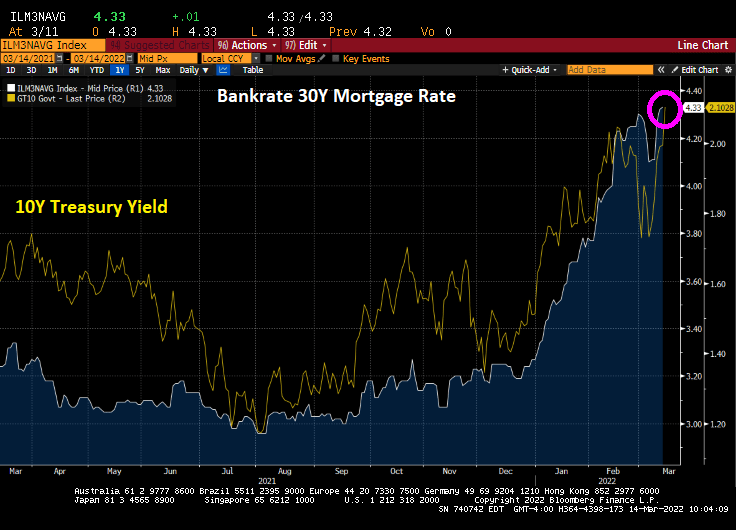
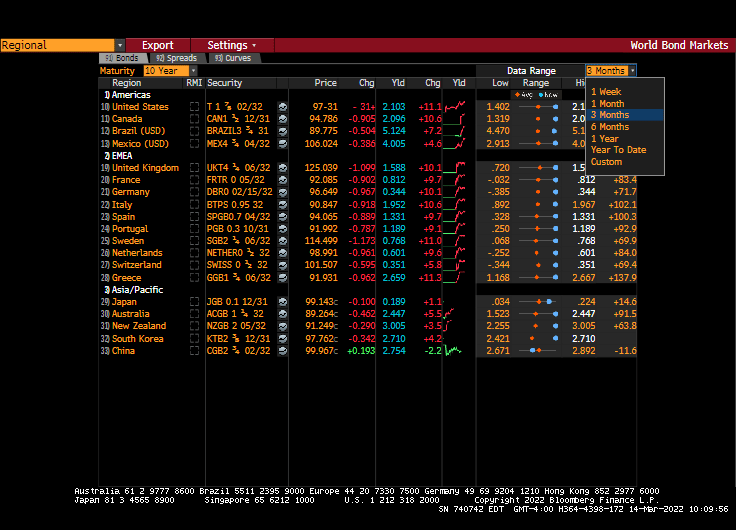
This morning, the 10-year Treasury yield rose by 11.1 basis points and the Bankrate 30Y mortgage rate rose to 4.33%.

Actually, sovereign yields are up around 10 basis points in the US, Canada, and across the pond.

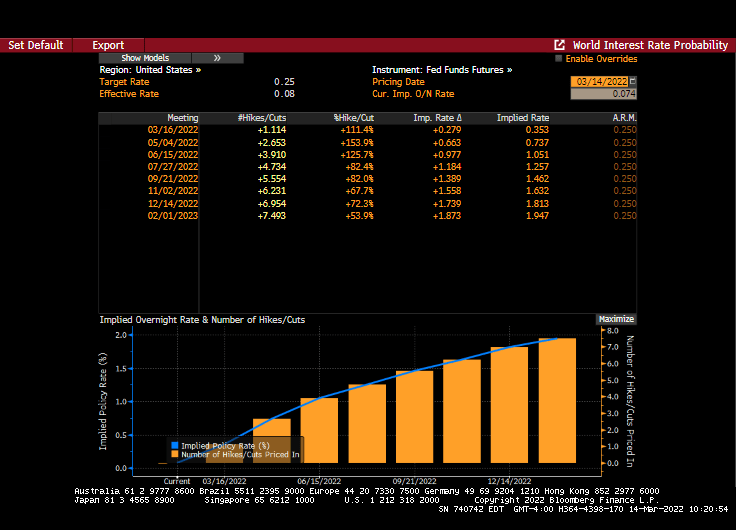
Fed Funds Futures are pointing to 7 rate hikes over the next year with 1.114 rate hikes on Wednesday. That means The FOMC may raise rates MORE than the 25 basis points expected my many (including me).

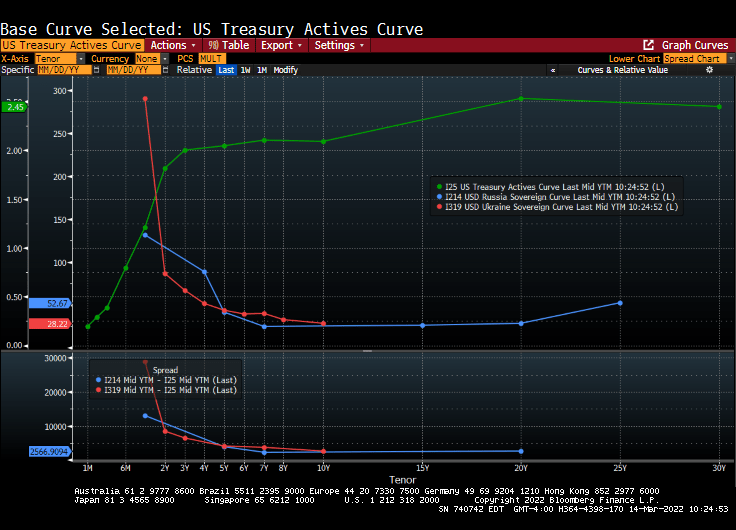
The US Treasury actives curve remains steeply upward sloping while both the Russian and Ukraine sovereign curves are steeply inverted and crashing.

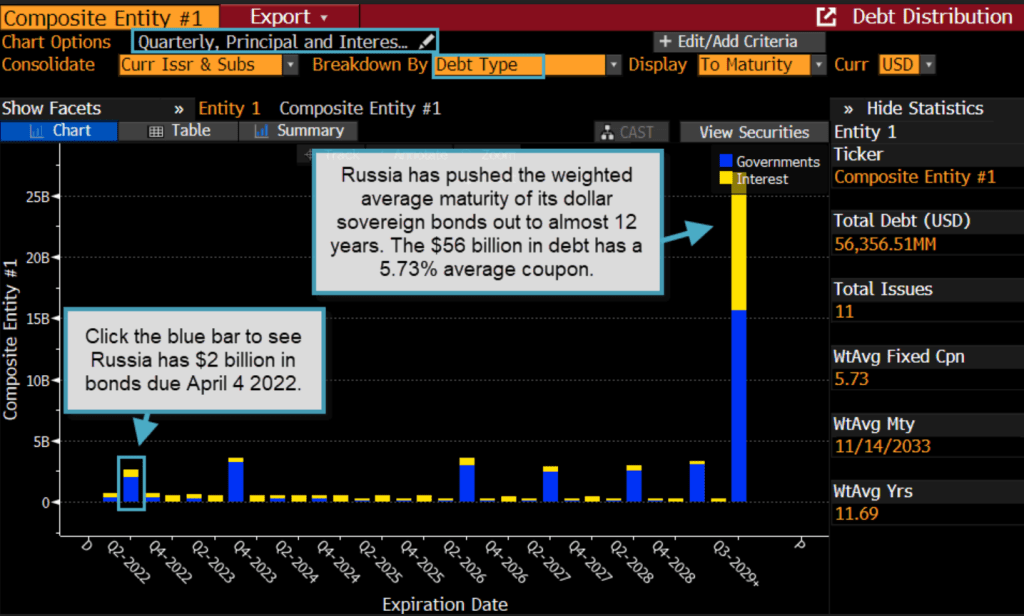
Russia has pushed the weighted average maturity of its dollar sovereign bonds out to almost 12 years.

The most hilarious headline of the day is a Bloomberg opinion piece: “Fighting Inflation May Require the Fed to Be Brutal: Clive Crook” How about the Biden Administration relaxing oil drilling and pipeline restraints? Otherwise, brutal translates into causing a recession. Great suggestion, Clive! … NOT!

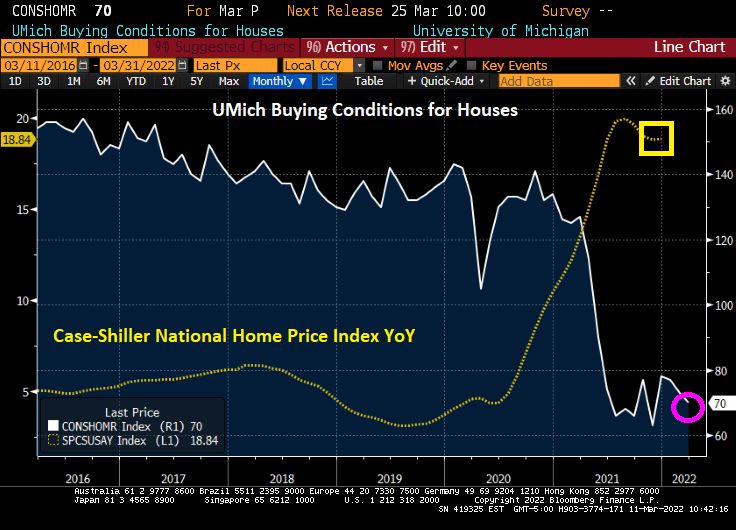
Consumer Confidence Plunges As Inflation Worsens (UMich Conditions For Buying Homes Declines To 70)

As inflation worsens, the University of Michigan survey of consumers fell again as US inflation worsens.

On the housing front, buying conditions for houses fell to 70 as a result of soaring home prices.

MY confidence in Biden and Congress has certainly declined.

Friday Update: US Mortgage Rate Rises To 4.32% As 10-year Treasury Yield Breeches 2% (6+ Rate Increases Baked Into Fed Futures Data)

Good morning!

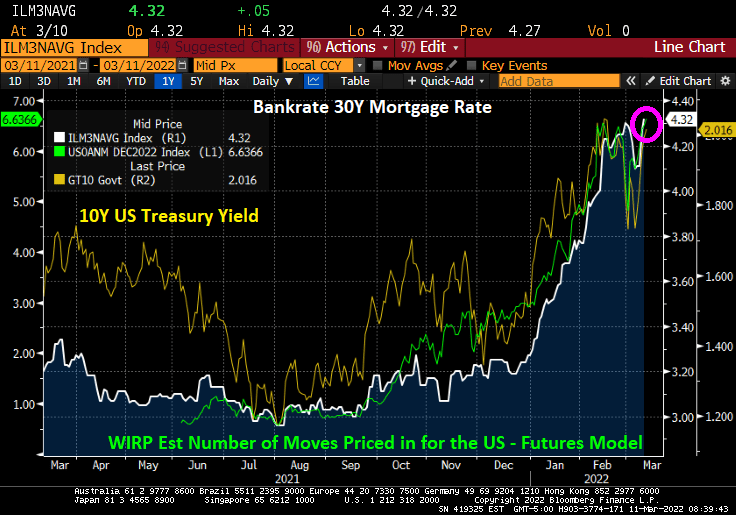
US 30-year mortgage rates rose to 4.32% (Bankrate) as the 10-year Treasury yield broke through the 2% barrier. This is happening as Fed Funds Futures are pointing toward 6+ rate increases over the coming year.

Actually, Fed Funds Futures are pricing in 7 rate increases over the coming year.

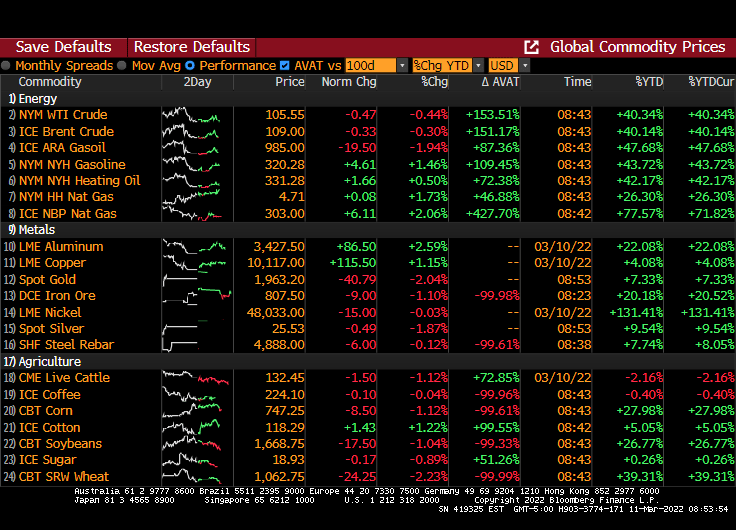
At least all is quiet on the commodities front.

So, it appears that Fed Chair Jay Powell will follow-through with numerous rate hikes over the coming year.

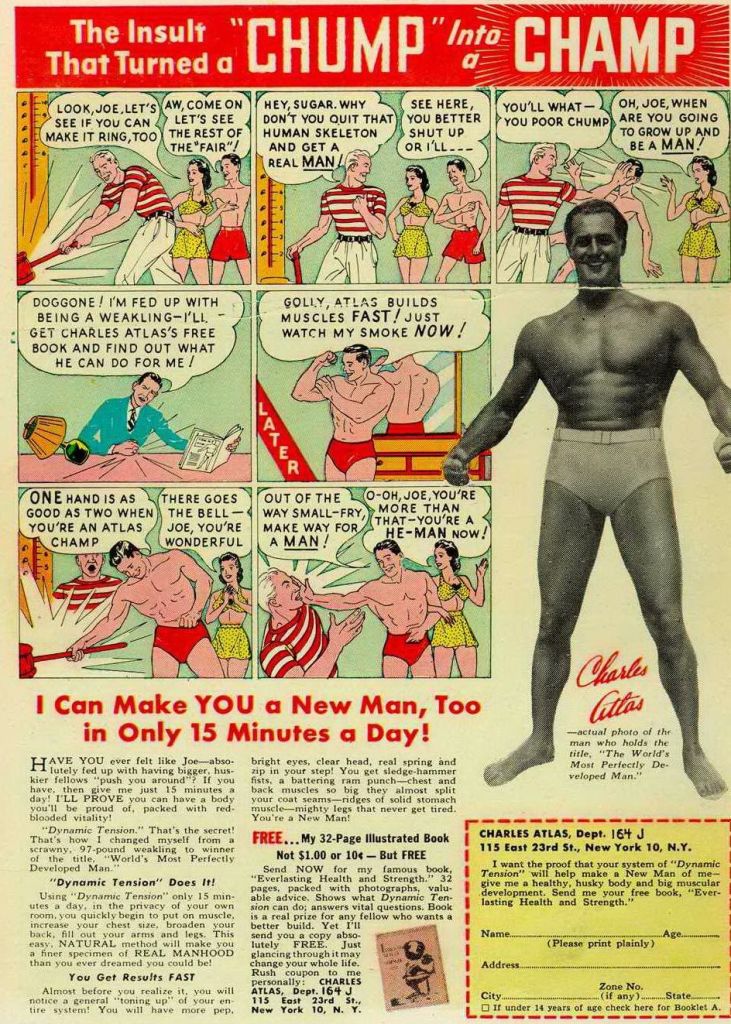
I guess Powell is tired of being a low-rate chump instead of a high-rate champ?

Weekend Update II: Russian Bonds, Stocks, Ruble And Oil Exports Crash (But Russian 5Y CDS Drops To 554)

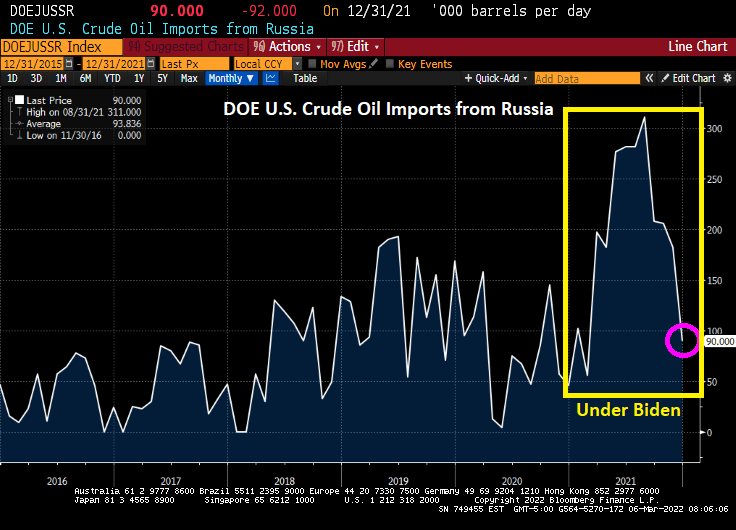
Russia is still engaged in its invasion of Ukraine. And the US continues to import crude oil from Russia. In fact, US crude oil imports from Russia soared under Biden only to decline again in December 2021.

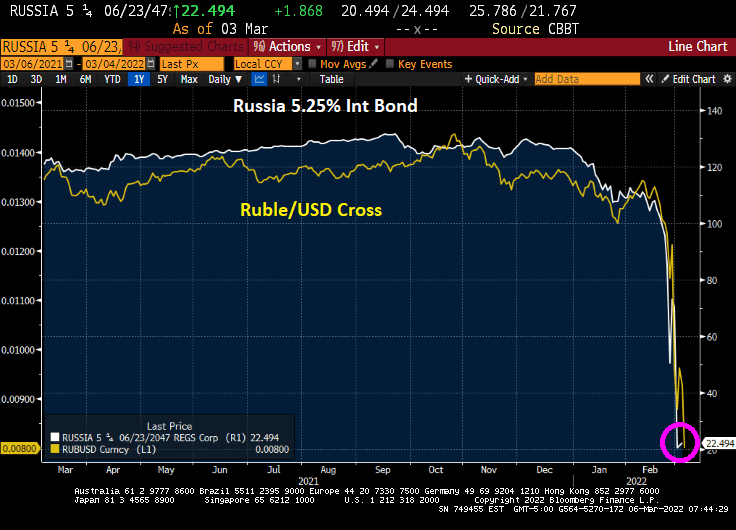
On the sovereign bond and currency front, the 5.25% coupon Russian international sovereign bond has crashed to 22.494. And the Ruble/USD cross has crashed as well.

Sberbank Bank 5 1/8% corporate bond has crashed to 25.

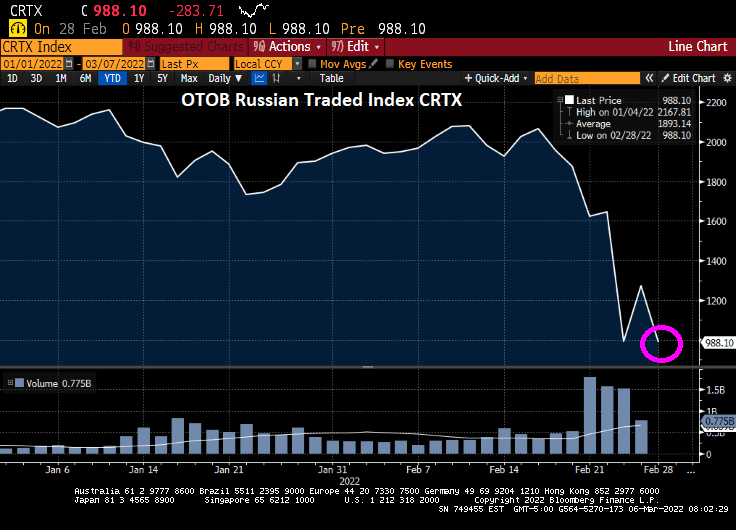
The Russian blue-chip stock market (OTOB Russian Traded Index CRTX) has crashed by over 50% since the invasion of Ukraine.

Fortunately, I like Cheerios for breakfast made from oats, since wheat futures are soaring.

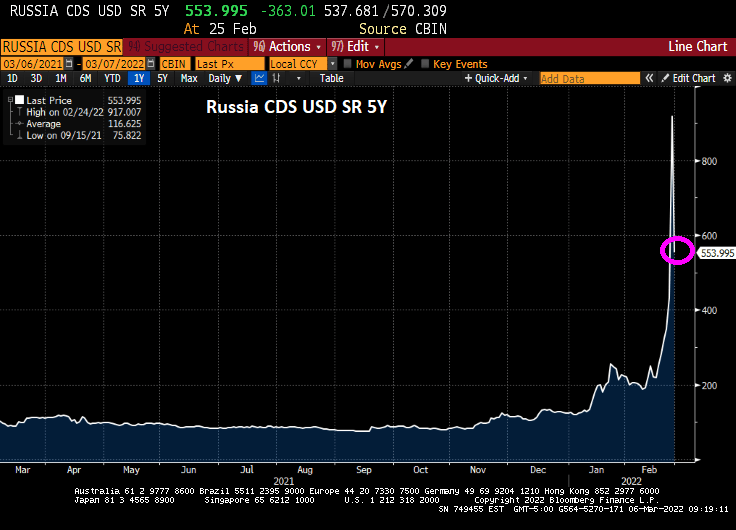
Russia’s Credit Default Swap (CDS) 5Y has dropped to a still-elevated 554.

The US really needs to ban Russian crude oil imports, since Biden’s failed in game theory by cutting US energy exploration on Federal lands and offshore drilling.

War is hell, as Vlad “The Ukrainian Impaler” Putin has demonstrated.

Weekend Update: Oil, Commodities, Wheat, Soaring In Price, Mortgage Rates Down (Inflation Forecast To Worsen)

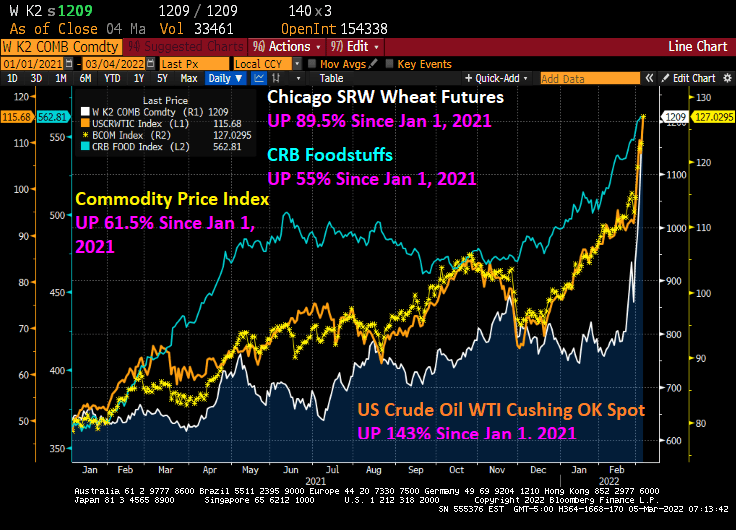
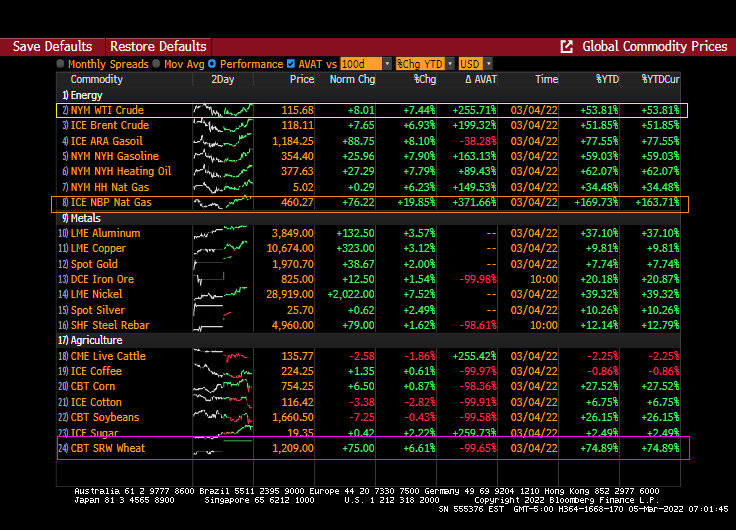
This has been a brutal week for consumers. With the Russia/Ukraine conflict raging and Congress seems determined to not allow for additional oil and gas production, and Biden’s anti-fossil fuel edicts still in place, we are seeing dramatic price increases in wheat (UP 89.5% since January 1, 2021), WTI Crude (UP 143% since January 1, 2021), and food stuffs (UP 55% since January 1, 2021).

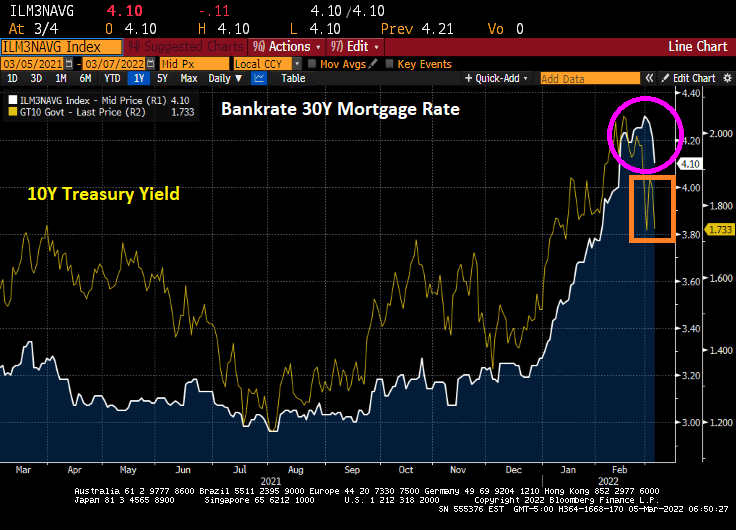
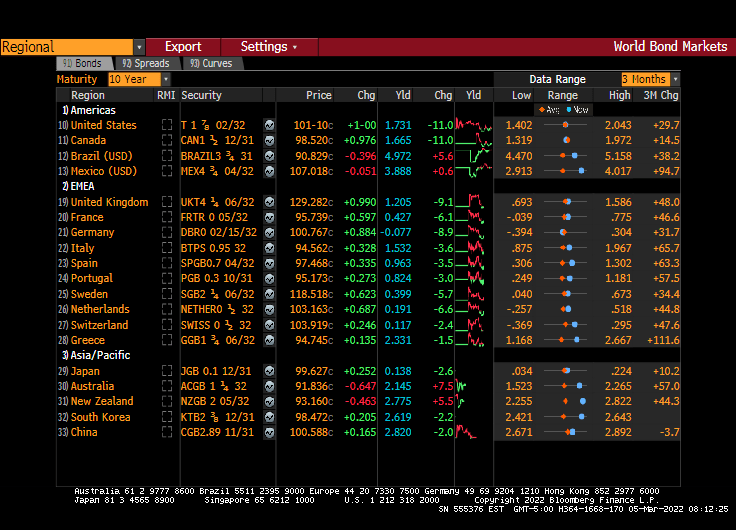
Bankrate’s 30-year mortgage rate has actually been falling the last several days, which is good for prospective home buyers as the 10-year US Treasury Note yield has been declining.

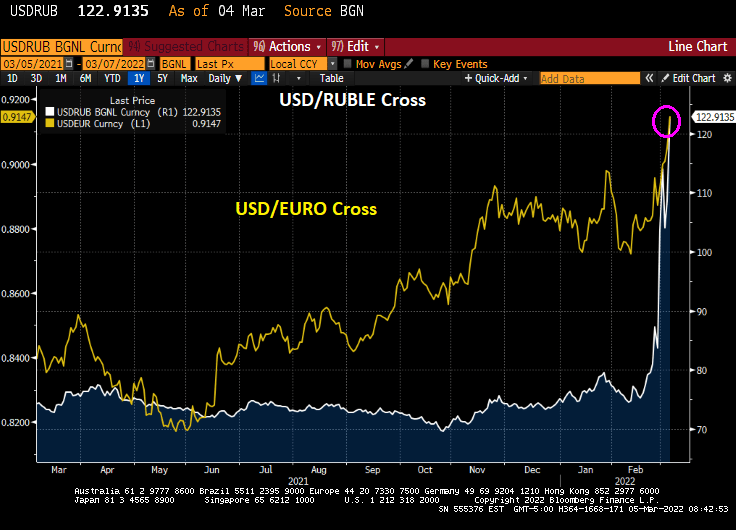
The USD/Russian Ruble cross is skyrocketing and the USD/Euro is doing likewise. Russians visiting the US will find that their trip is suddenly unaffordable (as do many American citizens will its rampant inflation). As Bruce Willis said in “Die Hard,” “Welcome to the party, pal.”

On Friday, the US Treasury 10-year yield declined 11 bps.

And energy prices continue to soar, particularly UK Natural Gas Futures that rose 19.85% overnight.

The US inflation data will be released on March 10th and the consensus is that February CPI inflation will rise to 7.9% YoY.

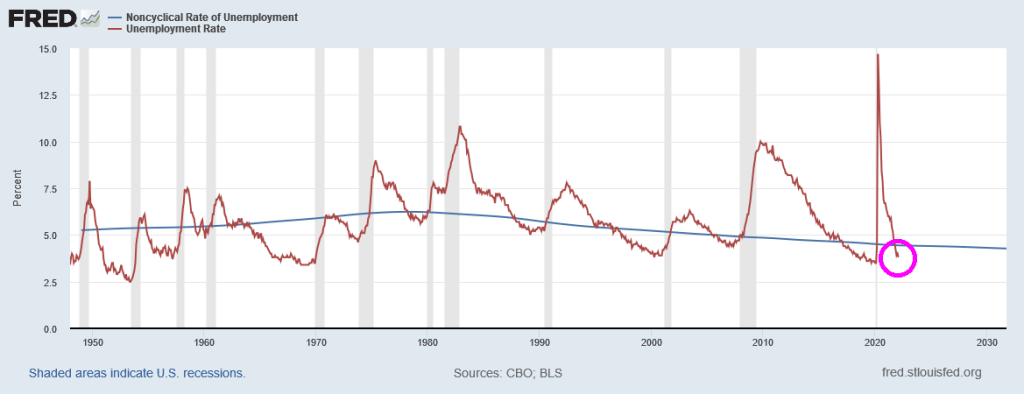
But even the latest unemployment rate report (3.8%) is signalling that The Fed should be raising interest rates since it is lower than the Natural Rate of Unemployment or NAIRU (4.44%).

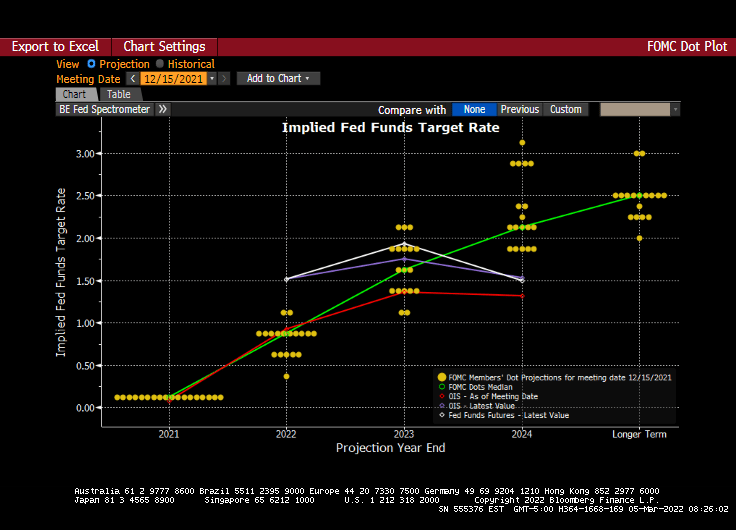
And we have the next Fed policy error on March 16th. The Fed dots plot looks like the glide slope for an aircraft, but the message is that rates will be going up at future meetings.

And just for amusement, I present to you the infamous Hindenburg Omen chart that forecast the 2008/2009 stock market correction. Since that correction, the Hindenburg Omen has been flashing “danger” but the only correction was the COVID-linked correction of early 2020. While the Hindenburg Omen is flashing red right now, The Federal Reserve’s balance sheet (green line) has protected against market corrections. Let’s see what happens if and when The Fed decides to remove the epic monetary stimulus.

Its anyone’s guess as to whether The Fed will actually tighten monetary policy.