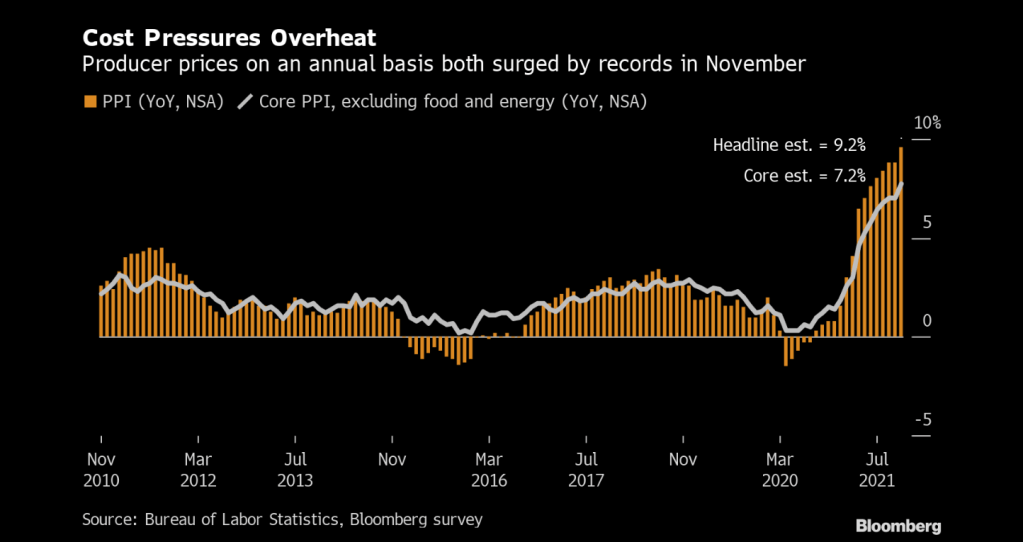
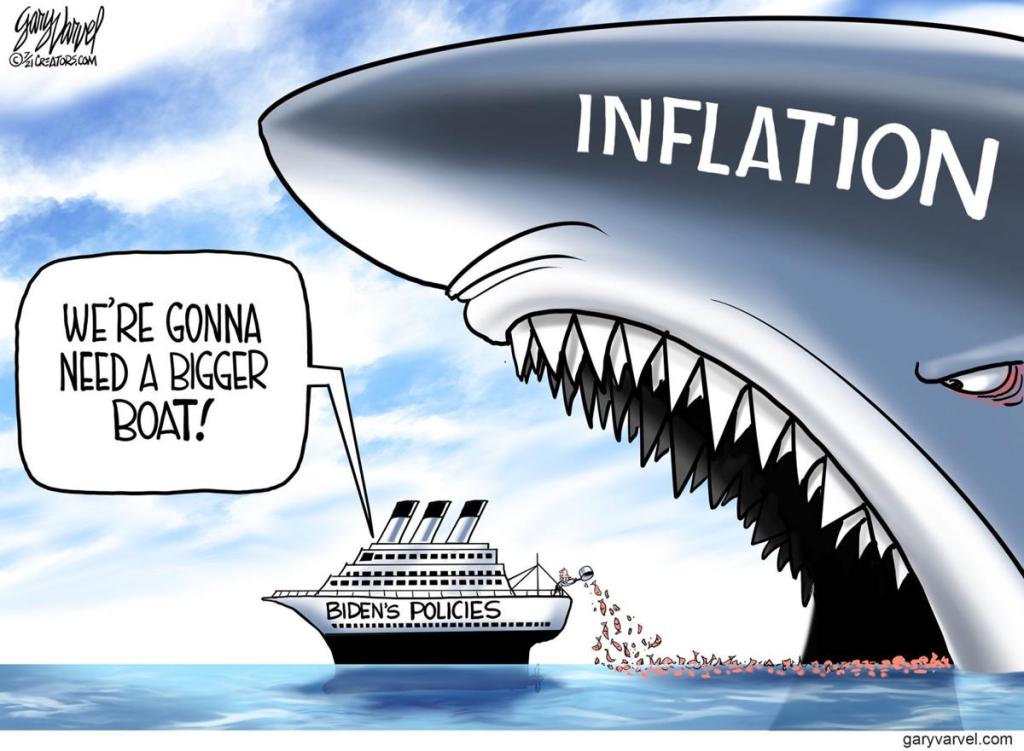
Prices paid to U.S. producers posted a record annual increase of almost 10% in November, a surge that will sustain a pipeline of inflationary pressures well into 2022.
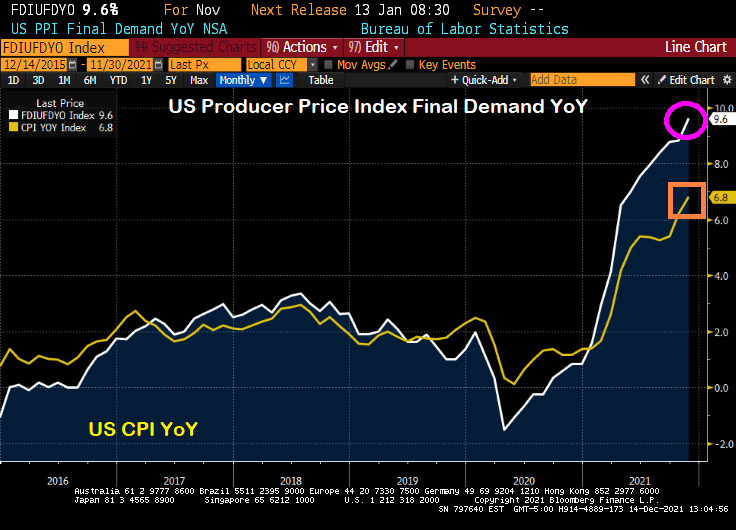
The producer price index for final demand increased 9.6% from a year earlier and 0.8% from the prior month, Labor Department data showed Tuesday. Both advances topped economists’ forecasts.
Even more interesting (or frightening) is that PPI Final Demand YoY is soaring faster than CPI YoY. If CPI catches up to PPI, then we have serious trouble.
With inflation seemingly growing out of control, Powell and Biden should sing “76 Trillion Dollars” which will be the US national debt after Biden and Congress get done with their spending splurge.
Inflation-adjusted return of Treasuries fell to lowest since the 1980s. For bond investors, this is their version of Kevin’s Famous Chili from The Office! Or The Fed’s Famous Chili!
(Bloomberg) — Treasury investors are losing more money than they have in four decades, once inflation is taken into account. And if markets are right, they’re unlikely to come out ahead for years.
The federal government’s debt has already lost about 2% outright over the past year as the Federal Reserve started removing pandemic-era stimulus from the economy and inched closer toward raising interest rates. But on top of that, the consumer price index has surged 6.8%, putting investors even deeper in the hole.
Taken together, that’s resulting in the worst real returns — or those adjusted for inflation — since the early 1980s, when then Fed Chair Paul Volcker was in the midst of fighting a wage-price spiral. What’s more, the dynamic isn’t expected to change: The bond market is projecting that 10-year Treasury yields will hold below the inflation rate for the next decade, meaning any investment income will be more than wiped out by the rising cost of living.
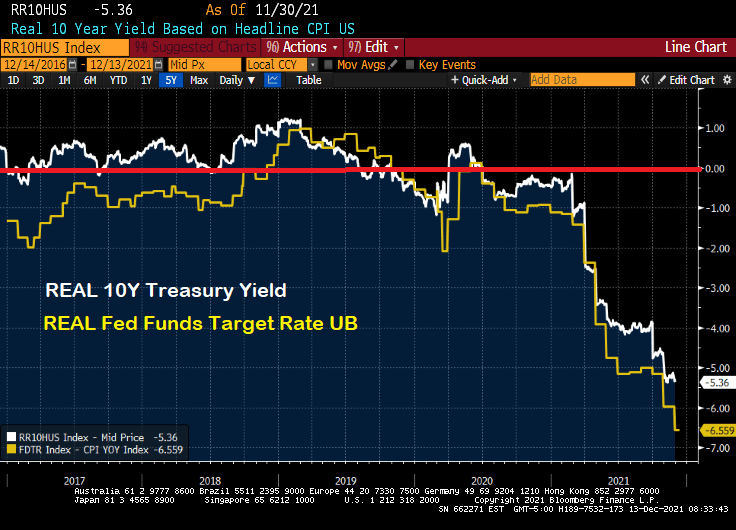
If we look at the REAL 10-year Treasury yield and REAL Fed Funds Target Rate, they are both negative.
Let’s see if Powell spills his famous chili on Wednesday at 2:00PM EST. The Fed keeps saying they are serious about controlling inflation, just like Kevin Malone.
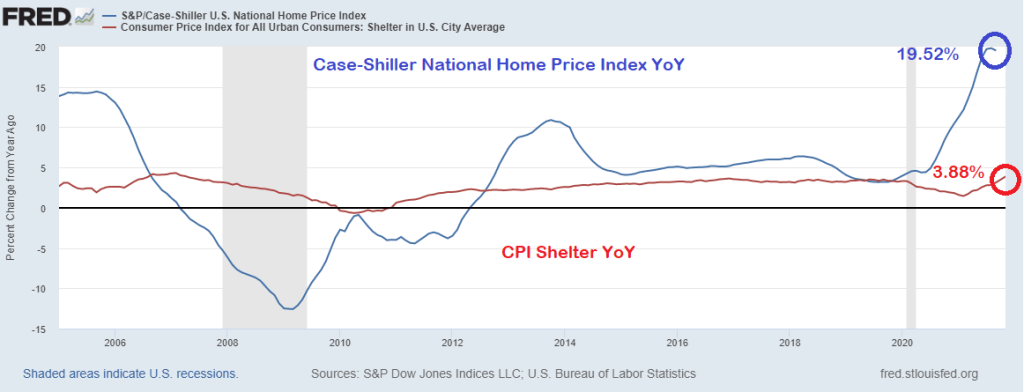
But that 6.9% YoY is very misleading because of the strange way the Bureau of Labor Statistics measures the largest asset in most households’ expenditures: housing.
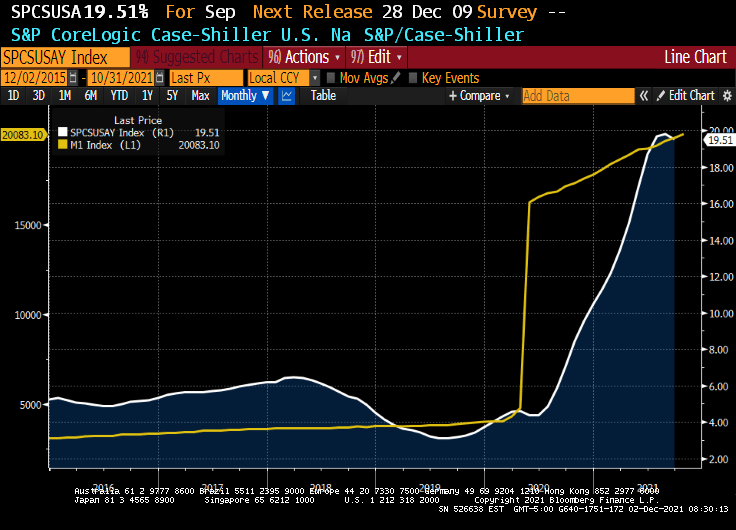
The BLS measures inflation in housing using the Shelter measurement. Which was only 3.88% YoY. The problem is that the Case-Shiller National Home Price Index was 19.52% in its last reading. That is quite a discrepancy.
So, if we substitute the Case-Shiller National home price index for the CPI Shelter, we get an inflation rate of greater than 11%.
The U.S. is poised to enter Year Three of the pandemic with both a booming economy and a still-mutating virus. But for Washington and Wall Street, one Covid aftershock is starting to eclipse almost everything else.
Already-hot inflation is forecast to climb even further when November data comes out on Friday, to 6.8%. That would be the highest rate since Jimmy Carter was president in the early 1980s — and in the lifetimes of most Americans.
And the CPI change since last year, according to the Federal Reserve of St Louis FRED is a staggering 16.262%.
And with U.S. Jobless Claims plunge to 52-year low, its about time that The Fed begins removing the humongous monetary stimulus.
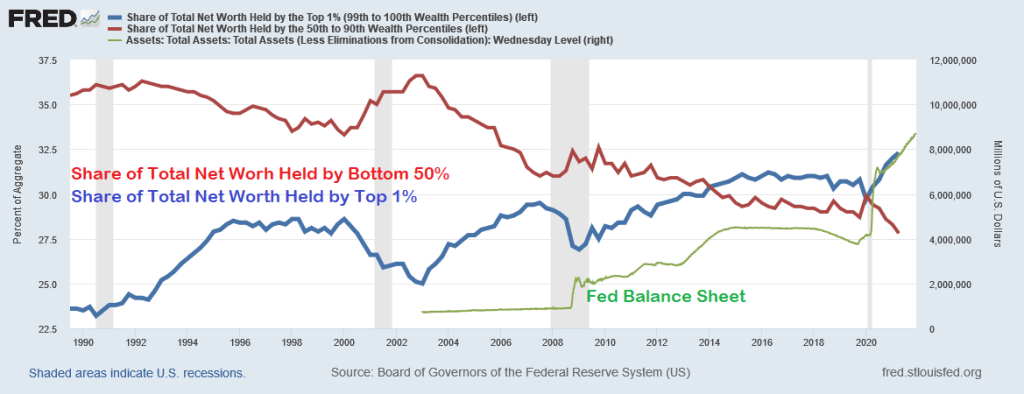
After all, largely thanks to Federal Reserve policies, we have seen the greatest wealth redistribution in US history … to the top 1%.
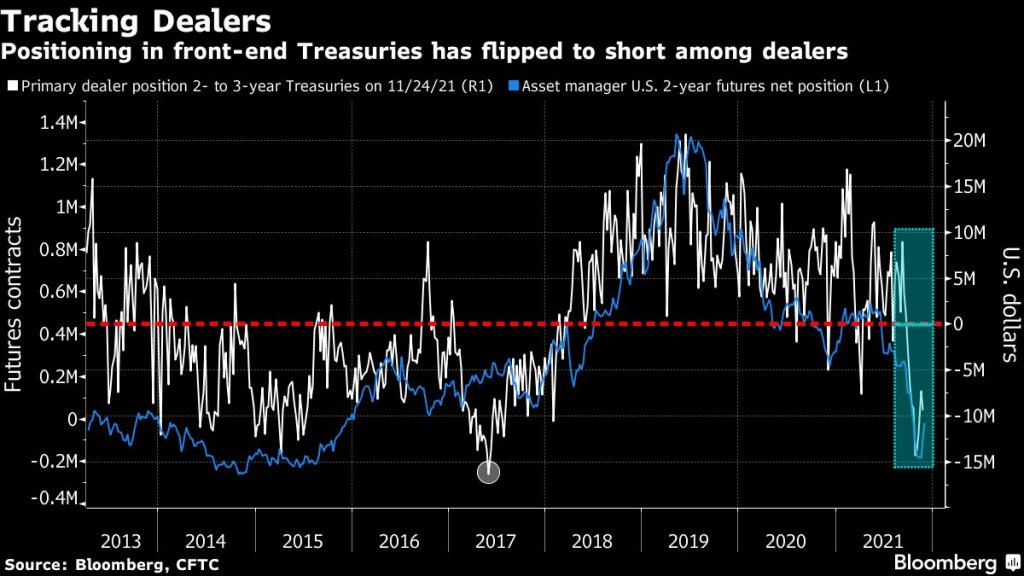
(Bloomberg) — The recent drop in primary-dealer holdings of front-end Treasuries is another warning of potential market dislocation heading into the year-end liquidity vacuum.
As of Nov. 24, primary dealers — which are mostly the large banks — were on the whole betting against two- to three-year Treasuries rather than buying. They had net short positions of just over $9 million, near the most bearish levels since 2017, signaling a pullback by buyers that provide crucial liquidity for older Treasury issues.
The positioning in the front-end of the curve “suggest less demand from the dealer community to fund off-the-run long positions,” Barclays strategists Anshul Pradhan and Andres Mok say in a Dec. 3 note. Off-the-run Treasuries are notes and bonds created in past years and traded less frequently than the newest issues; they’re the biggest part of the market and make up most of the Federal Reserve’s daily asset purchases, which are being scaled back.
Short positioning increased on a relative basis as a result, “which may also have crowded demand to borrow particular issues over others,” the analysts wrote.
Those forces together could contribute to an increase in market dislocations.
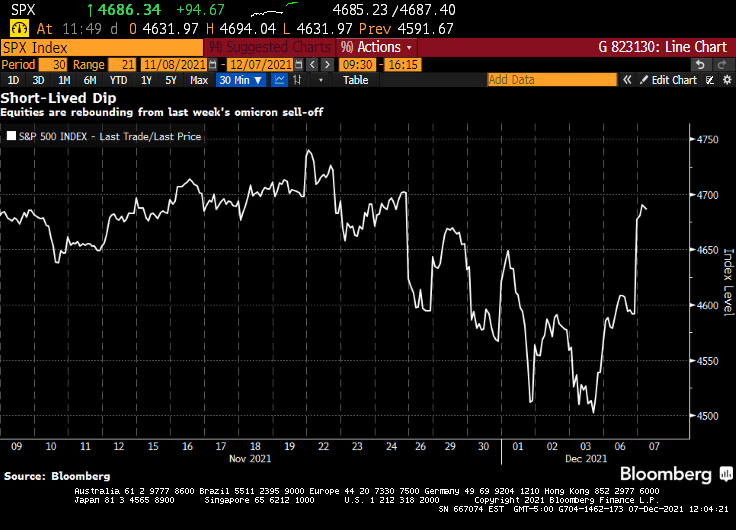
Jerome Powell’s hawkish pivot shocked financial markets. A week later, stocks are higher. The S&P 500 staged its biggest rally since March to wipe out losses from the past week. The speculative fringe that was a smoldering wreck Friday was soaring Tuesday. An index of meme stocks rallied more than 4%, while one composed of airlines added 1.6%. A gauge of newly public companies advanced more than 4%, SPACs jumped more than 2% and even cryptocurrencies rallied, with Bitcoin powering back above $51,000.
It’s a stunning about-face for risk assets that went into a tail spin after the Federal Reserve chair suggested he favored accelerating the removal of monetary support. What follows are takes from market-watchers on why the market is looking past the Fed’s potential change in policy.
China cut the amount of cash most banks must hold in reserve, acting to counter the economic slowdown in a move that puts the central bank on a different policy path than many of its peers.
The People’s Bank of China will reduce the reserve requirement ratio by 0.5 percentage point for most banks on Dec. 15, releasing 1.2 trillion yuan (US$188 billion) of liquidity, according to a statement published Monday.
The reduction was signaled by Premier Li Keqiang last week when he said that authorities would cut the RRR at an appropriate time to help smaller companies, and is the second reduction this year.
The decision comes after recent data showed the economy and industry stabilizing, although Beijing’s tightening curbs on the property market have led to a slump in construction and worsened a liquidity crisis at developer China Evergrande Group and other real estate firms.
Evergrande’s ADR is collapsing (now 5.975) along with Evergrande debt falling to 23.12 (versus 100 par).
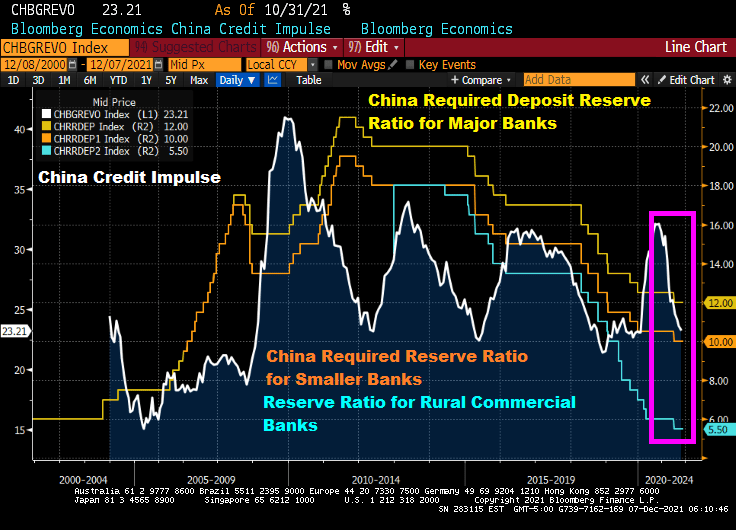
China’s credit impulse has nosedived (see pink box) as the PBOC drops bank reserve ratios to lowest level since 2007 in an effort to float the boat. Will the PBOC drop in reserve ratios stem the tide? Or is it peasant magic?
As The Federal Reserve tries to drain-off the extraordinary growth in its balance sheet since COVID without raising its target rate (good luck with that!), it is time to appraise where we are sitting. First, liquidity.
(Bloomberg) Buying and selling large quantities of U.S. government debt without substantially moving the market is about the hardest it’s been since the pandemic sent markets reeling in March 2020. Volatility has jumped, failed trades have increased — and Wall Street analysts warn that the Federal Reserve’s exit from bond-buying is set to make matters worse.
When markets seized up last year, liquidity in most Treasuries vanished, forcing the Fed to embark on massive asset purchases and other measures to avert a full meltdown. Now, the U.S. central bank is scaling back that buying, which has targeted the least-liquid Treasuries, and is poised to quicken the wind-down. At the same time, new government borrowing is ebbing, with the combination setting the stage for more fireworks.
OK, liquidity isn’t as bad as COVID and March 2020, but it is near the highest level since March 2020. The question is … will the numerous asset bubbles around the globe burstLet’s look at the ongoing saga of Chinese conglomerate Evergrande (mainly known as a large real estate developer). Their 8.25% bond has plunged to $23.481 on speculation of a catastrophic default on their bond payments. Then we have Invesco’s Golden Dragon China ETF (measuring a diversified market cap of US-listed companies headquartered or incorporated in China & derive a majority of their revenues from the People’s Republic of China). This ETF has crashed and burned back to pre-COVID (and Stimulytpo) levels.
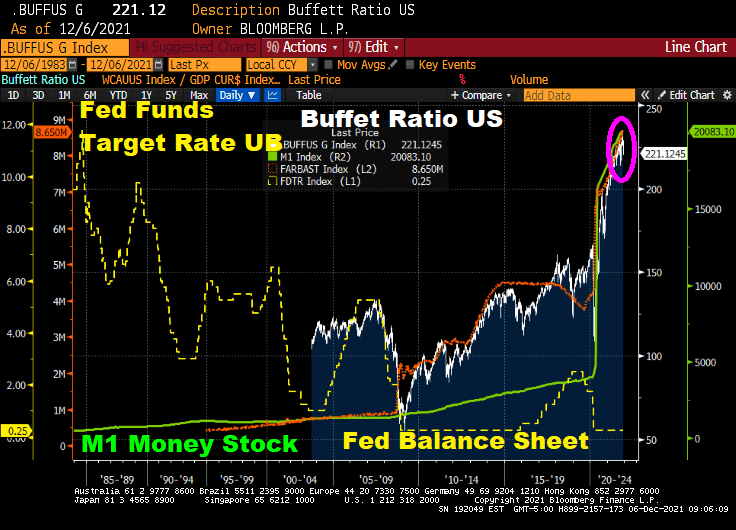
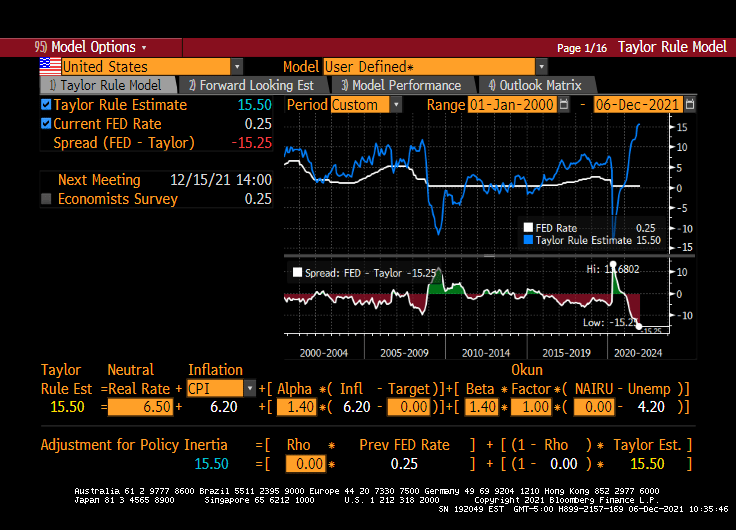
Speaking of cracks, how will the Buffett Ratio US react to a reduction in The Fed’s balance sheet (orange line) and M1 and M2 Money stock? Given that the Fed Funds target rate is WAY below where it should be (according to the Taylor Rule).
As I mentioned yesterday, the Shiller CAPE ratio is at its highest level since the Dot.com debacle of 2000. How will the Shiller CAPE ratio react to The Fed’s tapering?
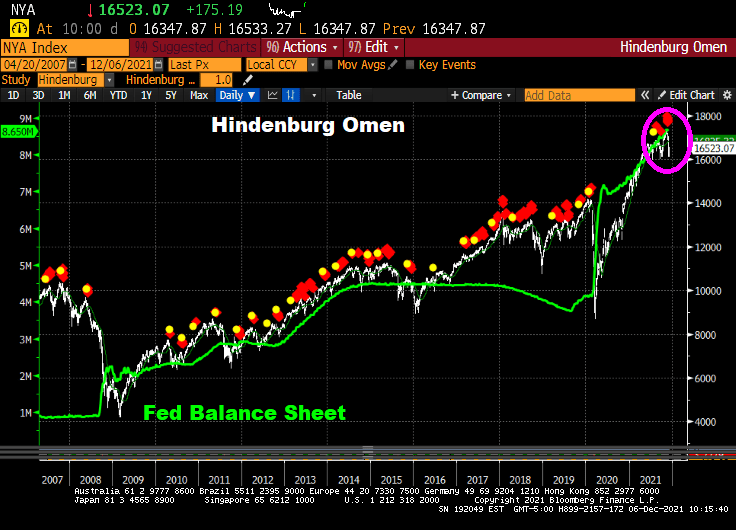
Even the Hinderburg Omen is flashing red … again.
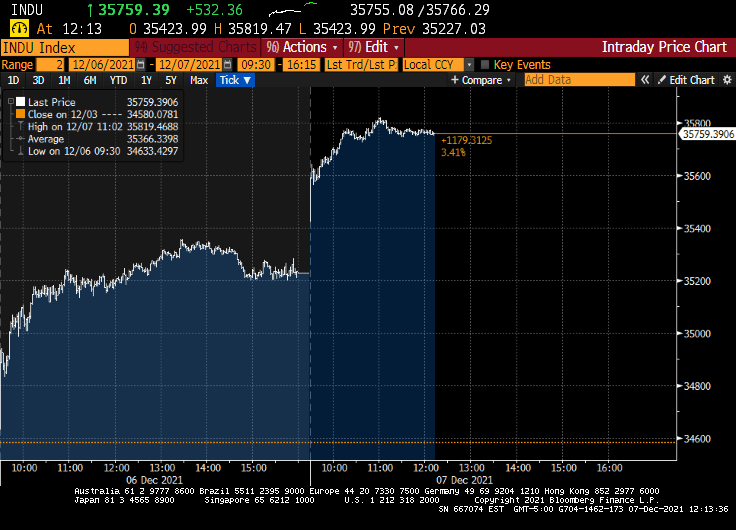
Now, the Dow is up 600 points today, primarily on the news that the Omicron Variant is about as harmful as the common cold.
A major shift is underway at the Federal Reserve to begin to remove the central bank’s massive pandemic easing policies, and could see it hike rates sooner than is priced in by markets.
Comments by Fed officials suggest the central bank is likely to decide to double the pace of its taper to $30 billion a month at its December meeting next week. Initial discussions could also begin as soon as the December meeting about when to raise interest rates and by how much next year with Fed officials set to submit a fresh round of economic forecasts and projections for the fed funds rate.
There is no consensus yet on when to begin hikes, but it’s clear that the faster taper is designed to give the Fed flexibility to raise rates as soon as the spring. The markets do not appear to expect the first rate hike until the summer of 2022.
Uh-huh. Let’s see what happens when and if The Fed starts to taper. Is economic growth so strong that it can continue without Federal Stiumulypto? THAT is the right question.
Look at the above charts and tell me if The Fed will actually raise their target rate more than twice. Despite the Taylor Rule suggest a target rate of 15.50% to cool inflation.
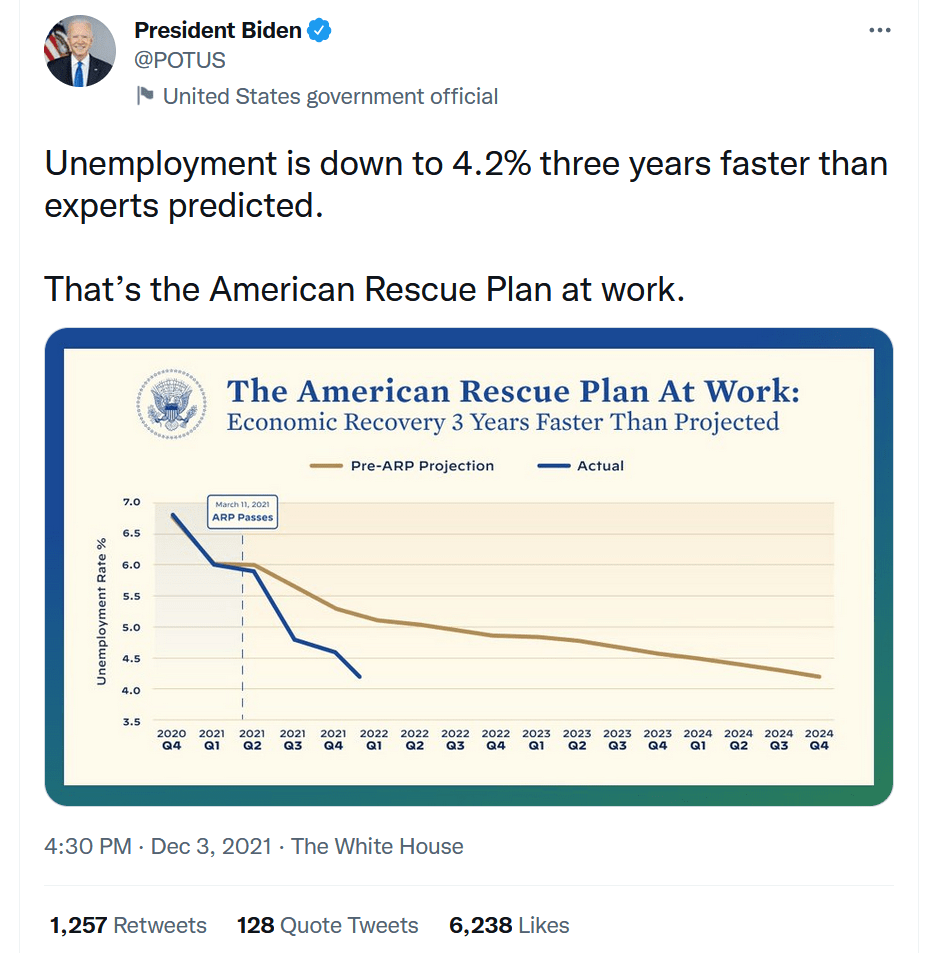
President Joe Biden took to Twitter yesterday to celebrate how well his economic policies are working, particularly the American Rescue Plan. Between Congress and The Fed pumping trillions of dollars of stimulus in the economy, how is this surprising? Or a reason for celebration?
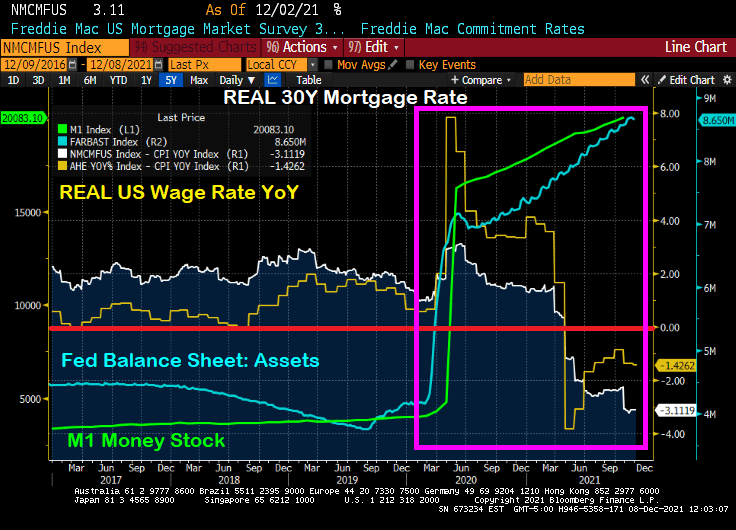
While declining unemployment is great, there is more to the story that President Biden failed to mention. Like … the number of people NOT in the labor force remains near 100 million (99,997,000 to be exact). Thanks to Covid-related policies (like job loss due to resisting vaccinations), increasing retirement, etc.), NOT in labor force remains elevated compared to pre-Covid levels. And, of course, Biden doesn’t want to mention that inflation is growing faster than hourly wage growth resulting in REAL hourly wage growth being -1.4% YoY.
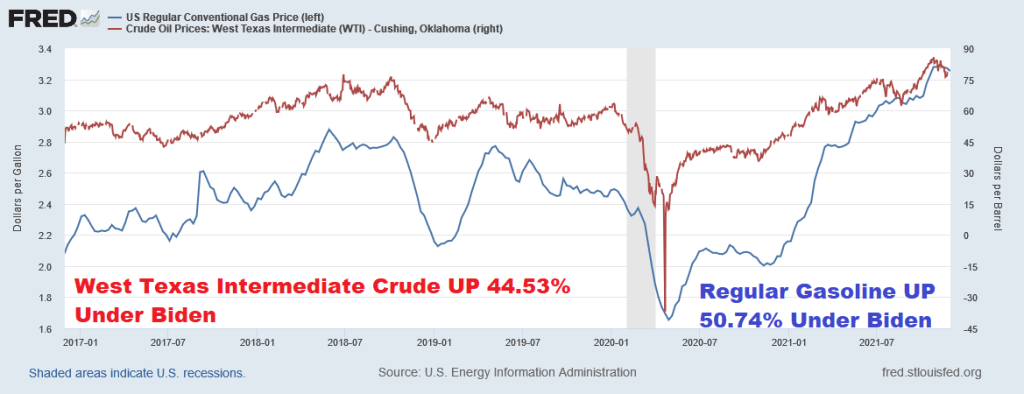
And President Biden took credit (he is a politician, after all) for a small decline in gasoline prices. Of course, after helping send gasoline prices up over 50% since he took office.
So, is Biden going to take credit for increasing gasoline prices by 50%? And declining REAL average hourly earnings? Or over 100 million people NOT in the labor force? I doubt it. But he is focusing on the POSITIVES of his American Rescue Plan.
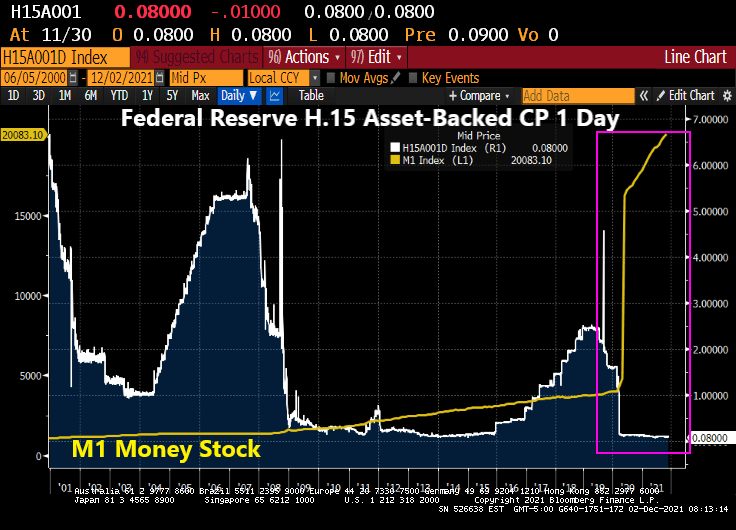
The Dream Team (Fed Chair Jay Powell and Treasury Secretary Janet Yellen) just can’t believe that inflation struck even after M1 Money Stock increased by 369% from March 2020 to today while interest rates remained near zero.
From The Hill: Federal Reserve Chairman Jerome Powell and Treasury Secretary Janet Yellen on Wednesday said they underestimated how quickly the U.S. economy would rebound from the COVID-19 recession and strain supply chains.
During a Wednesday hearing before the House Financial Services Committee, the top two U.S. economic policymakers acknowledged that high inflation has risen higher and lingered much longer than they expected.
“We understood demand would be strong,” Powell said. “We didn’t understand [the] significant problems of the supply side.”
Both Yellen and Powell said substantial fiscal and monetary stimulus played a role in stoking the higher demand that fueled inflation, but they called it a challenging side-effect of an otherwise fast recovery.
Seriously? The Fed and the Federal government dumped trillions of dollars into an economic system and didn’t think there would be negative consequences??
Look at the surge in M1 Money Stock at the same time asset-backed commercial paper rates are 0.08%. That is, about 1/3rd The Fed Funds Target rate (upper bound). None of this concerned The Dream Team?
An example of what The Dream Team didn’t see happening was the explosion of home prices. Home price growth was about 4% YoY prior to COVID, and is now 19.51% YoY.
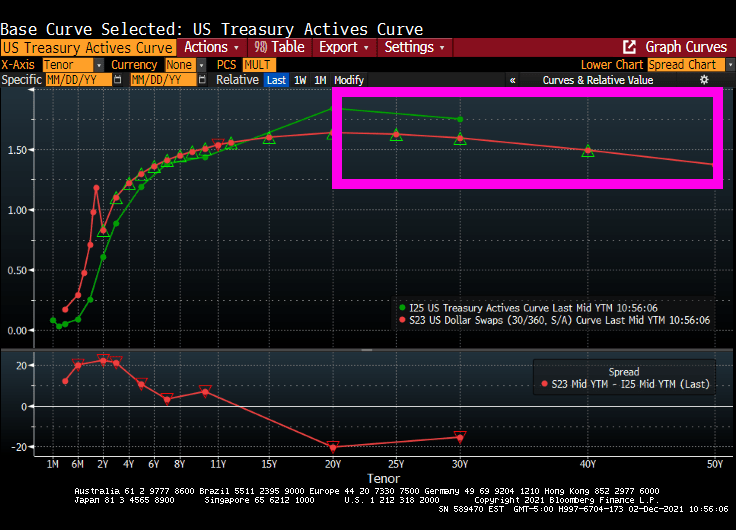
Now we have the US Treasury Actives curve inverting like the US Dollar Swaps curve after 20 years.

















 Confounded Interest - Anthony B. Sanders
You must be logged in to post a comment.