Is The Fed pushin’ too hard on rates to fight inflation? Or not hard enough??
Between the data and the overnight momentum in overseas markets, bonds are at their weakest levels in years. Mortgage-backed securities (the bonds that dictate mortgage rates) didn’t swoon quite as much as Treasuries, but as of today, it was just enough to push the average mortgage lender almost perfectly back in line with the highest 30yr fixed rate of the past 23 years. [30 year fixed 7.47%]
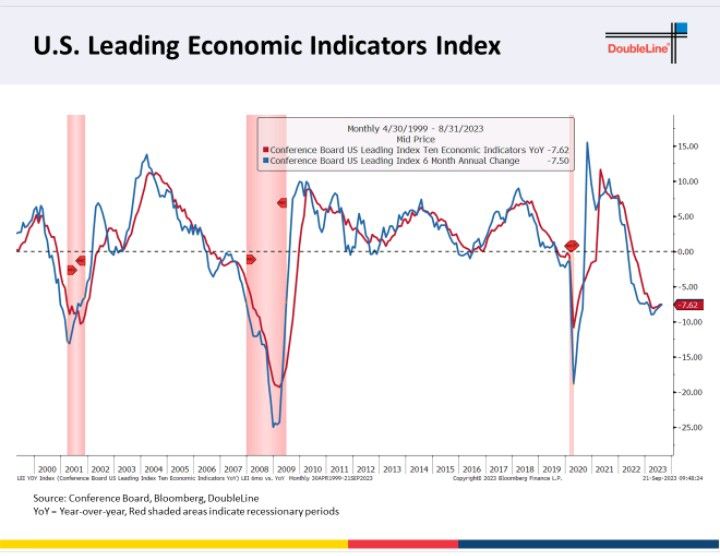
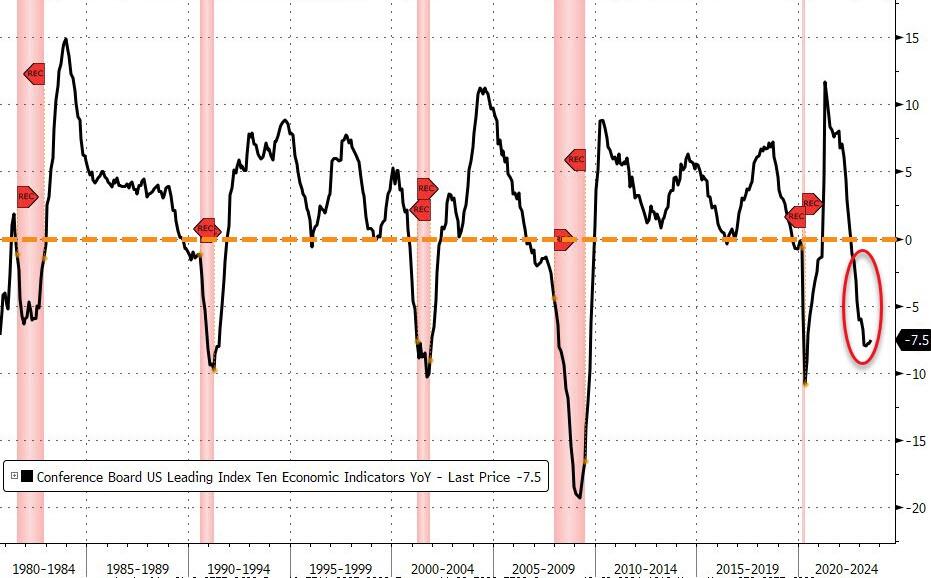
Conference Board Leading Economic Indicator declined -0.4%MoM in August, bringing the year-over-year change to -7.6%.
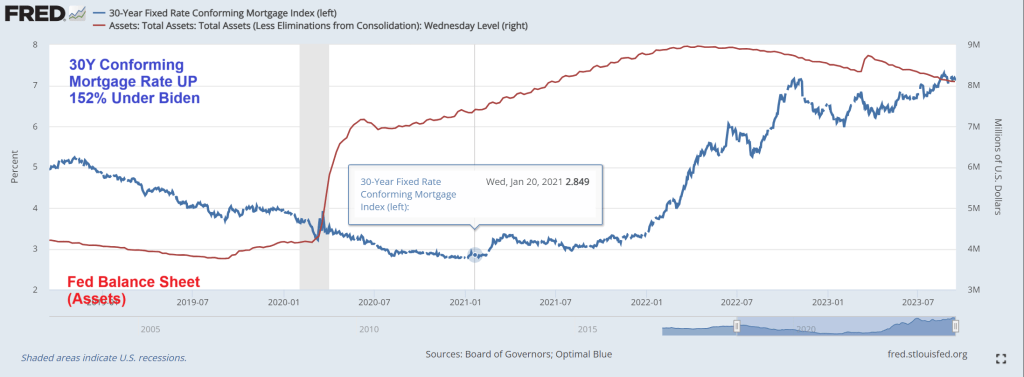
The Fed can’t seem to make inflation go away, despite what Janet Yellen says. The reason? While The Fed’s target rate has risen rapidly over the past year and a half, The Fed’s Balance Sheet is slowwwwwllyyyyyyyyyyyyyy unwinding.
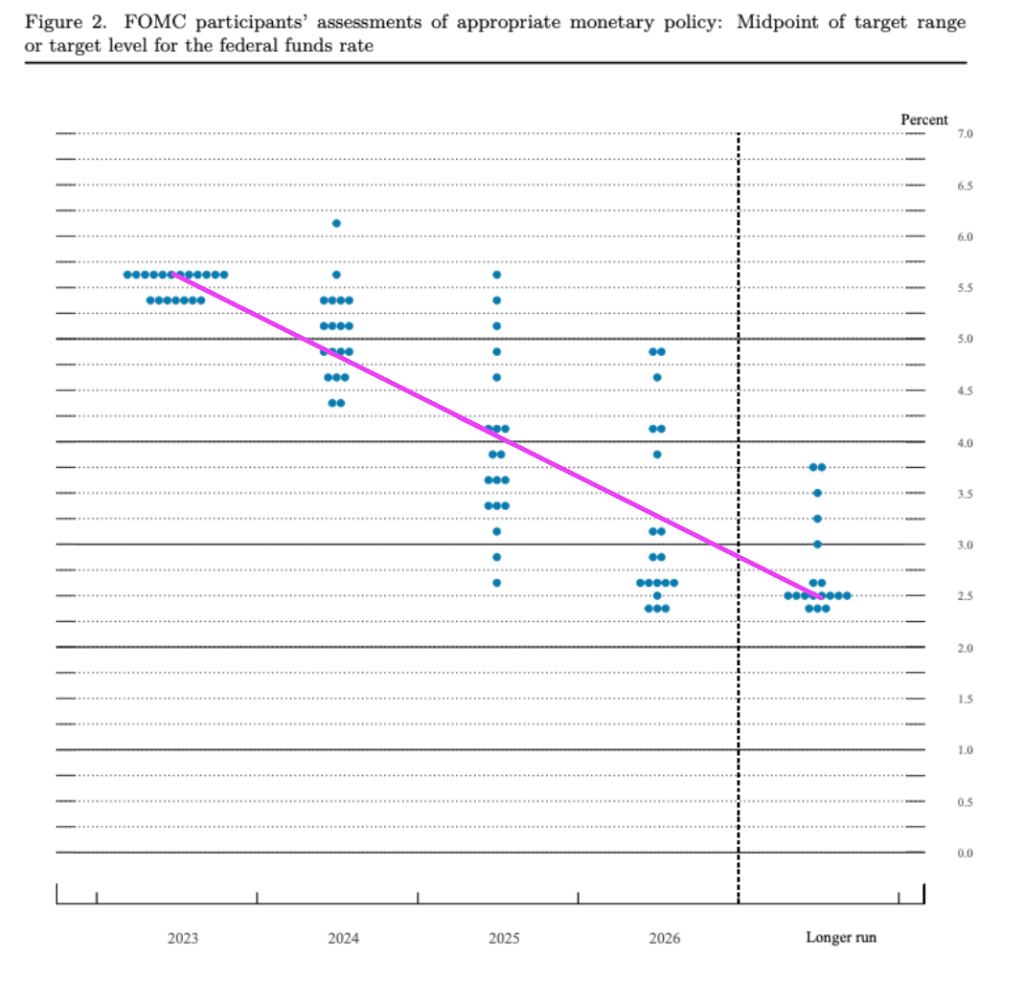
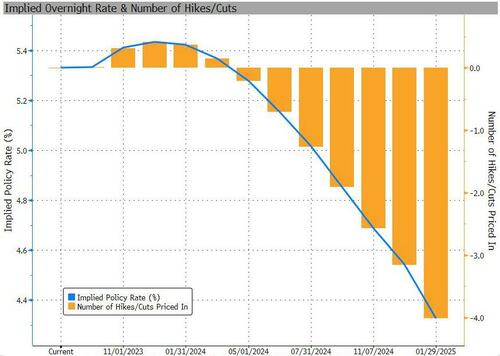
So much for The Federal Reserve raising rates until it gets inflation to 2%. Yesterday, the left their target rate unchanged. But yesterday, The Fed released their dot project showing their target rate is expected to decline in 2024 and beyond.
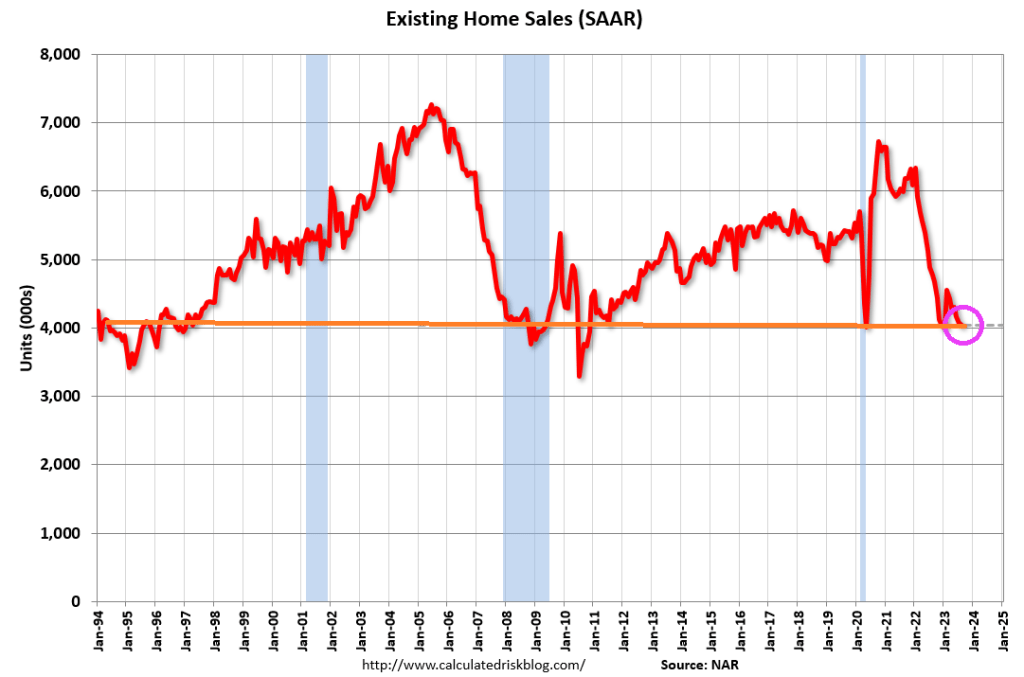
On the housing front, existing-home sales moved lower in August, according to the National Association of REALTORS®. Among the four major U.S. regions, sales improved in the Midwest, were unchanged in the Northeast, and slipped in the South and West. All four regions recorded year-over-year sales declines.
Total existing-home sales – completed transactions that include single-family homes, townhomes, condominiums and co-ops – slid 0.7% from July to a seasonally adjusted annual rate of 4.04 million in August. Year-over-year, sales fell 15.3% (down from 4.77 million in August 2022).
Of course now that I read that The Clinton’s see blood in Ukraine and are having the Biden Administration use the Clinton Global Initiative (CGI) be in charge of $25 BILLION on humanitarian relief. After The Clinton’s debacle with Haiti, nothing surprises me anymore.
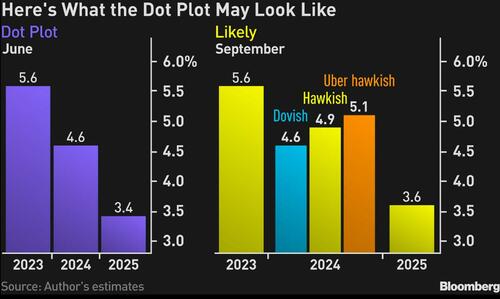
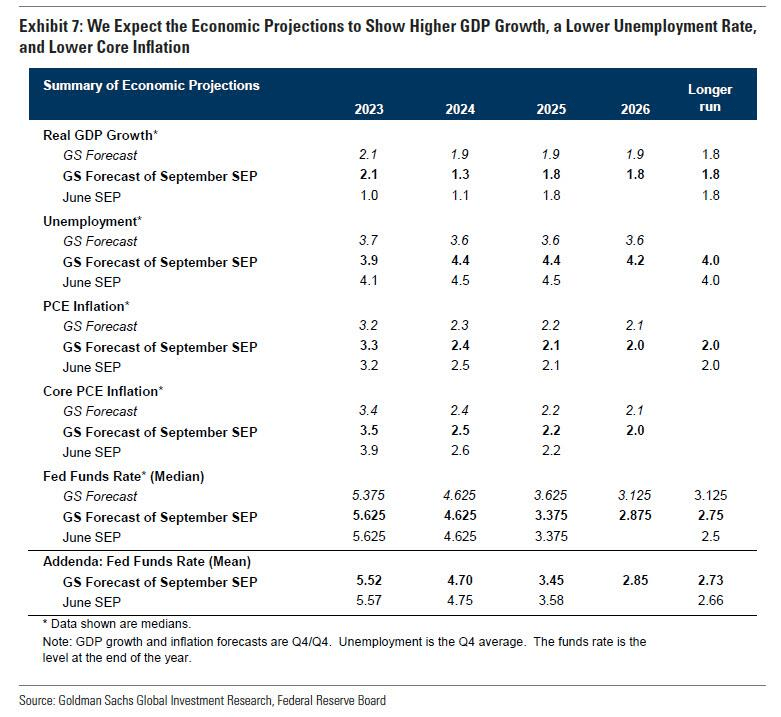
The median of indications will show that policymakers expect a decline in the benchmark rate of as little as 50 basis points or 75 basis points for 2024, compared with the 100 basis points their plot showed in June. I expect the Fed to leave its dot plot for 2023 intact, with the funds rate indicated at 5.6%.
Investors have, of late, swung between pricing rate cuts between the spring and the summer of 2024, which the Fed isn’t in a position to acknowledge based on the current strength of the US economy. The most definitive way of pushing back against that notion is to pencil in less by way of policy loosening than the central bank did in June.
Since that meeting, headline inflation has accelerated, while inflation stripped of housing and energy is still hovering above 4%. Meanwhile, the jobless rate has averaged 3.6% so far this year, around as low as we have ever seen historically — and way below what the Fed estimates will be required to bring the labor market into balance.
The resilience of the job market may, in fact, spur policymakers to pencil in a lower unemployment rate for 2024 than the 4.5% they indicated in June.
Consistent with that outlook, the Fed may be disinclined to revise its 1% growth projection for next year by more than a whisker.
Those revisions are likely to mean that the Fed has reduced scope to loosen policy at the first sign of material weakness in the economy.
Given that James Bullard quit the Fed in August, the new set of projections will be lacking a prescient hawk, whose dot plot has been a rewarding schemata to follow for investors in this cycle. That suggests the skew between the median of the Fed rate projections for next year and top range will be considerably narrower.
An interesting corner of the summary of economic projections to watch will be the Fed’s assumption on the neutral real policy rate, which neither stokes inflation nor crimps output. For several years now the Fed has penciled in a longer-run funds rate of 2.50% predicated on inflation of 2%, thereby projecting a neutral rate of 50 basis points.
However, researchers at the New York Fed reckon that the real neutral rate will reach a staggering 250 basis points by the end of the year, one reason why Treasury long-dated yields have been sticky this late in the policy cycle.
All told, the dot plot and summary of economic projections is what will guide the Treasury market reaction, and from the looks of it, the markets may not like what they see.
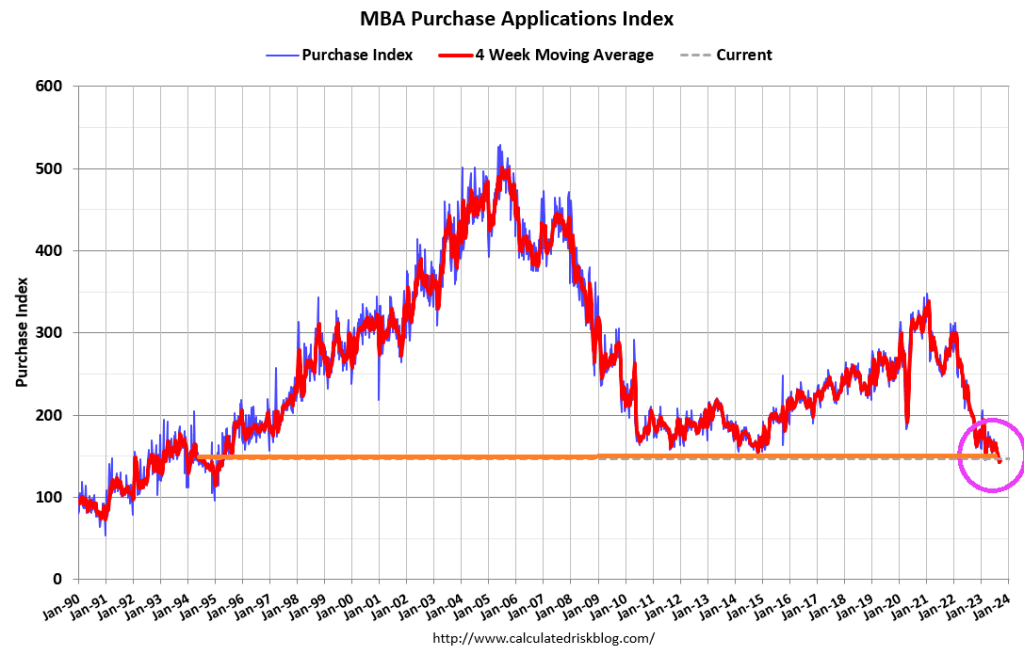
Mortgage applications increased last week, despite the 30-year fixed rate edging back up to 7.31 percent – its highest level in four weeks.
Mortgage applications increased 5.4 percent from one week earlier, according to data from the Mortgage Bankers Association’s (MBA) Weekly Mortgage Applications Survey for the week ending September 15, 2023. Last week’s results included an adjustment for the Labor Day holiday.
The Market Composite Index, a measure of mortgage loan application volume, increased 5.4 percent on a seasonally adjusted basis from one week earlier. On an unadjusted basis, the Index increased 16 percent compared with the previous week. The Refinance Index increased 13 percent from the previous week and was 29 percent lower than the same week one year ago. The seasonally adjusted Purchase Index increased 2 percent from one week earlier. The unadjusted Purchase Index increased 12 percent compared with the previous week and was 26 percent lower than the same week one year ago.
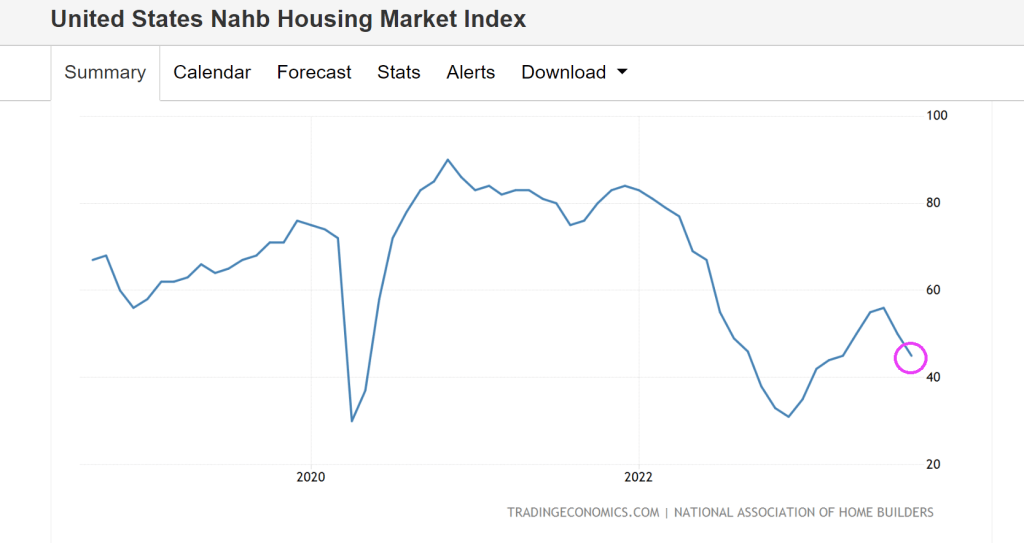
U.S. homebuilders are feeling pessimistic about their business for the first time in seven months, thanks to stubbornly high mortgage rates.
Builder confidence in the single-family housing market fell 5 points in September to 45 on the National Association of Home Builders/Wells Fargo Housing Market Index. The decrease follows a 6-point drop in August. Anything below 50 is considered negative.
Mortgage rates are up 152% under Biden’s Reign of Economic Error. Note the big assist the economy got from Covid-related Fed stimulus (red line). The Fed’s balance sheet is still over $8 trillion.
Call Bidenomics a new name: The Biden Blitzkrieg Bop since the administration launched a blitzkrieg attack on America’s middle class and low wage workers through bad energy policies and soaring inflation.
Clearly, economists were wrong earlier this year when they forecast an economic contraction that has yet to manifest. Could they be wrong now?
To be sure, economic growth, the labor market and consumer spending have proven unexpectedly resilient in the face of rising interest rates and elevated inflation. But there are still plenty of signs a recession might still be on its way.
1. An “uncertain outlook” from leading indicators
Many mainstay economic indicators measure the past. So-called leading indicators reflect what likely lies ahead.
“The outlook remains highly uncertain,” said Justyna Zabinska-La Monica, senior manager of business cycle indicators, at The Conference Board.
“The leading index continues to suggest that economic activity is likely to decelerate and descend into mild contraction in the months ahead.”
The index is based on 10 components, ranging from stock prices and interest rates to unemployment claims and consumer expectations for business conditions.
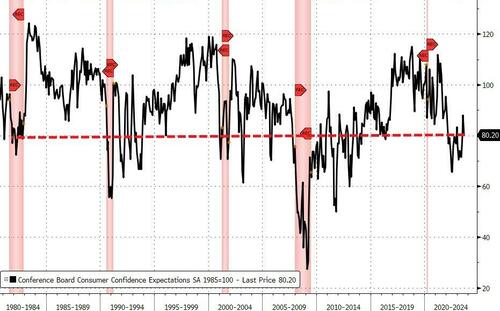
2. Consumer confidence is just a hair above recessionary levels
The Conference Board’s consumer confidence index came in at 80.2 in August, hovering just above 80, the level that often signals the U.S. economy is headed for a recession in the coming year.
It is also a leading indicator used to predict consumer spending, which drives more than two-thirds of U.S. economic activity.
3. Consumers are foregoing big-ticket purchases
Retailers report that their customers have shifted their purchasing habits, spending less on furniture and other big ticket items in favor of necessities. They have also been trading down on grocery items, ditching pricier cuts of beef and buying chicken.
“We saw some switch even to some canned products, like canned chicken and canned tuna and things like that,” Costco’s Chief Financial Officer Richard Galanti told analysts on a May conference call.
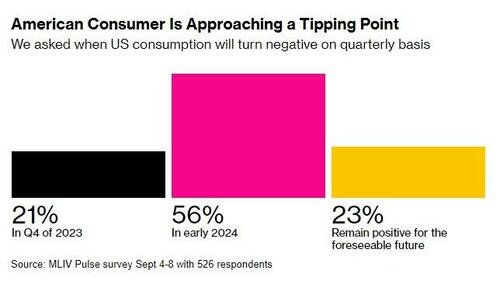
Consumer spending has remained one of the bright spots in the economy, but most investors expect consumer spending to slow by as early as next year, Bloomberg’s latest Markets Live Pulse survey found.
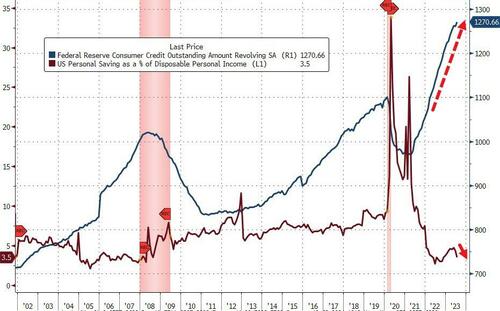
4. Credit cards are getting maxed out
U.S. consumers ran up their credit card debt past the $1 trillion mark for the first time last month, according to a report on household debt from the Federal Reserve Bank of New York.
Total household debt, which includes home and auto loans, has eclipsed $17 trillion.
The Federal Reserve Bank of St. Louis reports that credit card delinquencies, which are still low compared to periods such as the Great Financial Crisis, are on the rise.
5. Banks are increasingly reluctant to lend
The latest Senior Loan Officer Opinion Survey by the Federal Reserve reports tightening credit conditions across the board, from business loans to home mortgages and consumer credit.
“Regarding banks’ outlook for the second half of 2023, banks reported expecting to further tighten standards on all loan categories,” the Fed survey concluded.
“Banks most frequently cited a less favorable or more uncertain economic outlook and expected deterioration in collateral values and the credit quality of loans as reasons for expecting to tighten lending standards further.”
When banks pull back on lending, businesses curb their investments and consumers cut spending, and this trend is expected to continue for at least the rest of the year.
6. Corporate bonds are maturing and refinancing them will be costly
Goldman Sachs estimates that $1.8 trillion in corporate debt is coming due over the next two years and it will have to be refinanced at higher interest rates.
The expense will eat up more corporate resources, possibly leading to slower growth and investment.
Recessions occur as debt levels peak and borrowers begin to default.
Moody’s has already reported a surge in corporate defaults this year. In the first half of the year, it counted 55, that’s 53% more than the 36 that defaulted in all of 2022.
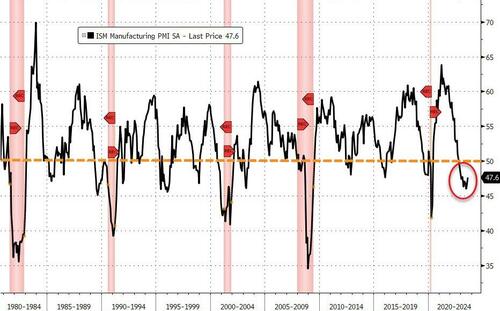
7. Manufacturing remains in a prolonged post-pandemic slump
Respondents to the ISM survey reported weaker customer demand because of higher prices and interest rates.
“Orders are in fact falling faster than factories are cutting output, suggesting firms will need to continue scaling back their production volumes into the near future,” writes Chris Williamson, chief business economist at S&P Global Market Intelligence.
“An increasing sense of gloom about the near-term outlook has meanwhile hit hiring and led to a further major pull-back in purchasing activity.”
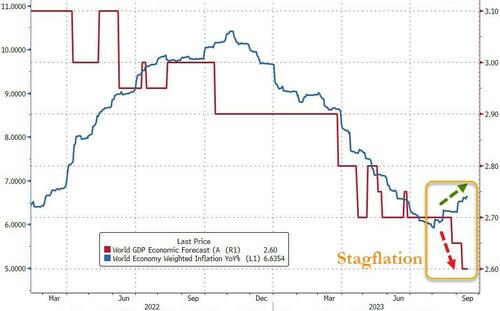
8. ‘Cascading crises’ could tip the balance of a slowing global economy
China, a growth engine for the past 40 years, is still struggling to recover from the pandemic, global economic growth has fallen below long-term average, and the ailing world could pull the U.S. economy down with it.
Like a plane crash, every economic disaster stems from a confluence of mishaps. Along these lines, G20 nations on Saturday put out a dire warning:
“Cascading crises have posed challenges to long-term growth,” the group said.
“With notable tightening in global financial conditions, which could worsen debt vulnerabilities, persistent inflation and geoeconomic tensions, the balance of risks remains tilted to the downside.”
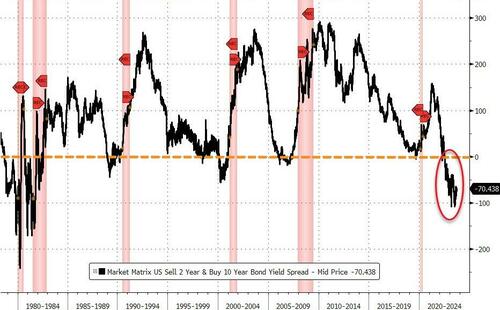
9. The yield curve, a classic recessionary signal, is still inverted
Investors should be paid more for taking a long-term risk than they should for a short-term risk. That’s why the yield on a 10-year Treasury is supposed to pay a higher yield than a 2-year Treasury.
When this is not the case, it’s called an inverted yield curve, and it has long been considered a sign that a recession is due within the next 18 months.
The yield curve for 10-year and the 2-year Treasury has been inverted since July 2022. It’s been inverted for so long that many observers have given up on its reliability — though it still hasn’t been 18 months since it first inverted.
As for history, the yield curve last inverted was in late 2019, just before the pandemic U.S. recession.
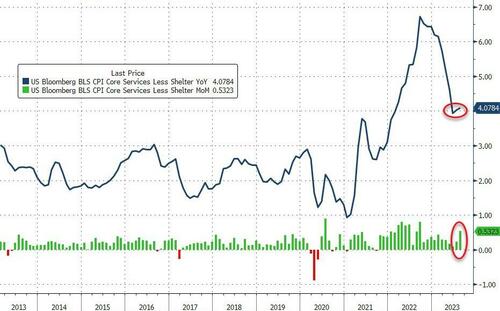
10. Inflation is sticky, and the Fed isn’t done
The soft landing scenario that is so widely embraced is based on observations that inflation has dropped precipitously as the economy continues to grow at a healthy pace and the labor market is still holding strong with the unemployment rate at 3.8%.
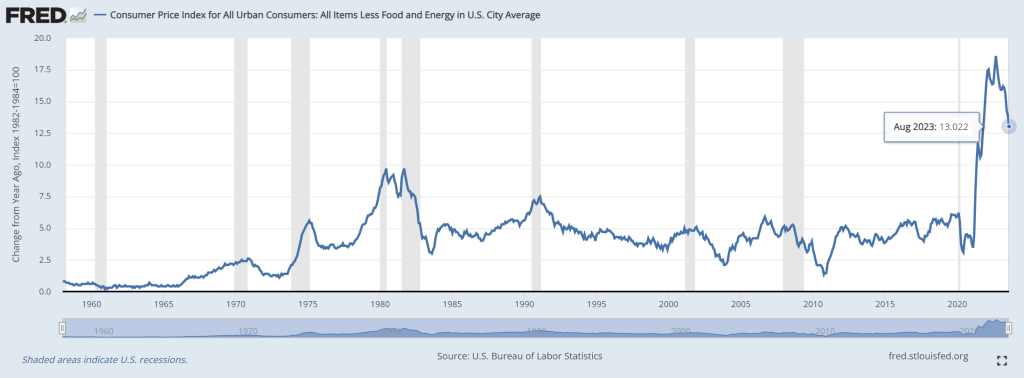
The Fed, which has raised interest rates 11 times since March 2022 to curb inflation, can now take a bow. The consumer price index, which measures inflation, has come down from a peak of over 9% in June 2022 to 3.2% on its last reading in July.
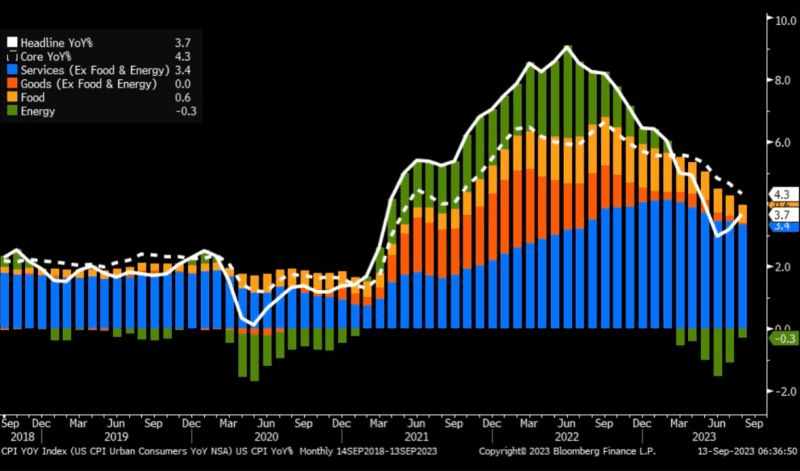
The latest reading on CPI, for August, came out Wednesday, and re-accelerated more than expected, with The Fed’s most-watched ‘Core Services CPI Ex-Shelter’ back above 4.00%…
Meanwhile, the Fed, which next meets on Sept. 19-20 to decide on interest rates, is holding fast to its 2% target for inflation and will keep rates higher for longer, or possibly even raise them further to meet that goal.
Wall Street traders are not expecting another increase this month, according to the CME FedWatch tool, which is based on Fed funds futures trading.
Policy makers are still waiting to see what happens next after raising rates to their highest level in 22 years. Perhaps those actions have already sent the economy on a path of contraction. Or perhaps they haven’t done enough to continue slowing inflation.
Sticky inflation presents on ongoing risk of a recession.
“I believe we must proceed gradually,” Dallas Fed President Lorie Logan said last week, “weighing the risk that inflation will be too high against the risk of dampening the economy too much.”
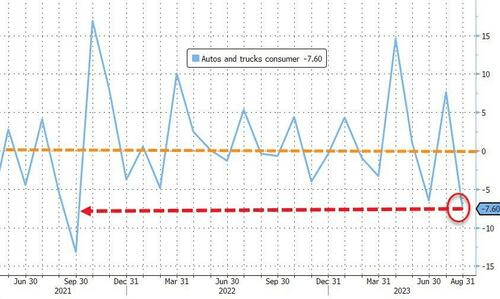
The Big Three auto companies and the UAW are suffering under Bidenomics (code for massive green energy payoffs to large donors). As I pointed out yesterday, the auto industry suffered a large decline of -7.60% in Q2 as a result of rising car prices (going electric is EXPENSIVE) and increasing consumer debt to cope with Bidenomics.
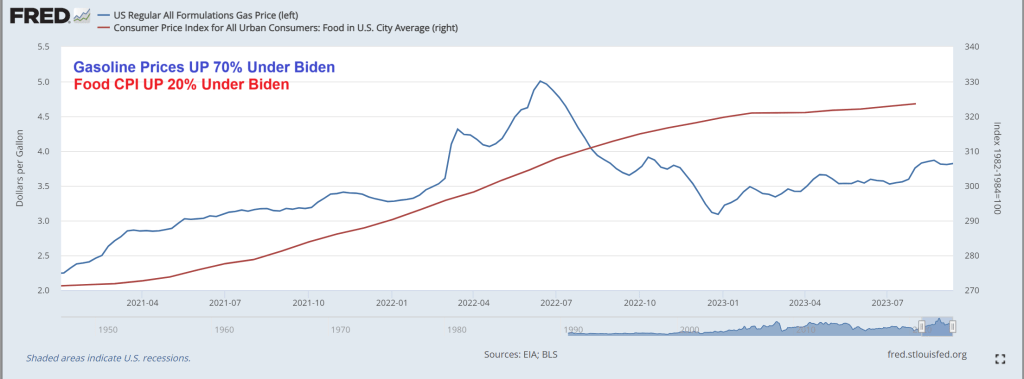
So when we consider the UAW’s demands of $20 an hour hike in pay, you have to consider that under “Union Joe” gasoline prices are up 70%, and food CPI is up 20%. So a 20% pay hike won’t even cover the cost of commuting and will just cover the increased food costs.
The shortened work week to 32 hours? How European of the the UAW.
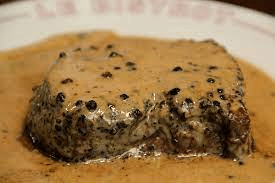
But perhaps they will have the extra time to travel to Paris France to eat some beef au poivre at Le Bistrot Paul Bert.
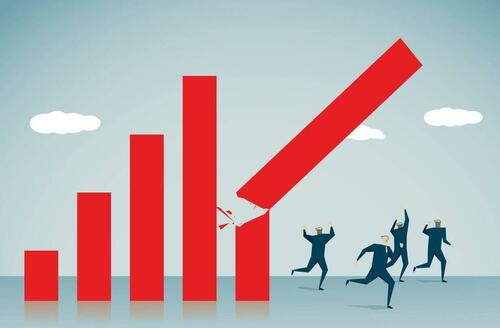
Shape of things in the US economy. But a better tune to descible what is happening is over, under, sideways down.
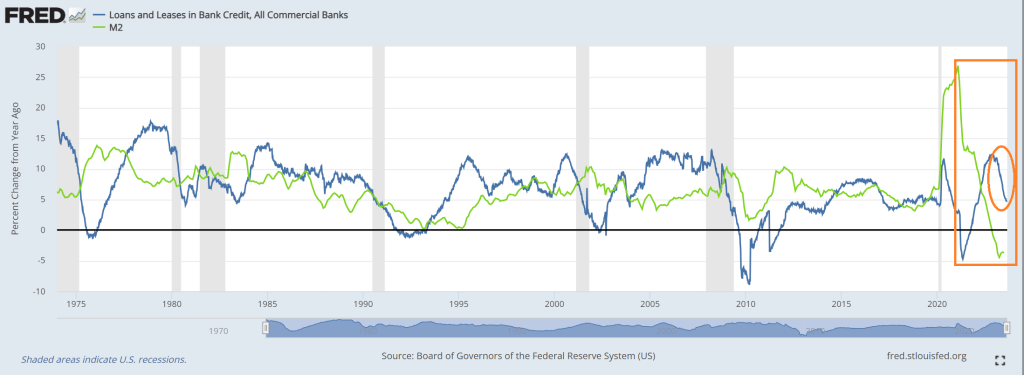
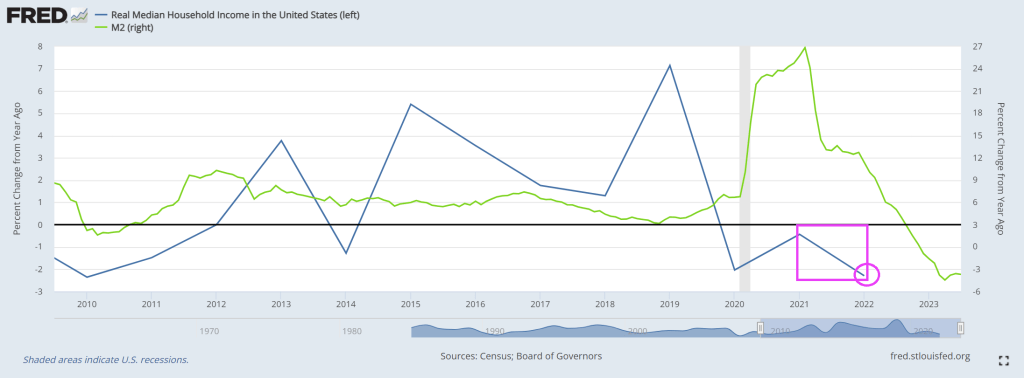
For example, look at this chart of loans and leases at commercial banks, since last year (YoY). The growth rate is plunging rapidly. Of course, M2 Money growth has already crashed.
Loan delinquenices? The trend in delinquencies is rising as consumers struggle with inflation.
When asked about future Fed policies, Powell angrily replied “I’m a man.” Just kidding, but that is almost as nonsensical as his other answers.
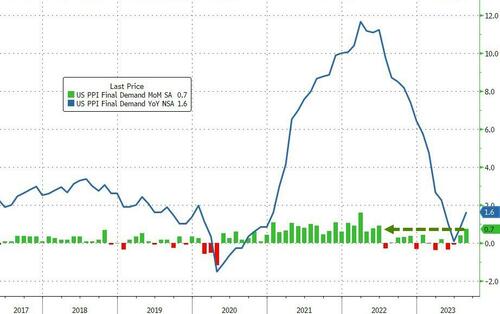
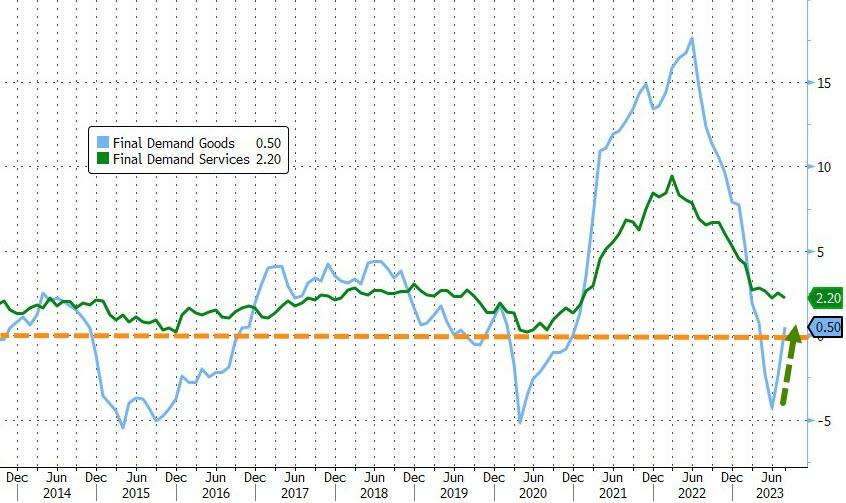
Producer Prices rose 0.7% MoM in August (up from +0.3% in July and hotter than the +0.4% exp). That is the hottest PPI since June 2022, and pushed YoY prices up 1.6%…
Source: Bloomberg
Goods prices are reaccelerating fast, now back into inflation YoY (as Services cost growth slowed only modestly)…
Source: Bloomberg
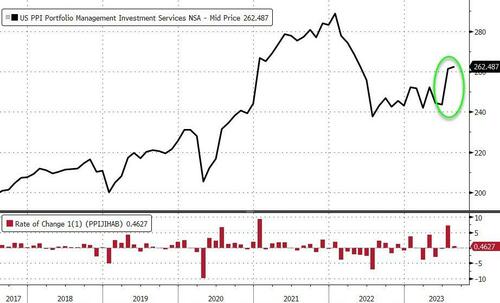
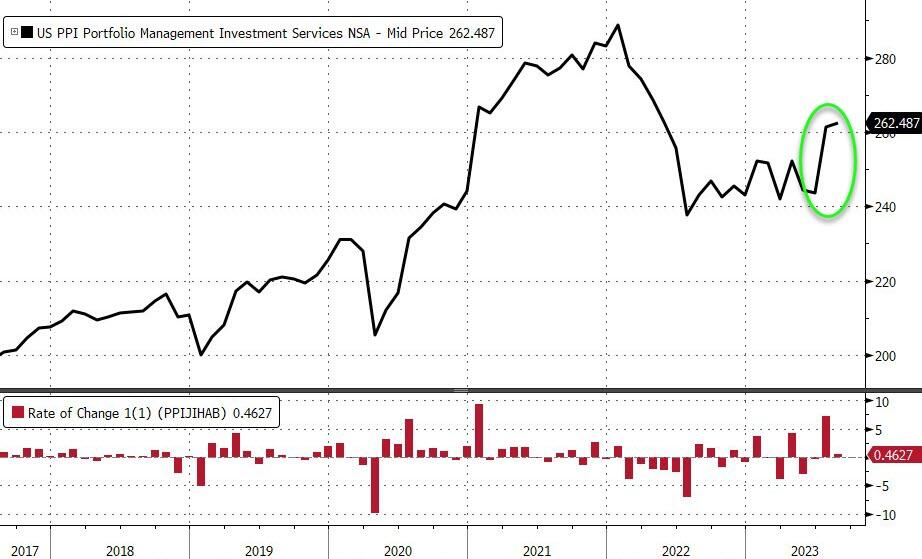
As a reminder, much of last month’s PPI rise was driven by a big jump in portfolio management costs – as stocks soared. August saw a further rise in those costs…
Source: Bloomberg
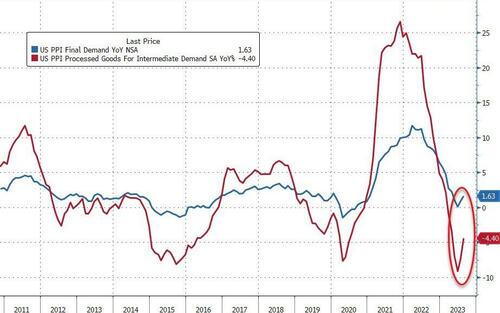
More problematically, the pipeline for PPI appears to have inflected as intermediate demand is re-accelerating…
The Federal Reserve, the most powerful Socialist machine on the planet, is considering rate their target rate after some bad economic news.
First, real median household income (released yesterday for 2022) showed a decline of -2.3%. That is the worst decline 2010 when Biden was Vice-president. Notice that real median household income has never been positive under Biden (I doubt if PressSec Jean Pierre will brag about this!)


You must be logged in to post a comment.