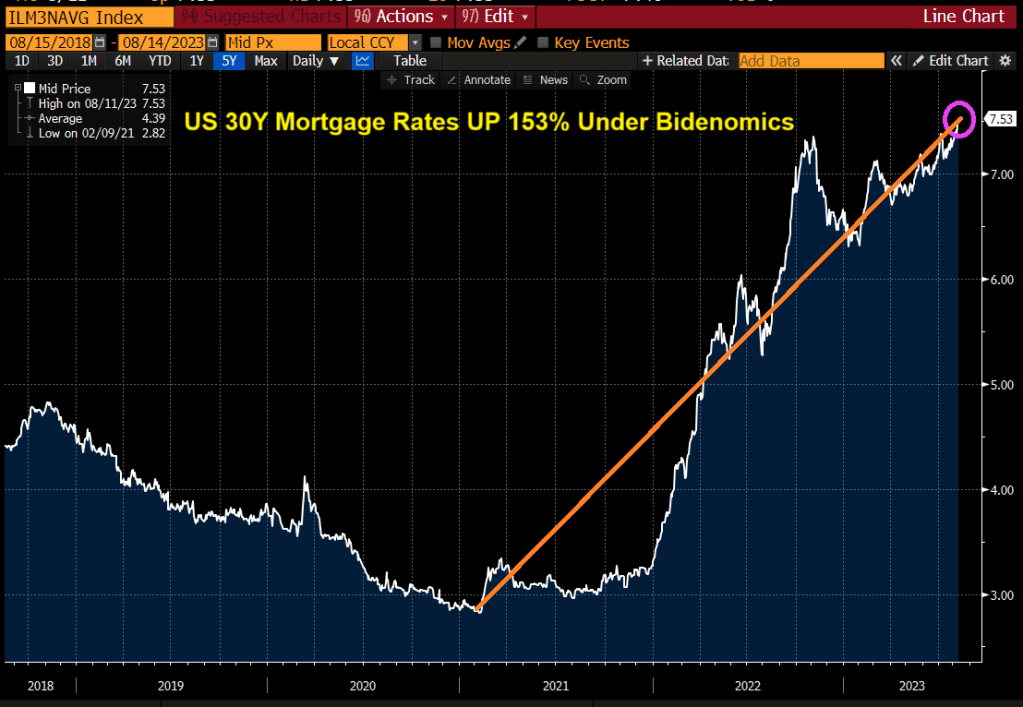
Rates on 30-year mortgages in the US are now the highest since 2000, at 7.53%. Mortgage rates are now up 153% under Bidenomics. Rates have gone from sub 3% to above 7.50% under Inflation Joe.
US Treasury yields are playing catch-up from Yellen’s “Too low for too long” monetary policies.
Yes, in part we are playing catch-up from Yellen’s Reign of Error as Fed Chair (keeping rates too low for too long). Only in Washington DC, does gross incompetance warrant a promtion to US Treasury Secretary. Career half-wit Mean Joe Biden is El Presidente and acting like a third world dictator.
Example? Take Checkable Deposits of the to 1% (blue line) of wealth compared to the bottom 50% of wealth (red line) after The Fed cranked up monetary stimulus to combat the Covid shutdowns.
On the wealth side, Covid-related monetary stimulus benefitted the top 1%.
But the middle class is expericing a tighening of credit coutesy of Cap’n Crunch (Fed Chair Powell).
The US Federal Reserve has not created a CBDC … yet. Our woefully corrupt El Presidente Jose Biden (more of a Latin American, tinhorn Banana Republic dictator than as US President) has ordered the study of a CBDC. Since everything Biden touches reeks of “boodle” I am suspicious as to Biden’s motives.
There are some positives to a CBDC, mostly with WHOLESALE CBDCs. Wholesale CBDCs are similar to holding reserves in a central bank. The central bank grants an institution an account to deposit funds or use to settle interbank transfers. Central banks can then use monetary policy tools, such as reserve requirements or interest on reserve balances, to influence lending and set interest rates.
It is the RETAIL CBDC that is the cause for concern. Retail CBDCs are government-backed digital currencies used by consumers and businesses. Retail CBDCs eliminate intermediary risk—the risk that private digital currency issuers might become bankrupt and lose customers’ assets.
There are two types of retail CBDCs. They differ in how individual users access and use their currency:5
Token-based retail CBDCs are accessible with private keys or public keys or both. This method of validation allows users to execute transactions anonymously.
Account-based retail CBDCs require digital identification to access an account.
The real problem with CBDCs is that The Federal Reserve and Federal government can trace EVERY EXPENDITURE of a household. Including political contributions, firearm and ammo purchases, etc. With this much information at their disposal, this allows for DIRECT CONTROL of the population.
Given that we now know that Biden used social media platforms to pass false narratives and repress alternative views, can we trust The Federal Reserve with this much information about consumer spending? Of course not. This is a consolidation of censorship and repression of individual liberties.
Yes, paper and coin currency serve a purpose in society as an alternative to barter. Imagine trying to buy a Ford F-150 Lightning (LMAO!) using barter? Ok, we have a system of credit where you can obtain a car loan. But barter, an old system of exchange, is inefficient. That leaves us with physical currency (certain restaurants only allow payment in cash). But many consumers are using Debit Cards as a substitute for physical cash, so this is a giant step towards RETAIL CBDC already.
Alternatives to the US Dollar? Of course, gold and silver are popular choices historically. Then we have rise of the cryptocurrencie market, which some Congressional members want heavily regulated or banned. Why? First, there are some shady crypto activities (see Sam Bankman-Fried and his shady political contributions to Democrats). Second, cryptos are volatile. Why is this of any interest to Congress? Third, cryptos can be used for illegal activities (but so can cash. Just watch Netflix’s Narcos for the shipment of US Dollars to Columbia in mattresses, etc. No, the goal of some members of Congress is to overregulate or obliterate alternatives to the US Dollar … unless The Federal government does it, like The Fed’s CBDC!
With Biden’s Department of Injustic and several Democrat state Attorney Generals indicting Biden’s top political opponent Donald Trump with the intent of preventing him from campaigning for President (sounds so much like other Totalitarian regimes in history), trust in the Federal government and Federal Reserve are almost nonexistant.
Here is chart of the purchasing power of the US Dollar (blue line) since the creation of The Federal Reserve system and core CPI YoY which is still relatively high at 4.86%. That is over twice The Fed’s target rate of 2%.
I am sure that Billions Biden doesn’t understand moral hazard risk. For him, there is no risk, But for the middle class and lower wage worker class, CBDC represent a clear moral hazard risk, particularly if cash vanishes and Congress tries to ban cryptos.
The face of why so many Americans don’t trust The Fed. Or The Biden Administation.
Or this face, Urban Joe Biden (Stalin was Country Joe).
Bidenomics, which is also Yellenomics (the former Fed Chair and current Treasury Secretary) has The Good, The Bad and The Ugly to say for it.
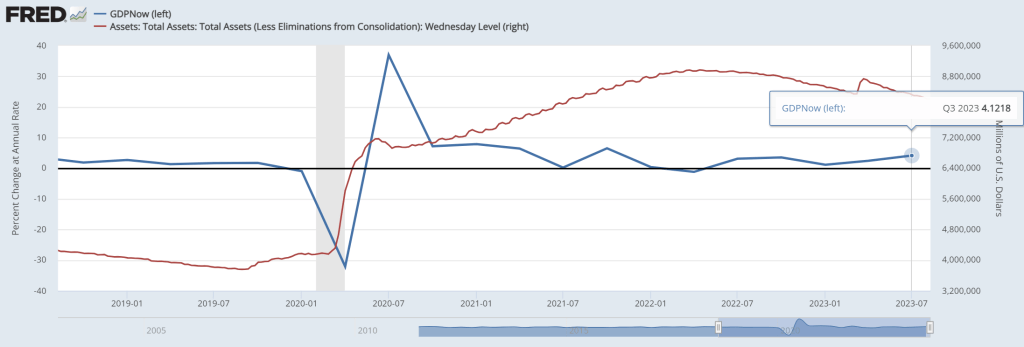
First, The Good! The Atlanta Fed’s GDP Now real time GDP tracker has Q3 GDP at … 4.12%. Pretty good, but bear in mind that there is still more than $8 trillion in Fed Monetary Stimulus outstanding (aka, Yellenomics).
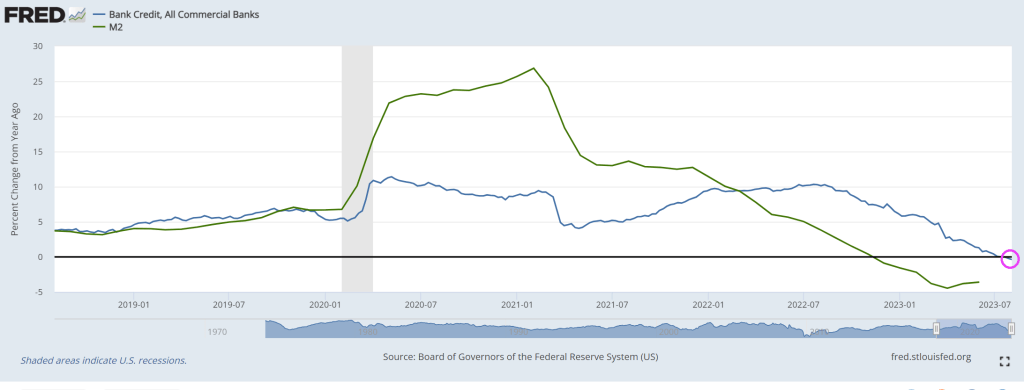
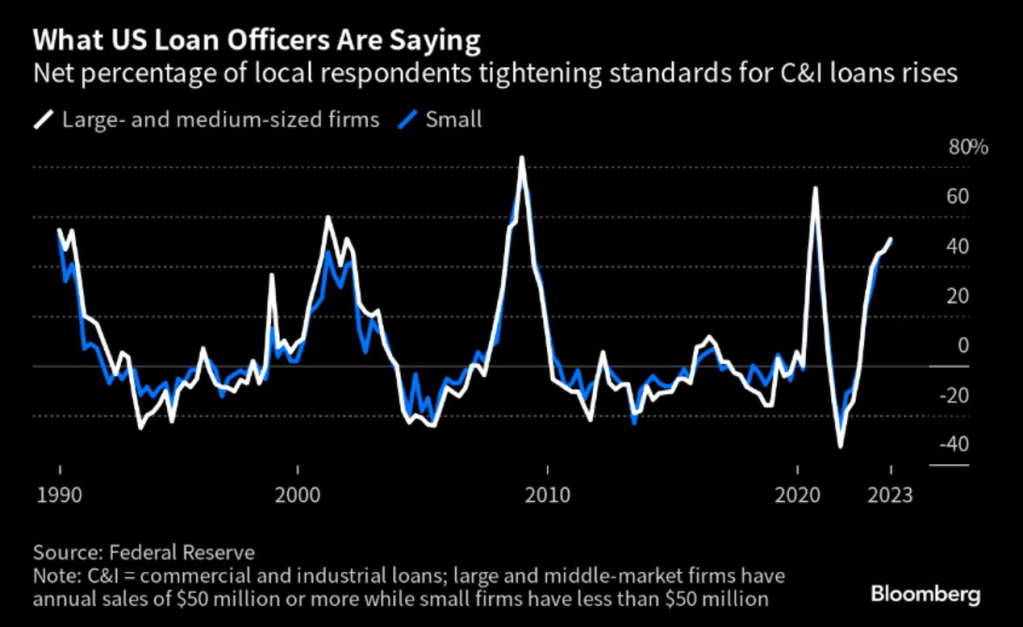
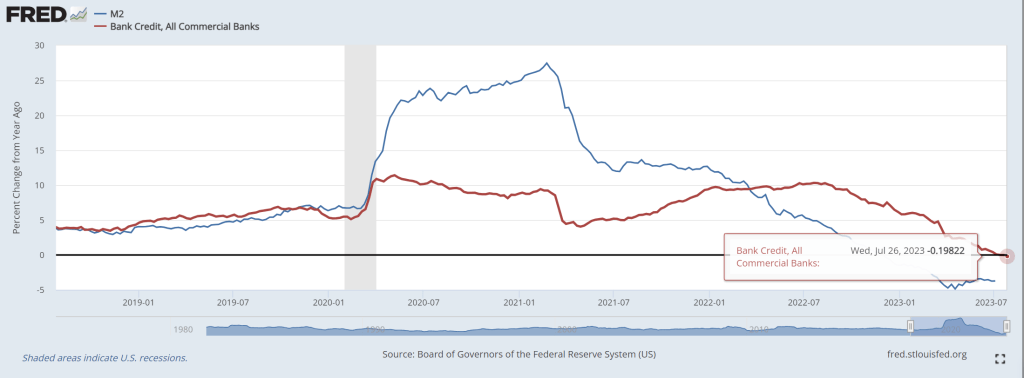
Second, The Bad. Bank credit growth is now negative.
As lenders are tightening credit standards for commercial and industrial loans.
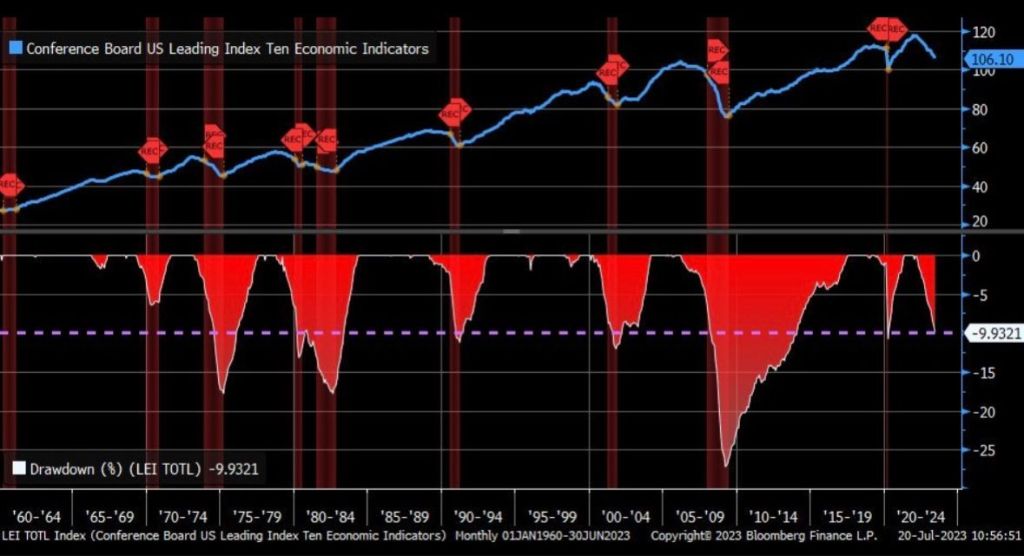
The ugly? There are several candidates for this dishonor.
One, The Conference Board’s leading economic indicators is down -10.
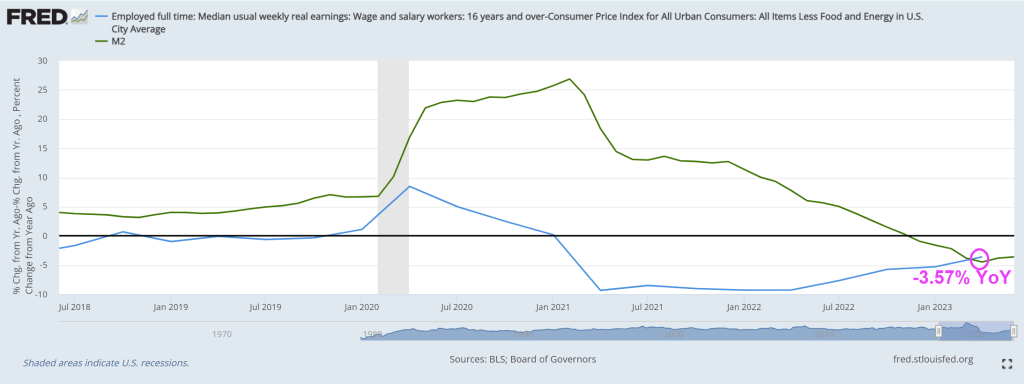
Two, REAL median weekly earnings growth remains negative at -3.57% YoY.
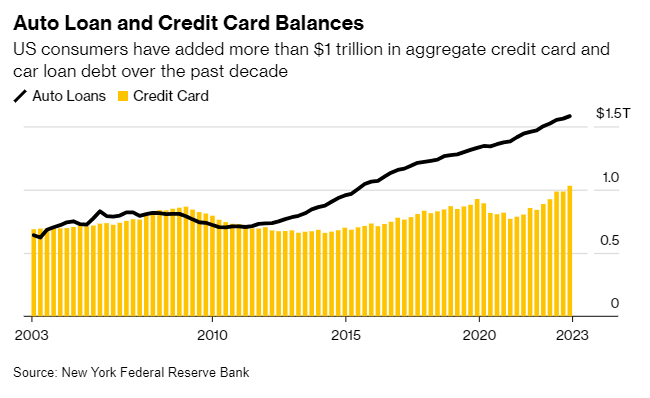
Third, auto loan and credit card balances are at $1.5 TRILLION making further consumer credit more difficult to finance GDP growth.
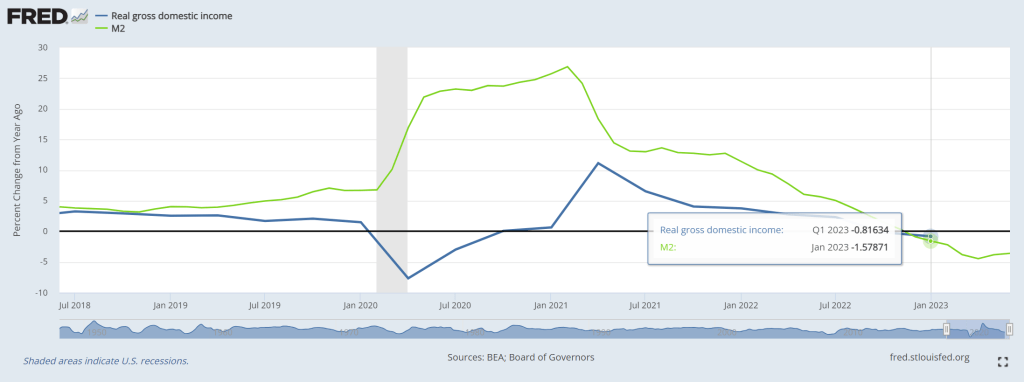
Fourth, Real Gross Domestic Income growth was negative in Q1 2023.
I could go on and on about the negatives of Bidenomics (e.g., massive distortion of Federal spending towards green energy and big donors). Isn’t the earth moving closer to the Sun in its elliptical orbit?? HOW is spending trillions on green energy work as we move closer to the Sun??
During the COVID-19 pandemic the occurrence of remote work jumped, out of sheer necessity. The technology was already available, but the pandemic accelerated its adoption and bypassed the hesitation of employers to allow people working from home. In many cases, remote work has been successful and therefore seems to have become a permanent feature, often in hybrid form. For employers, it has become an employee benefit to attract people in a tight labor market and it saves on office space costs. The flipside of the latter is that demand for office space has seen a structural downward shift. It is estimated that the underlying value of office space in New York City has permanently declined by 39%. This suggests that at current prices, there is a bubble in commercial real estate. In this special we are particularly interested in the implications for financial stability and the economic outlook. First we take a look at the development of commercial real estate prices and commercial real estate lending. Then we discuss the Fed’s recent stress test on large banks that included a large decline in commercial real estate prices. In contrast to the Fed’s exercise, we show that distinguishing between large and small banks provides a sharper picture of the vulnerabilities in the US economy. In particular, the connection between commercial real estate and small banks, through commercial real estate lending, could pose a threat to financial stability and make a recession worse.
Commercial real estate heading south
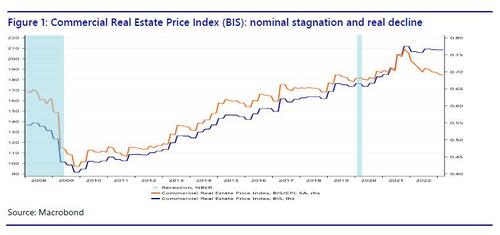
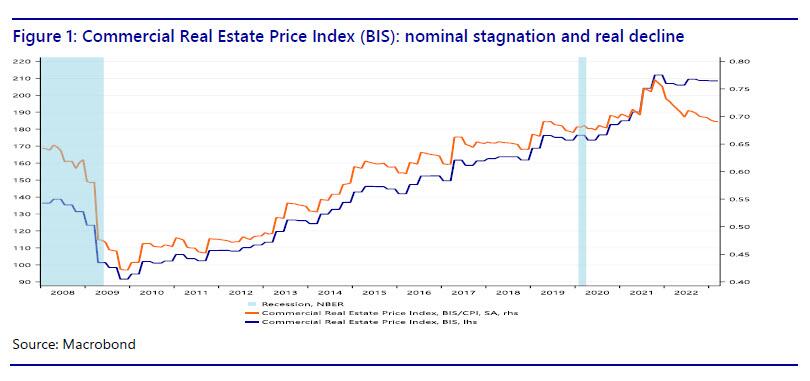
If we plot the BIS commercial real estate price index, it is clear that since the Great Recession, commercial real estate (CRE) prices have more than doubled in nominal terms (the blue line in Figure 1), but have moved sideways since 2021. This suggests that prices have reached a plateau. However, in recent years inflation has obscured the movement of CRE prices in real terms (the orange line), which shows a peak in 2021, but since then there has been a decline, almost to the level during the COVID-19 pandemic. In other words, CRE prices are already failing to keep up with inflation. Is this an indication that the CRE bubble is already deflating? With nominal CRE prices remaining elevated, most of the nominal price correction is likely still to come. If the 39% estimate by Gupta et al. for New York City is representative for the entire United States, we are heading for a major decline in CRE prices.
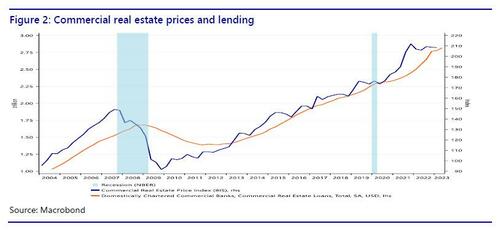
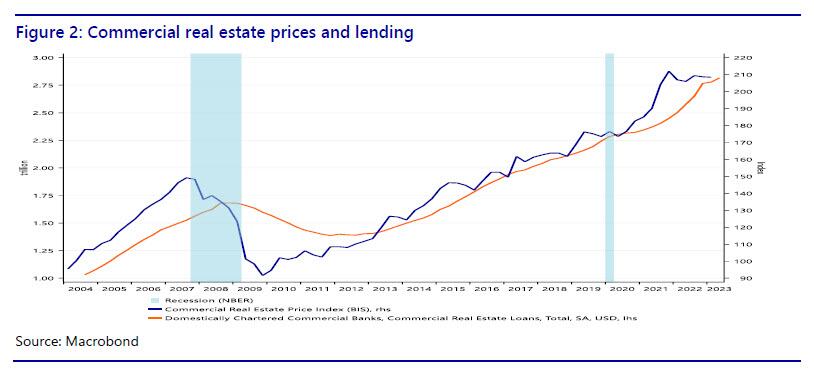
We can also plot the BIS index against CRE lending to show3 that rising prices for commercial real estate sparked a credit boom in commercial real estate (Figure 2). Given the academic literature linking financial crises to credit booms and busts, this should be cause for concern. Moreover, Minsky (1986) notes that an emphasis by bankers on the collateral value and the expected values of assets (instead of cashflows) is conducive to the emergence of a fragile (as opposed to a robust) financial structure.
If excess demand for office space pushed up commercial real estate prices, and if that increased CRE lending by banks, what does a structural downward shift in demand for office space mean? If CRE prices are deflating, what does that mean for the indebted CRE sector? Is this going to lead to defaults? And what does that mean for the banks that did the CRE lending? Is the deflation of the CRE bubble a threat to financial stability? Also note that due to the steep hiking cycle by the Fed, some companies in the CRE sector may find it difficult to refinance their loans at substantially higher rates.
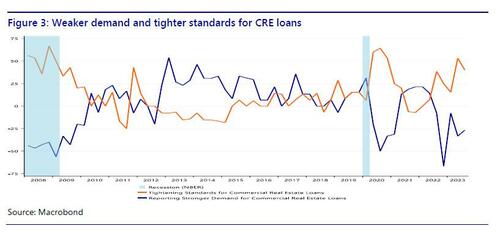
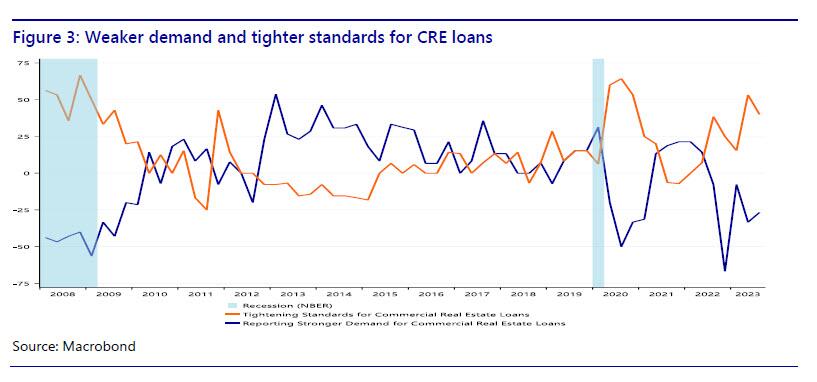
We can dig deeper by looking at the demand and supply developments in CRE lending. If we look at the Fed’s SLOOS data (figure 3), it is clear that demand for CRE loans strengthened especially between 2012 and 2017. Lending standards loosened between 2012 and 2015. This era coincides with a strong rise in the CRE price index, which may have motivated banks to expand CRE lending. Demand for CRE loans weakened during the pandemic, then bounced back as the economy reopened, but headed south again in 2022. Loan standards tightened during the pandemic, then loosened again when the economy rebounded, but have tightened since 2021. In other words, there seems to be a correlation between CRE prices and demand and supply developments in CRE lending. Currently, both are heading south, if we look at CRE prices in real terms and CRE lending in terms of net demand. It seems that rising CRE prices sparked a credit boom in CRE and now that the CRE price bubble is deflating, the CRE sector has less appetite to borrow and banks are tightening their lending standards.
The Fed’s incomplete stress test
CRE prices are falling in real terms and credit for the CRE loans is tightening. Does this pose a problem to the economy? Not if we believe the Fed’s June 28 press release that accompanied the annual bank stress test. The stress test looked at “a severe global recession with a 40 percent decline in commercial real estate prices, a substantial increase in office vacancies, and a 38 percent decline in house prices. The unemployment rate rises by 6.4 percentage points to a peak of 10 percent and economic output declines commensurately.” However, according to the Fed “all 23 banks tested remained above their minimum capital requirements during the hypothetical recession.” Therefore, the central bank concluded that “large banks are well positioned to weather a severe recession and continue to lend to households and businesses even during a severe recession.” However, one line in the press release reveals the main problem with the Fed’s stress test: “The banks in this year’s test hold roughly 20 percent of the office and downtown commercial real estate loans held by banks.” So where is the remaining 80%? If the stress test considers a huge decline in commercial real estate prices, it might be relevant to know how this affects the banks that hold 80% of the CRE loans made by banks. Therefore we take a closer look at CRE lending by large and small banks in the next section.
Bank lending: large vs small banks
We already saw in figure 2 that the rise in CRE prices until 2022 was accompanied by an increase in CRE lending. However, there is more to this story of we take a closer look at who has been doing the lending. So far we looked at aggregate bank lending to the CRE sector, without distinguishing between different types of banks. However, a closer look at the banking sector reveals a disturbing vulnerability that could be a threat to financial stability.
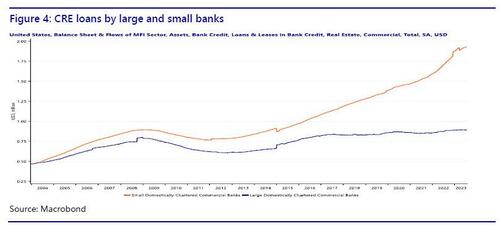
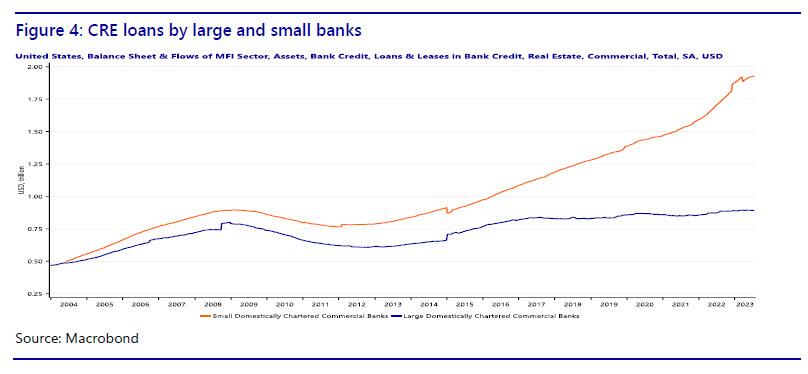
The Fed data on commercial banks distinguish between large and small banks. Large domestically chartered commercial banks are defined as the top 25 domestically chartered commercial banks ranked by size. Small domestically chartered commercial banks are defined as all domestically chartered banks outside of the top 25. Note that according to this definition a bank of say $80 billion would still be considered ‘small.’ In figure 4 we show how CRE lending has evolved, distinguishing between large and small banks.
It turns out that CRE lending by large banks has hardly increased in the last 15 years, while at the same time CRE lending by small banks has more than doubled. In other words, the growth in loans to commercial real estate has come from small banks. In fact, small banks have taken over the role of main provider of commercial real estate loans. Therefore, the Fed’s stress test omits the most relevant part of the banking sector for commercial real estate. While commercial real estate lending by large banks has remained stable since 2006, commercial real estate lending by small banks has increased rapidly. We could even talk of a credit boom in commercial real estate loans provided by small banks.
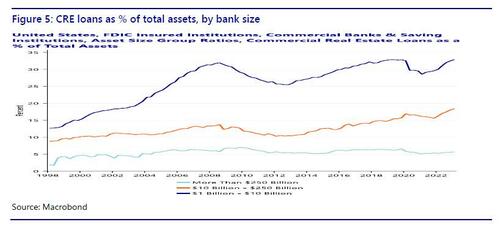
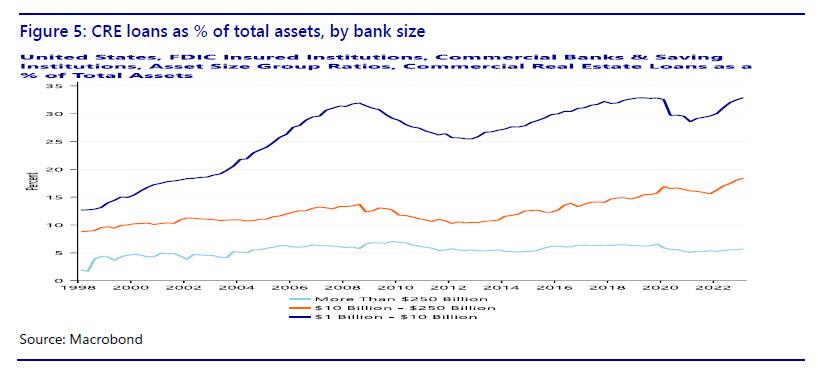
Whether the increased share of CRE lending by small banks is a problem also depends on the relative importance of CRE loans for small banks (Figure 5). FDIC data (Quarterly Banking Profile) distinguish at least three classes of asset size: more than $250 billion, $10-250 billion, and $1-10 billion. The first class contains only large banks as defined by the Fed stress test, the second class is a mix of large and small banks, the third class only contains small banks. While for the largest banks, CRE loans were only 5.7% of total assets in the first quarter of 2023, for the smallest banks this is 32.9%! For the intermediate-size banks the CRE loans are 18.4% of assets. So not only is 80% of the CRE bank loans made by small banks, these loans also make up a much larger fraction of the balance sheet of small banks.
Finally, it is important to note that small banks are regional banks. In fact, the US has so many small banks because for much of its history it was difficult for banks to open a branch in another state. This legislation has been abolished, and the amount of banks in the US has fallen, but there are still many small banks with predominantly regional clients. This means that CRE risk in small banks is also regionally concentrated. Instead of a diversified nationwide CRE loan portfolio, a small bank tends to make loans to local borrowers. Consequently, if commercial real estate in a region turns sour, the small banks in the area will be highly exposed. Bubble or not, any adverse development in the CRE sector is going to hit small banks harder than large banks.
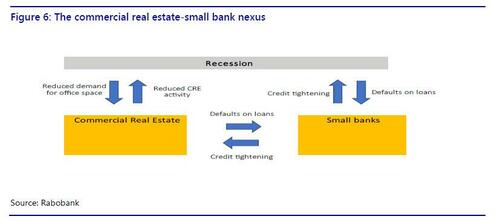
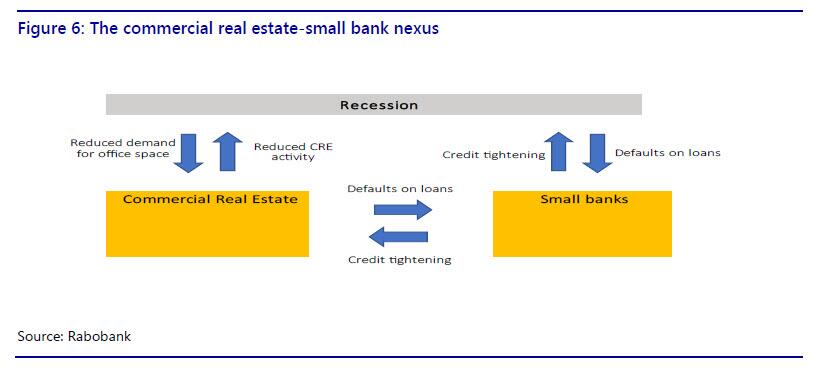
The commercial real estate-small bank nexus brings together two vulnerable sectors that could rapidly deteriorate in a self-reinforcing loop. Small banks have already shown vulnerable to higher interest rates and deposit outflows in March and commercial real estate is high on the list of financial stability concerns of US regulators. We have shown that the two sectors are critically connected and in the next section we speculate on the feedback mechanisms that could arise and make things worse.
Roads to ruin: feedback mechanisms
The commercial real estate-small bank nexus allows for several scenarios in which both sectors could be destabilized. In the first two scenarios, a crisis occurs in one sector, causing problems in the other sector. Tighter credit and reduced activity in the CRE sector could push the economy into a mild recession. In the third scenario, a mild recession causes problems in both sectors, which could then reinforce each other and make the recession worse.
In scenario 1, a small banking crisis leads to problems in CRE. Given that the majority of CRE loans have been made by small banks, continued problems for small banks, caused by or leading to deposit flight, could force them to tighten lending to the CRE sector. This would reduce the supply of credit to CRE, causing additional problems for the CRE sector, on top of office vacancies and stagnating prices.
In scenario 2, a CRE crisis causes small banks to collapse. Even if small banks stabilize in the near future from the recent deposit flight problems, they could subsequently be dragged down by a crisis in the CRE sector. Defaults in CRE will asymmetrically hurt small banks rather than large banks, because of the concentration of CRE risks at small banks. This could lead to a new round of deposit flight from small banks to large banks and money market funds. The losses on loans and loss of funding could be lethal to small banks.
In scenario 3, a mild recession could cause a small banking crisis and a CRE crisis. In turn, this could lead to a more severe recession. A mild recession, for example caused by the Fed’s hiking cycle, will hurt the banking sector and the CRE sector at the same time. In particular, a recession would further reduce demand for office space. This will add to the problems in the CRE sector. Increased CRE defaults will hurt banks, especially the smaller ones with relatively more exposure to CRE. Losses on CRE loans will force banks to tighten credit, including for the CRE sector. The self-reinforcing problems in the two sectors could further drag down the overall economy, making the initially mild recession more severe. Specifically, tighter credit and reduced activity in the CRE sector will drag down GDP growth further.
We summarize the specific feedback mechanisms in the commercial real estate-small bank nexus in figure 6.
More broadly, we already saw in March how problems at small banks had an immediate adverse impact on financial markets. In combination with a faltering CRE sector this could severely undermine confidence among investors, consumers and businesses. This would have a broad-based negative impact on GDP growth.
Conclusion
COVID-19 appears to have a lasting negative impact on demand for commercial real estate. The federal regulators are aware of the risks in commercial real estate, but the Fed’s stress test provides a false sense of security. The finding that large banks are able to absorb losses on CRE loans in case of a CRE crisis is encouraging, but the bulk of CRE bank loans has been provided by small banks. In fact, while CRE lending by large banks has been stable, there has been a credit boom in CRE loans provided by small banks, more than doubling the amount since 2006. What’s more, small banks are more vulnerable to the CRE sector in terms of exposure and have already been hit by deposit outflows earlier this year. The commercial real estate-small bank nexus exposes the US economy to a vulnerability that could threaten financial stability and either cause a recession or make a recession more severe.
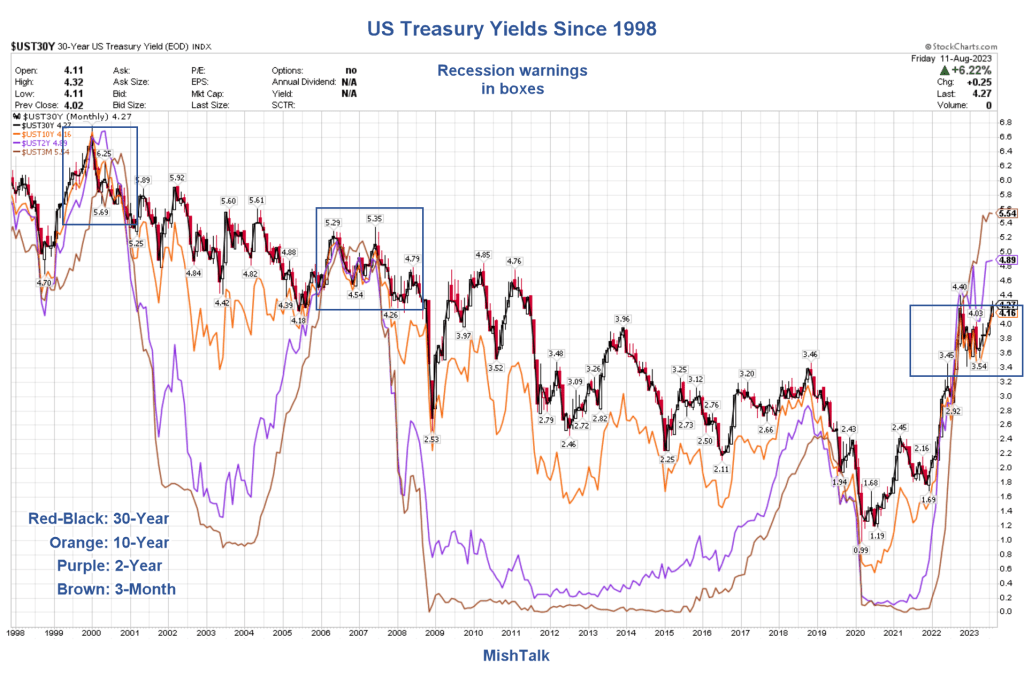
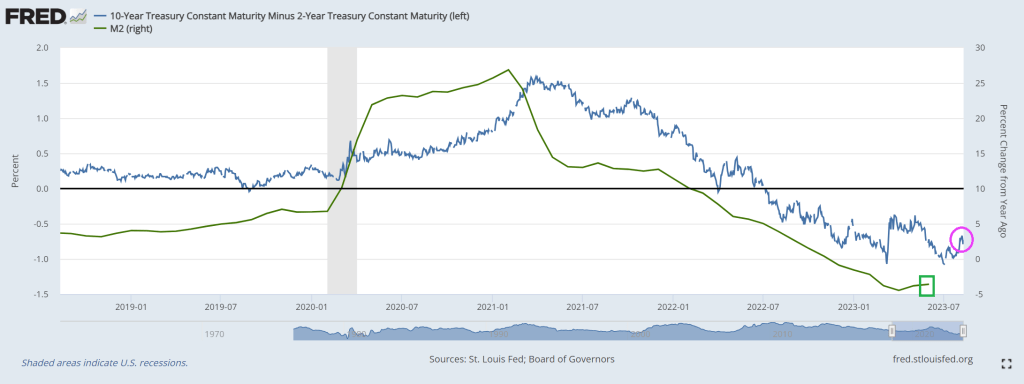
And another day, another inverted 10Y-2Y yield curve!
This chart goes along with negative bank credit growth.
Lastly, we have the Conference Board’s leading index plunging to -10!
Thanks in part to Cap’n Crunch, Fed Chair Jerome Powell!
I don’t know whether Cap’n (Credit) Crunch is Fed Chair Powell or the big spender Boss (Tweed) Biden?
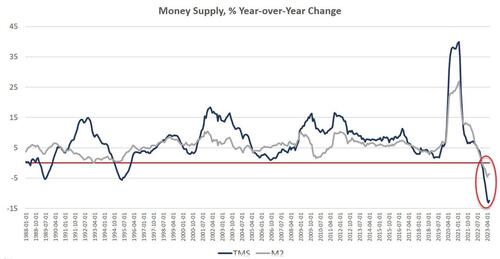
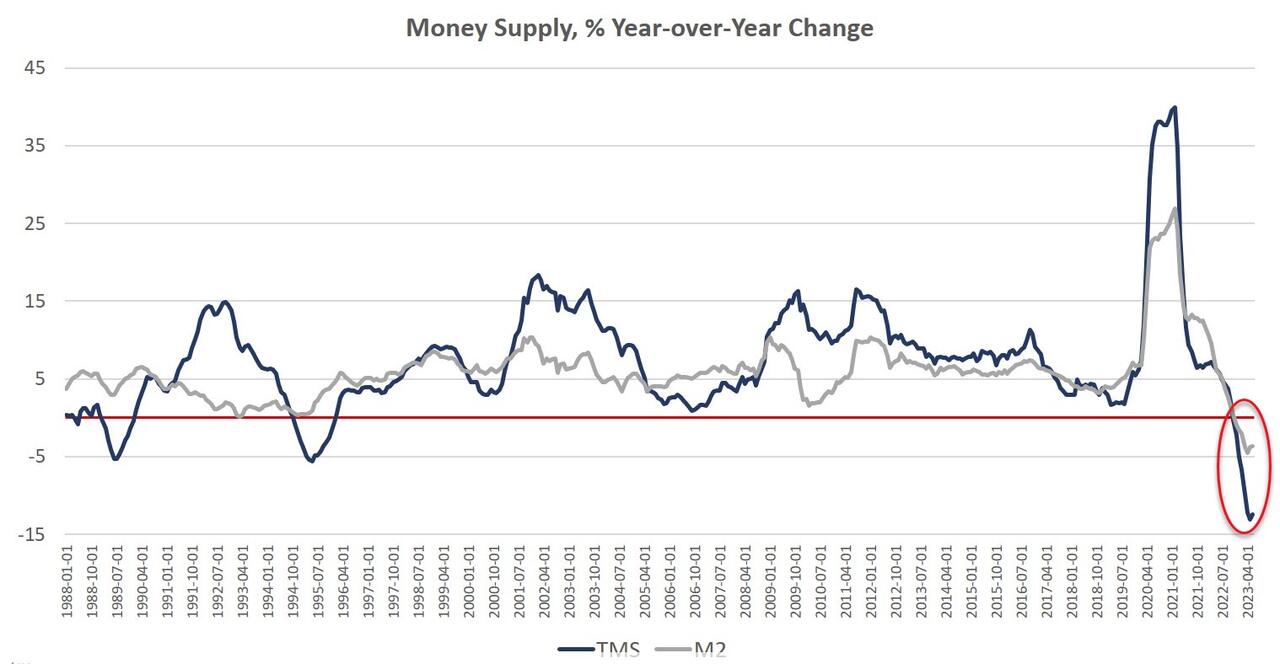
Money supply growth fell again in June, remaining deep in negative territory after turning negative in November 2022 for the first time in twenty-eight years. June’s drop continues a steep downward trend from the unprecedented highs experienced during much of the past two years.
And with M2 Money growth down for 8 consecutive months, bank credit down -0.2% YoY.
Since April 2021, money supply growth has slowed quickly, and since November, we’ve been seeing the money supply repeatedly contract—year-over-year— for six months in a row. The last time the year-over-year (YOY) change in the money supply slipped into negative territory was in November 1994. At that time, negative growth continued for fifteen months, finally turning positive again in January 1996.
Money-supply growth has now been negative for eight months. During June 2023, the downturn continued as YOY growth in the money supply was at –12.4 percent. That’s up slightly from May’s rate of –13.1 percent, and was far below June’s 2022’s rate of 5.7 percent. With negative growth now falling near or below –10 percent for the third month in a row, money-supply contraction is the largest we’ve seen since the Great Depression. Prior to March through June of this year, at no other point for at least sixty years has the money supply fallen by more than 6 percent (YoY) in any month.
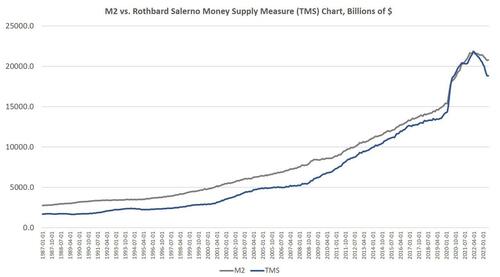
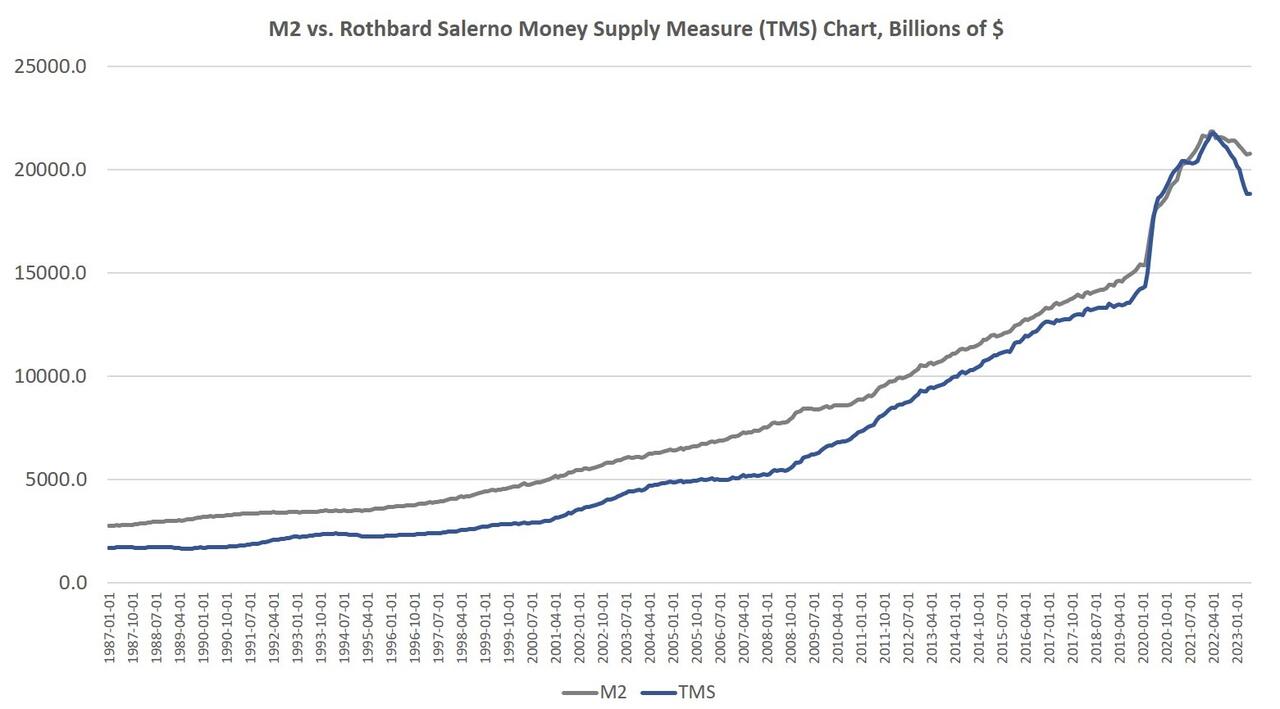
The money supply metric used here—the “true,” or Rothbard-Salerno, money supply measure (TMS)—is the metric developed by Murray Rothbard and Joseph Salerno, and is designed to provide a better measure of money supply fluctuations than M2.
The Mises Institute now offers regular updates on this metric and its growth. This measure of the money supply differs from M2 in that it includes Treasury deposits at the Fed (and excludes short-time deposits and retail money funds).
In recent months, M2 growth rates have followed a similar course to TMS growth rates, although TMS has fallen faster than M2. In June 2023, the M2 growth rate was –3.5 percent. That’s slightly up from May’s growth rate of –3.7 percent. June 2023’s growth rate was also well down from June 2022’s rate of 5.6 percent.
Money supply growth can often be a helpful measure of economic activity and an indicator of coming recessions. During periods of economic boom, money supply tends to grow quickly as commercial banks make more loans. Recessions, on the other hand, tend to be preceded by slowing rates of money supply growth.
It should be noted that the money supply does not need to actually contract to signal a recession and the boom-bust cycle. As shown by Ludwig von Mises, recessions are often preceded by a mere slowing in money supply growth. But the drop into negative territory we’ve seen in recent months does help illustrate just how far and how rapidly money supply growth has fallen. That is generally a red flag for economic growth and employment.
The fact that the money supply is shrinking at all is so remarkable because the money supply almost never gets smaller. The money supply has now fallen by $2.8 trillion (or 15.0 percent) since the peak in April 2022. Proportionally, the drop in money supply since 2022 is the largest fall we’ve seen since the Depression. (Rothbard estimates that in the lead up to the Great Depression, the money supply fell by 12 percent from its peak of $73 billion in mid-1929 to $64 billion at the end of 1932.)
In spite of this recent drop in total money supply, the trend in money-supply remains well above what existed during the twenty-year period from 1989 to 2009. To return to this trend, the money supply would have to drop at least another $4 trillion or so—or 22 percent—down to a total below $15 trillion.
Since 2009, the TMS money supply is now up by nearly 184 percent. (M2 has grown by 146 percent in that period.) Out of the current money supply of $18.8 trillion, $4.5 trillion of that has been created since January 2020—or 24 percent. Since 2009, $12.2 trillion of the current money supply has been created. In other words, nearly two-thirds of the money supply have been created over the past thirteen years.
With these kinds of totals, a ten-percent drop only puts a small dent in the huge edifice of newly created money. The US economy still faces a very large monetary overhang from the past several years, and this is partly why after fourteen months of slowing money-supply growth, we are not yet seeing a sizable slowdown in the labor market.
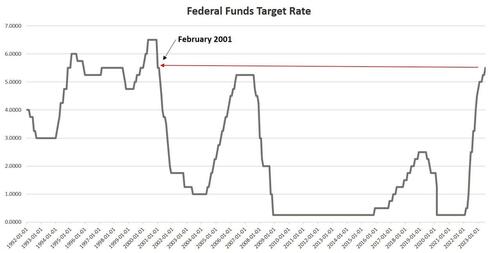
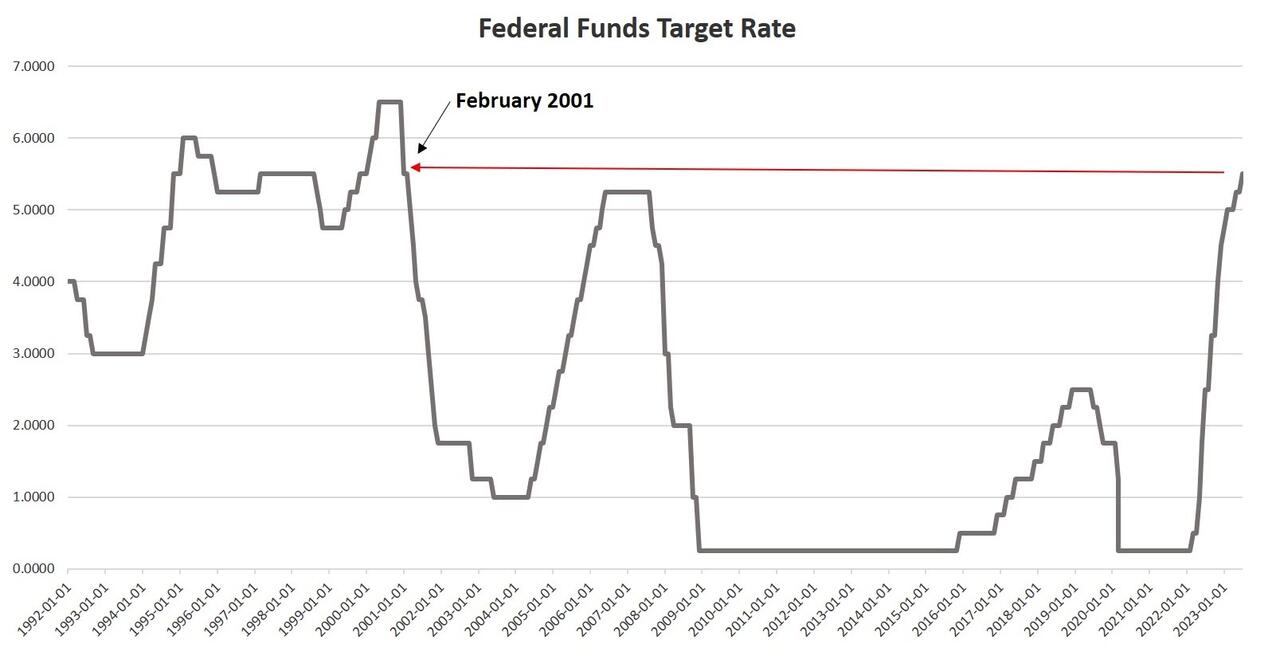
An inflationary boom begins to turn to bust once new injections of money subside, and we are seeing this now. Not surprisingly, the current signs of malaise come after the Federal Reserve finally pulled its foot slightly off the money-creation accelerator after more than a decade of quantitative easing, financial repression, and a general devotion to easy money. As of July, the Fed has allowed the federal funds rate to rise to 5.50 percent, the highest since 2001. This has meant short-term interest rates overall have risen as well. In June, for example, the yield on 3-month Treasurys remains near the highest level measured in more than 20 years.
Without ongoing access to easy money at near-zero rates, however, banks are less enthusiastic about making loans, and many marginal companies will no longer be able to stave off financial trouble by refinancing or taking out new loans. For example, Yellow Corporation, a trucking company, has declared bankruptcy and will lay off 30,000 workers. Tyson Foods announced this week it is closing four chicken processing plants in an effort to cut costs. 3,000 workers are likely to lose their jobs as a result. These firms have experienced financial problems for years, but rising interest rates preclude additional delays of the inevitable. We will see more of this as more companies face the realities of higher rates. (In another sure sign of a slowing economy, state and local tax revenues have been falling.)
Meanwhile, as lenders get spooked by tightening cash availability, it’s getting more difficult to qualify for a home loan, and credit availability is the tightest its been in a decade. Meanwhile, the average 30-year mortgage rate rose in July to nearly the highest point since 2002.
One of the most troubling indicators is soaring credit card debt even as interest rates soar. As of May 2023, the commercial bank interest rate rose to the highest rate measured in at least 30 years. Just last year, the interest rate hovered around 15 percent. In May 2023, it reached over 20 percent. This is happening as credit card debt and other revolving loans have reached a new all-time high.
These factors all point toward a bubble that is in the process of popping. The situation is unsustainable, yet the Fed cannot change course without reigniting a new surge in price inflation. Any surge in prices would be especially problematic given the rising cost of living. Both new and used cars are becoming increasingly unaffordable. Ordinary Americans face a similar problem with homes. According to the Atlanta Fed, the housing affordability index is now the worst it’s been since 2006, in the midst of the Housing Bubble.
If the Fed reverses course now, and embraces a new flood of new money, prices will only spiral upward. It didn’t have to be this way, but ordinary people are now paying the price for a decade of easy money cheered by Wall Street and the profligates in Washington. The only way to put the economy on a more stable long-term path is for the Fed to stop pumping new money into the economy. That means a falling money supply and popping economic bubbles. But it also lays the groundwork for a real economy—i.e., an economy not built on endless bubbles—built by saving and investment rather than spending made possible by artificially low interest rates and easy money.
Either Powell is Cap’n (Credit) Crunch or Boss Biden because of his insane spending spree helping inflation hit 40 year high is Cap’n (Credit) Crunch.
While looking up baseball statistics, I found this picture of former Cincinnati Reds outfielder Wally Post. Or is that actor Nick Searcy from “Justified”?
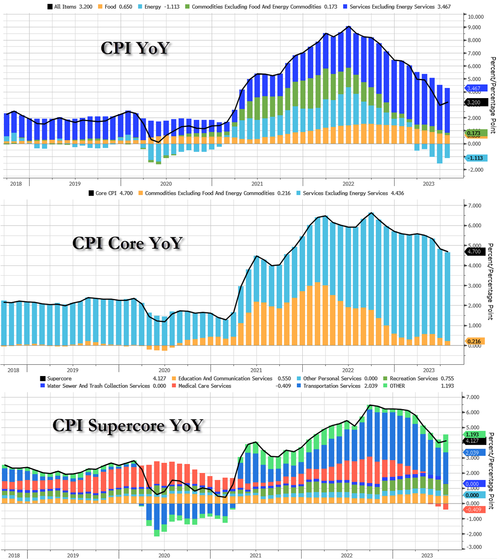
Welcome to Boss Biden’s America! It reminds of woefully corrupt Boss Tweed and Tammany Hall in New York City. Today’s inflation report revealed that core CPI YoY was 4.7%. Ugh!
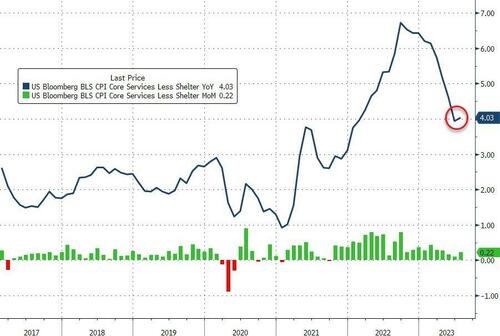
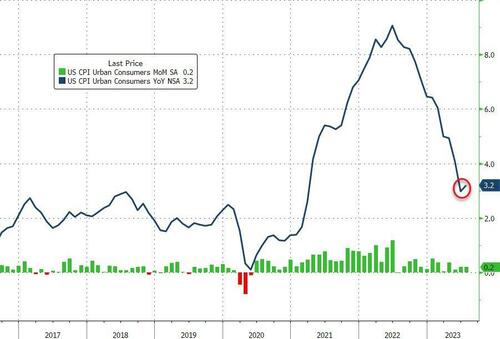
Expectations for this morning’s must-watch CPI print were for a MoM and YoY rise in the headline, and modest slowing of the core YoY. However, The Fed will be watching its new favorite signal – Core Services CPI Ex-Shelter – which reaccelerated in July (+0.2% MoM, and from +3.9% to +4.0% YoY).
The headline CPI rose 0.2% MoM in July (as expected), the same as in June, pushing the YoY up to 3.2% (from 3.0% in June) but below the 3.3% expected…
Source: Bloomberg
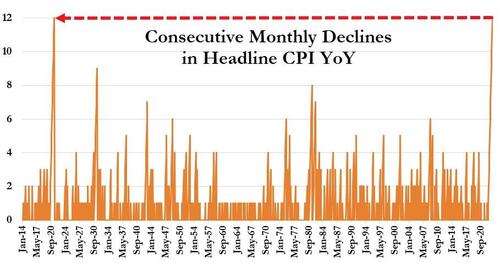
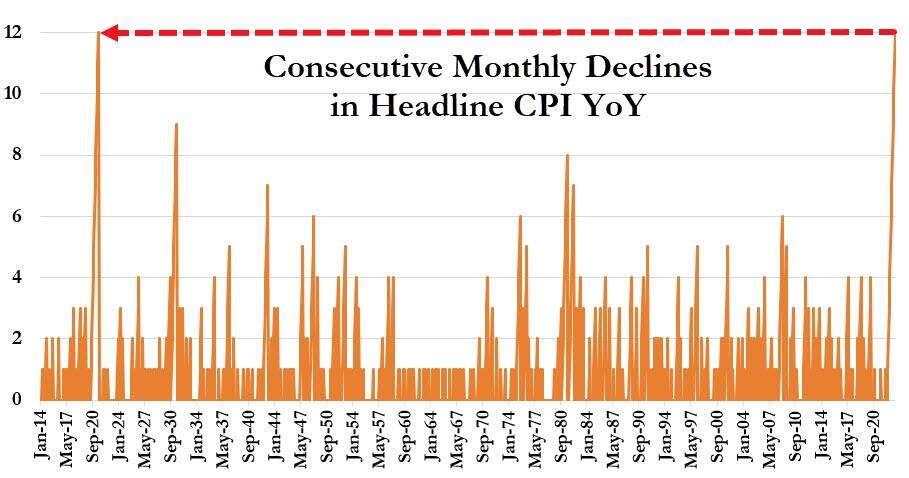
Today’s increase in CPI YoY broke the record-equaling streak of 12 straight months of declines.
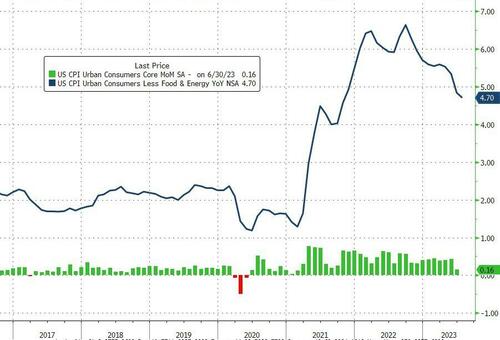
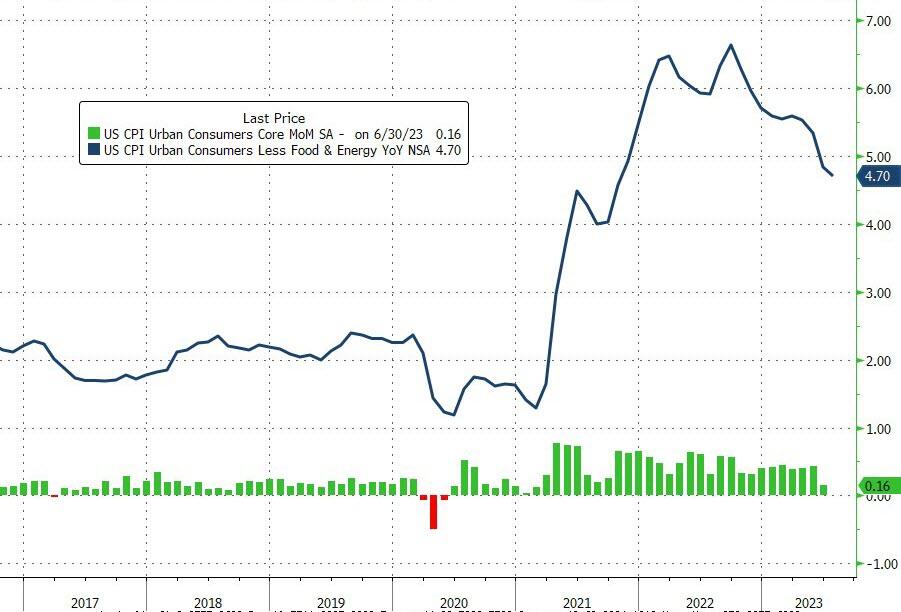
Core CPI rose 0.16% MoM, with the YoY growth in prices slowing to 4.7%.
Source: Bloomberg
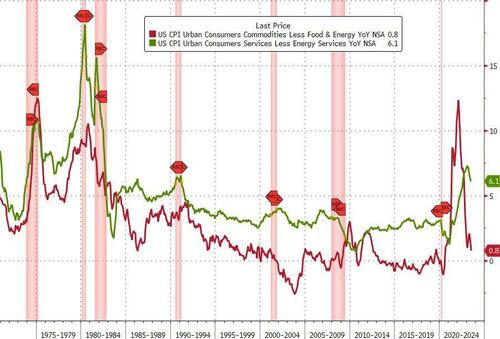
Both Goods and Services inflation (YoY) slowed in July – but Services remain extremely high at +6.1%…
Source: Bloomberg
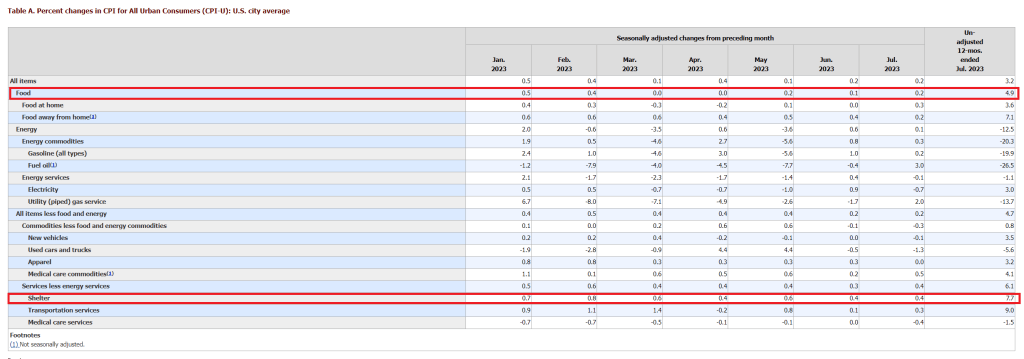
On an annual basis, the index for all items less food and energy rose 4.7% over the past 12 months with the shelter index rising 7.7% over the last year, accounting for over two-thirds of the total increase in all items less food and energy.
Other indexes with notable increases over the last year include motor vehicle insurance (+17.8 percent), recreation (+4.1 percent), new vehicles (+3.5 percent), and household furnishings and operations (+2.9 percent).
Source: Bloomberg
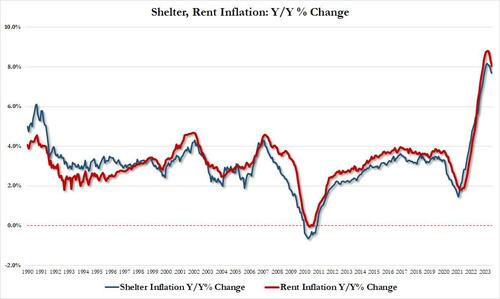
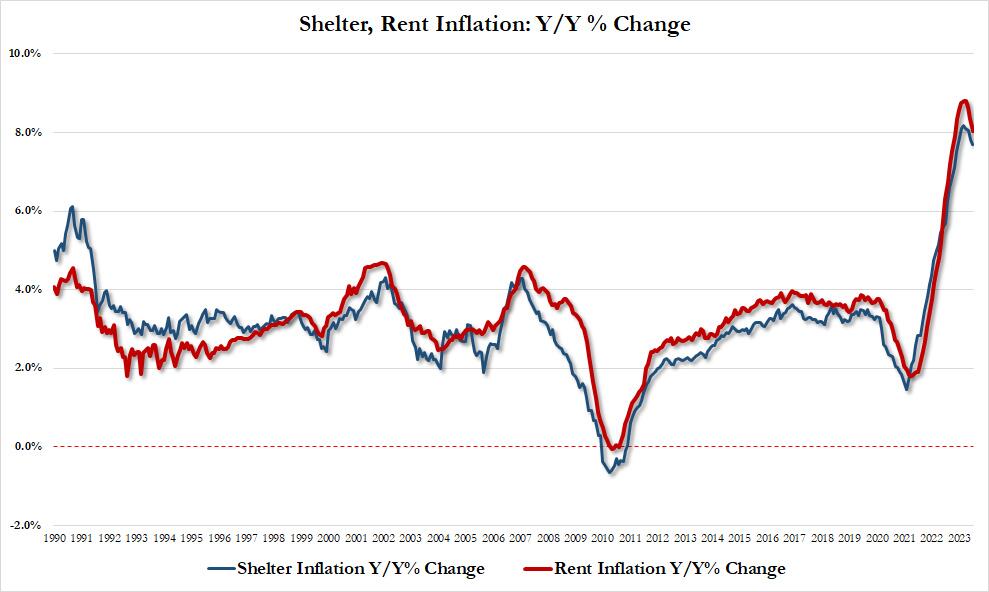
Taking a closer look at the all important shelter index, while it is still growing both sequentially and annually, the slowdown in growth is increasing more visible:
Shelter inflation up 7.69% YoY in July vs 7.83% in June, lowest since Dec 22; also up 0.43% MoM, lowest monthly increase since Jan 22
Rent inflation up 8.03% in July vs 8.33% in June, lowest since Nov 22; also up 0.41% MoM, lowest since March 22
The silver lining here, as noted by former Fed staffer Julia Coronado, is that “we are seeing core inflation slow before the expected big step down in rent/oer” which is great news as “lots of price sensitivity in travel and core goods that was slow to take hold but is now fully coming through.” In other words, if and when rent/shelter inflation actually post a decline (with the usual 12-18 month BLS lag), the Fed will be scrambling to fight inflation.
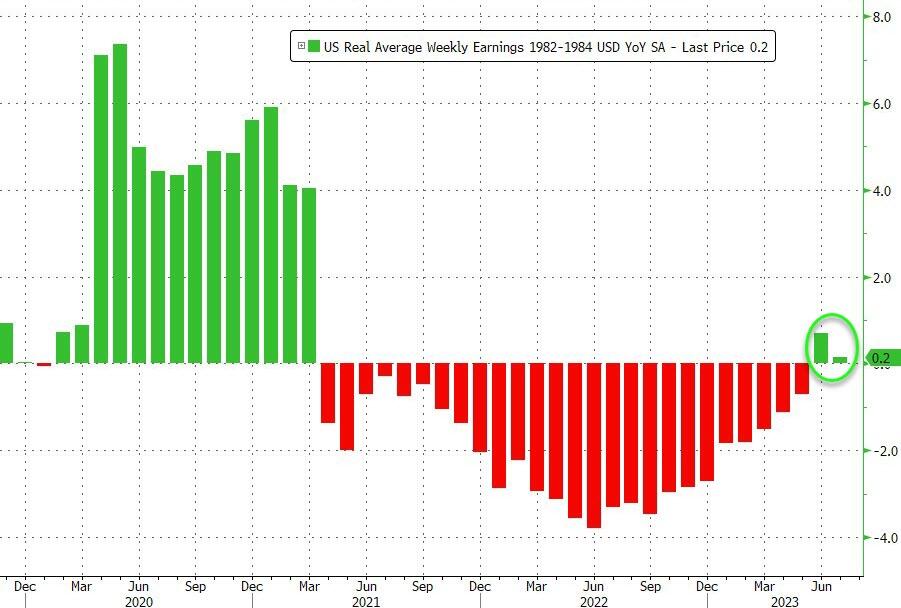
Turning to the wage aspect, for the second month in a row, ‘real’ wages rose YoY in July (but barely, +0.2%), and it appears that we are about to dip back into real contraction next month.
Source: Bloomberg
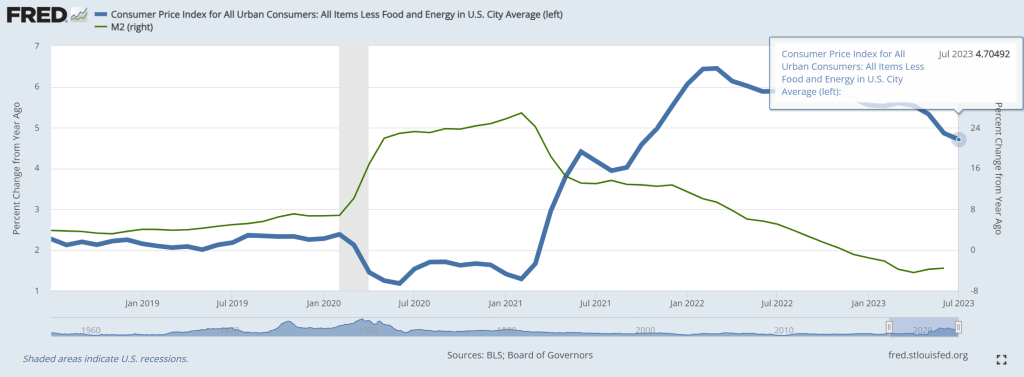
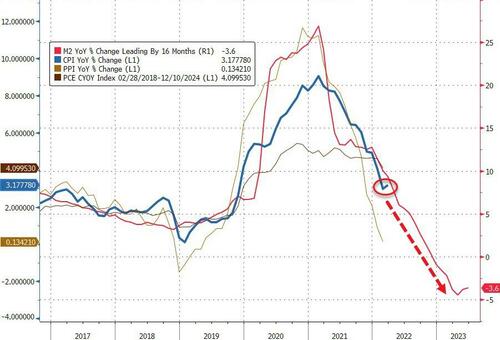
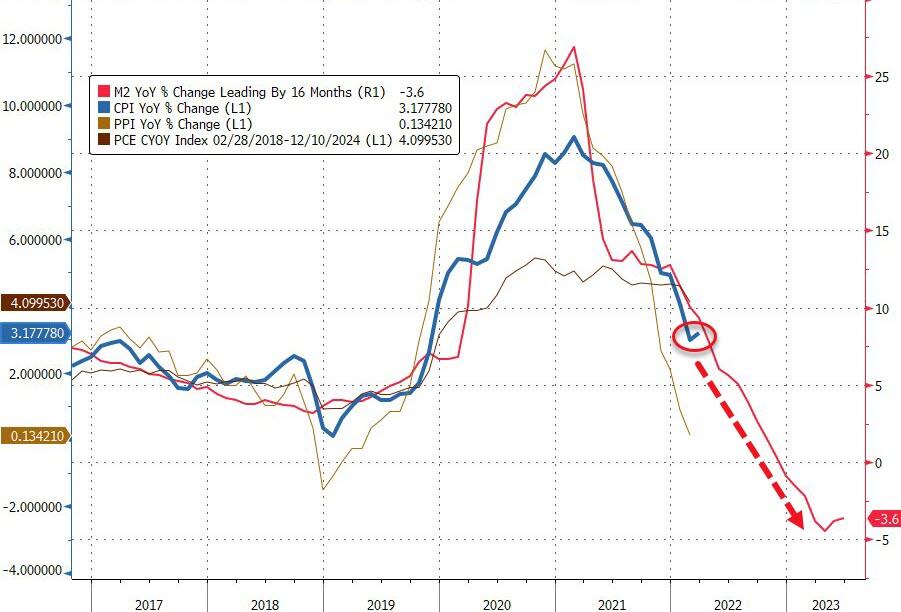
So the question becomes – is this an inflection point in inflation? (or is M2 still leading the way?)
Source: Bloomberg
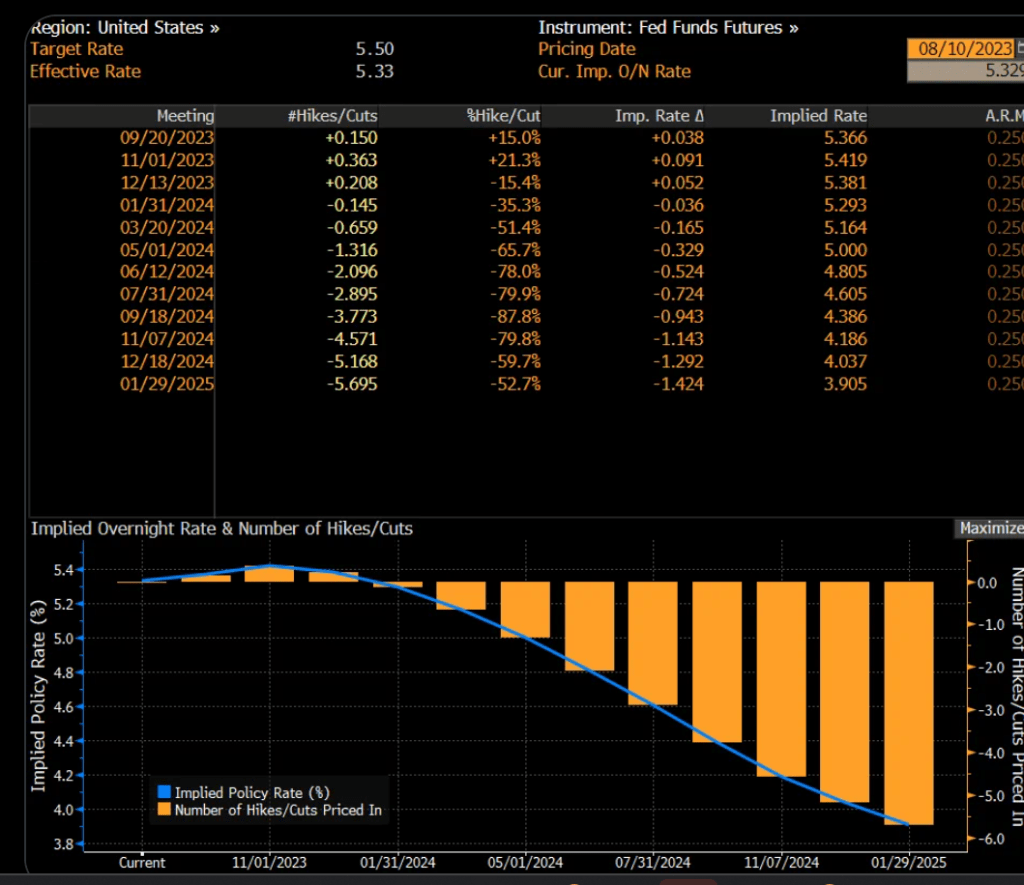
Yet, Fed Funds Futures are pointing to no further Fed rate hikes.
With House Republicans releasing bank records showing over $20 million in payments to Biden family, associates, and Democrats denying any wrongdoing, I think we are seeing the Biden Administration as a rebirth of New York City’s Tammany Hall corrupt political machine led by Boss Tweed. Since Biden’s malfeasance/influence peddling occurred when he was Vice President under Barack Obama (aka, Barry Soetoro), Obama is the new Bathhouse John Coughlin the woefully corrupt Chicago Alderman and Hunter Biden is the new Hinky Dink (Michael Kenna, also a woefully corrupt Chicago Alderman).
Bathhouse Barry Soetoro, Boss Biden and Hinky Hunter at a basketball game.
“Bidenomics is indeed working!” claims Karine Jean-Pierre. “Cost is going down … wages going up, that is Bidenomics.”
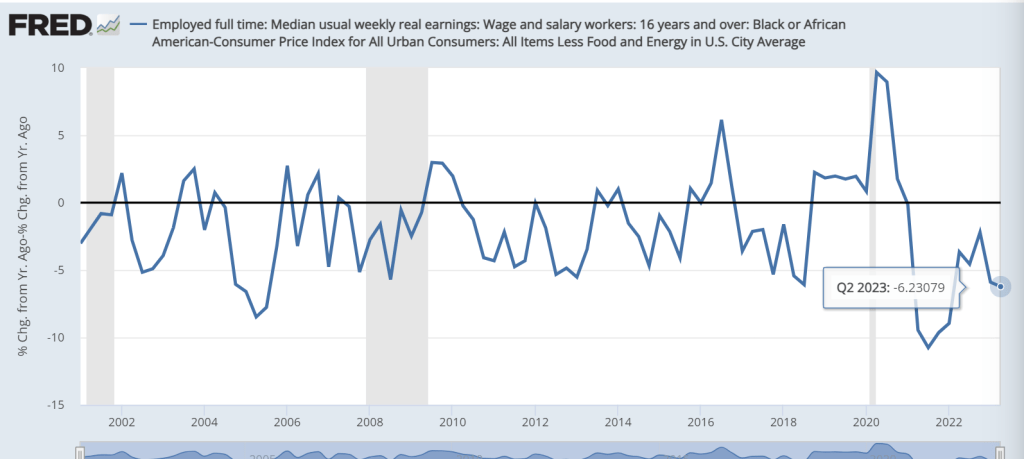
Excuse me Karine. REAL weekly earnings growth remains negative as inflation outpaces weekly earnings growth. As of Q2 2023, REAL median weekly earnings growth is a dismal -3.57% YoY.
And if you are black, Bidenomics has failed you even worse! Q2 Real weekly earnings growth for black households was -6.23% YoY.
The US mortgage market is livin’ la vida Biden! And for the US mortgage market, la vida Biden in ugly.
Mortgage applications decreased 3.1 percent from one week earlier, according to data from the Mortgage Bankers Association’s (MBA) Weekly Mortgage Applications Survey for the week ending August 4, 2023.
The Market Composite Index, a measure of mortgage loan application volume, decreased 3.1 percent on a seasonally adjusted basis from one week earlier. On an unadjusted basis, the Index decreased 4 percent compared with the previous week. The Refinance Index decreased 4 percent from the previous week and was 37 percent lower than the same week one year ago. The seasonally adjusted Purchase Index decreased 3 percent from one week earlier. The unadjusted Purchase Index decreased 3 percent compared with the previous week and was27 percent lower than the same week one year ago.
Here is a chart of mortgage purchase applications with Biden’s record in the orange box.
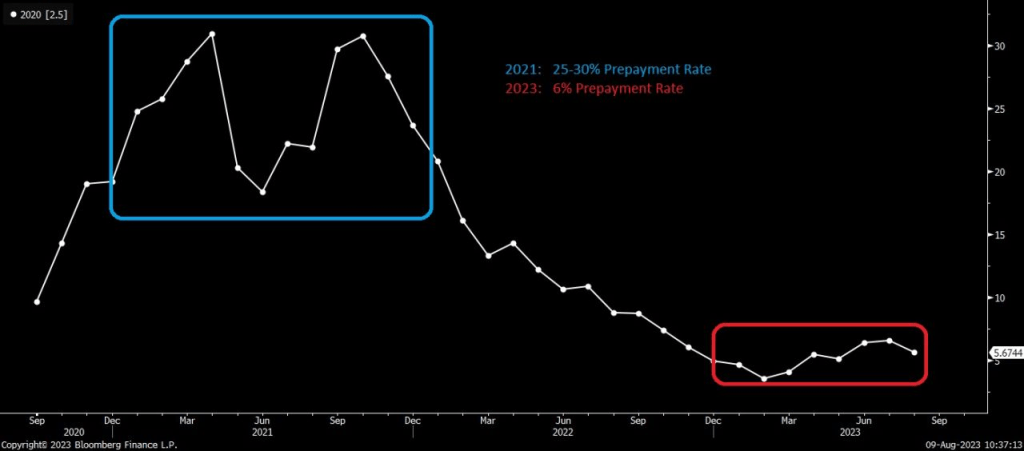
Prepayment rates with rising mortgage rates (to try to cool Bidenflation) are now low by historic standards.
Here is a photo of Joe Biden (or is that Boss Tweed of NYC’s Tammany Hall)? Doesn’t matter because they are both the same corrupt person.
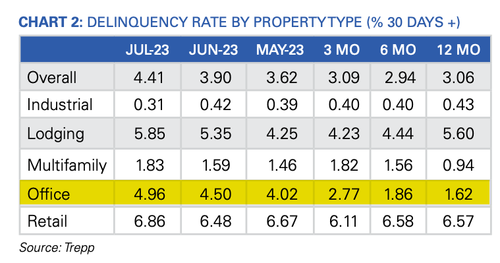
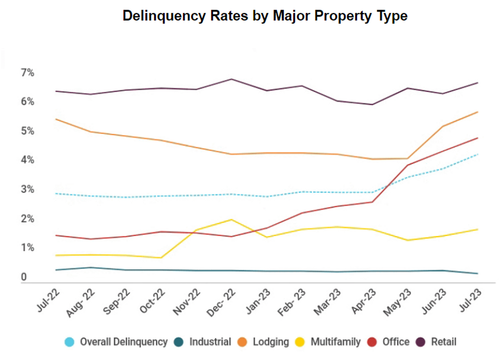
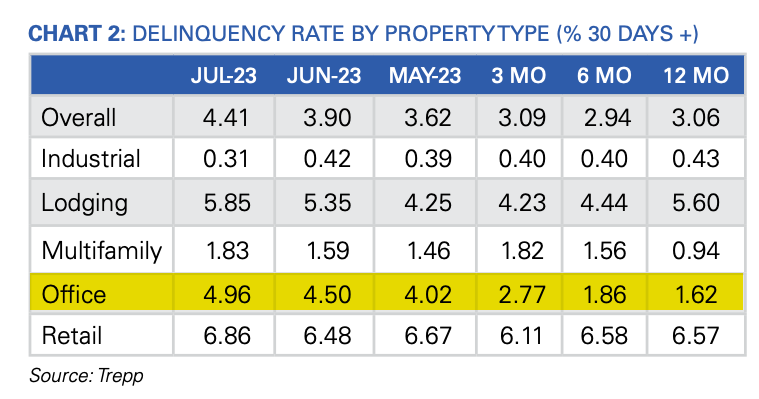
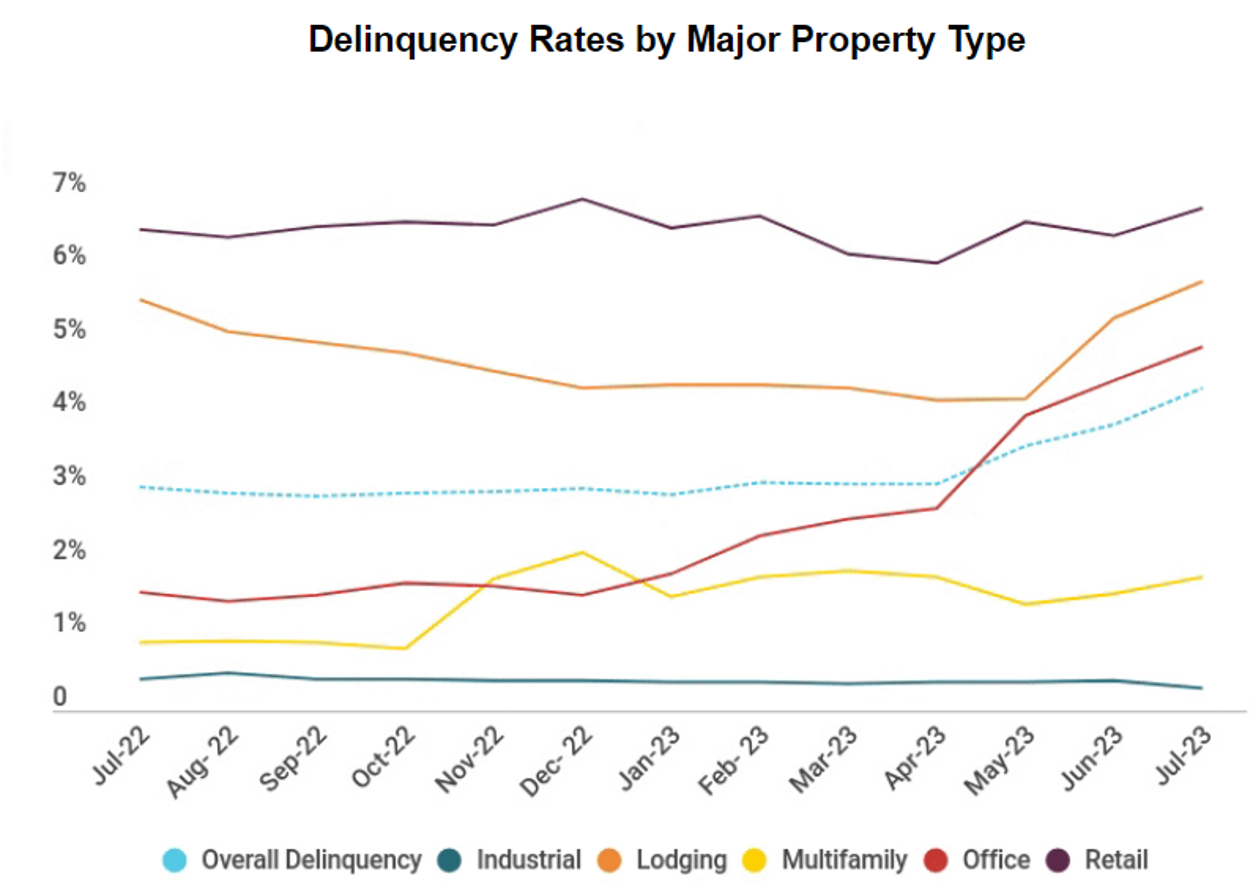
The latest data from Trepp, which tracks commercial mortgage-backed securities (CMBS) securities market data, shows the delinquency rate of commercial property loans packaged up by Wall Street jumped again in July, with four of the five major property segments posting increases.
“While the rest of the US economy has seen relief in terms of higher equity prices, better-than-expected corporate earnings, and falling inflation numbers, the commercial real estate (CRE) market continues to be left behind,” Trepp wrote in the report.
Trepp data found the delinquency rate rose 51 basis points to 4.41% last month — the highest level since December 2021. Office delinquencies increased by 46 basis points to 4.96% — up more than 350 basis points since the end of 2022. The deterioration in the office segment is intensifying at an alarmingly rapid pace.
A broad overview of the US CMBS market shows the delinquency rate increased to 4.41%, a 51bps rise compared to the previous month, but still significantly lower than the 10.34% rate recorded in July 2012. The rate peaked at 10.32% in June 2020 during the government-forced Covid lockdowns.
Here are more highlights from the report:
Year over year, the overall US CMBS delinquency rate is up 135 basis points.
Year to date, the rate is up 137 basis points.
The percentage of loans that are seriously delinquent (60+ days delinquent, in foreclosure, REO, or non-performing balloons) is now 3.92%, up 20 basis points for the month.
If defeased loans were taken out of the equation, the overall headline delinquency rate would be 4.64%, up 51 basis points from June.
One year ago, the US CMBS delinquency rate was 3.06%.
Six months ago, the US CMBS delinquency rate was 2.94%.
To better understand what might come next for the CRE market, Kiran Raichura, Capital Economics’ deputy chief property economist, recently warned in a note to clients that the office segment might experience a 35% plunge in values by the second half 2025 and “is unlikely to be recovered even by 2040.”
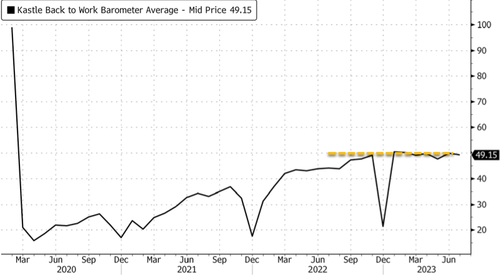
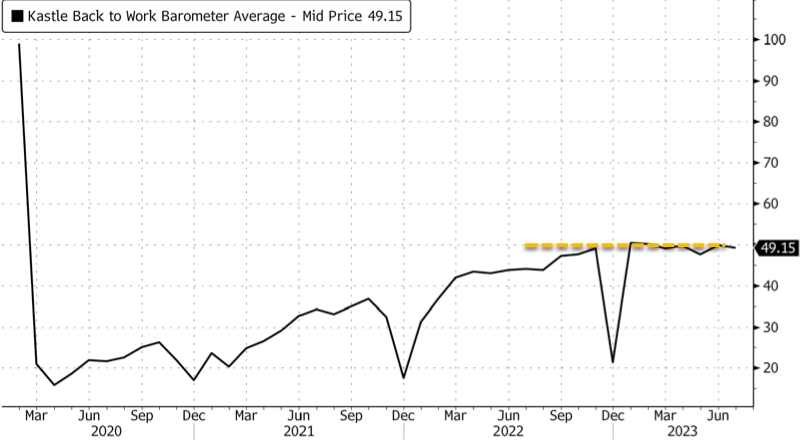
According to swipe data from Kastle Systems, the US office occupancy rate is less than 50%. The figure has plateaued since September, indicating a new reality of remote work.
One major hurdle for CRE space is that “more than 50% of the $2.9 trillion in commercial mortgages will need to be renegotiated in the next 24 months when new lending rates are likely to be up by 350 to 450 basis points,” Lisa Shalett, chief investment officer for Morgan Stanley Wealth Management, wrote in a note to clients.
Shalett expects a “peak-to-trough CRE price decline of as much as 40%, worse than in the Great Financial Crisis.”
Bank of America analysts expect challenges in the CRE space but noted, “They are manageable and do not represent a systemic risk to the US economy.”
Meanwhile, analysts at UBS warned:
“About $1.3 billion of office mortgage loans are currently slated to mature over the next three years.
“It’s possible that some of these loans will need to be restructured, but the scope of the issue pales in comparison to the more than $2 trillion of bank equity capital. Office exposure for banks represents less than 5% of total loans and just 1.9% on average for large banks.”
We’ve already seen major building owners returning their office towers and malls to lenders in California (here & here) and elsewhere (here). This will result in an uptick in CMBS delinquencies moving forward.


You must be logged in to post a comment.