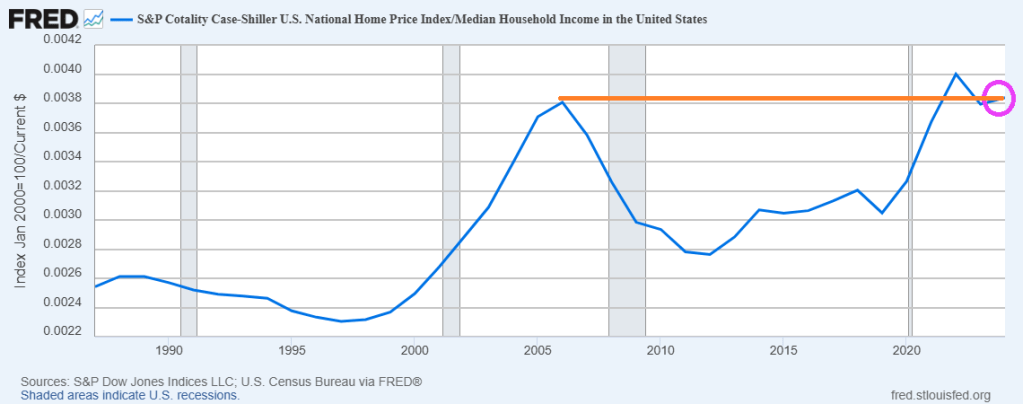
Yikes! The ratio of US Home Prices to US Median Household Income is now higher than the ratio during the catestrophic housing bubble during the latter half of the 2000s.
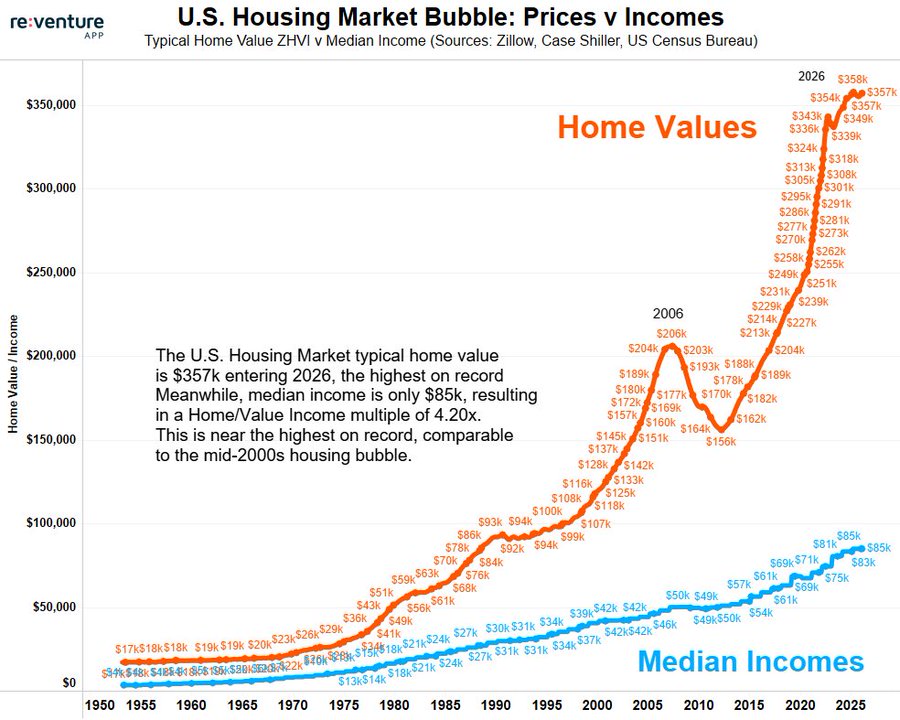
Here is a chart of home prices and median household incone,
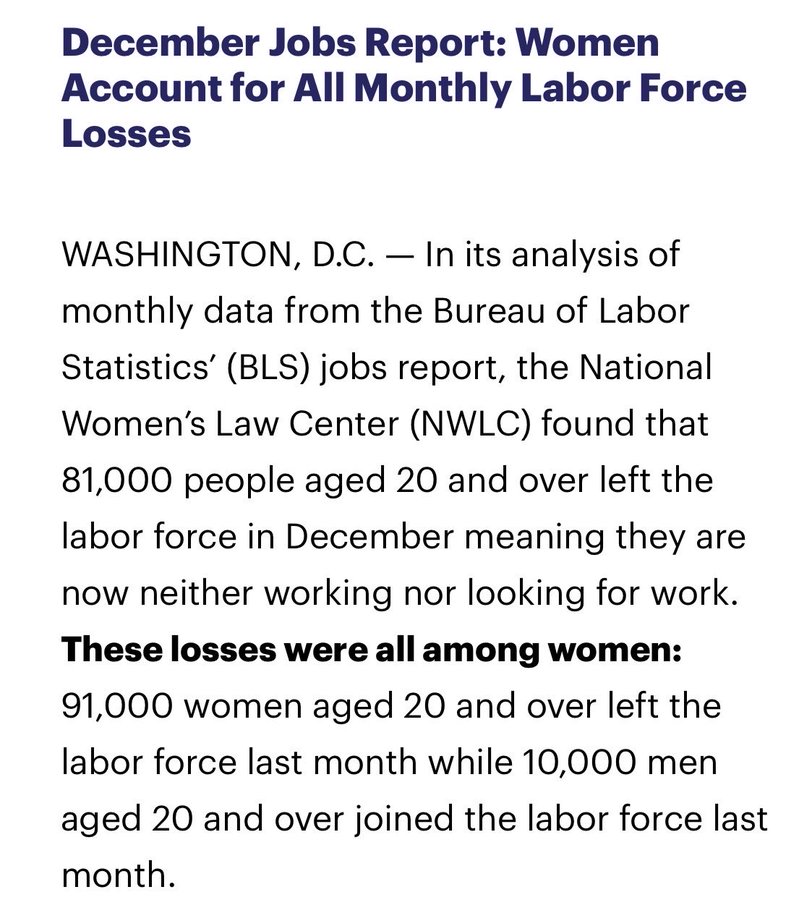
The labor market is truly screwed-up. The December jobs report reveals that women account for nearly all labor force losses.
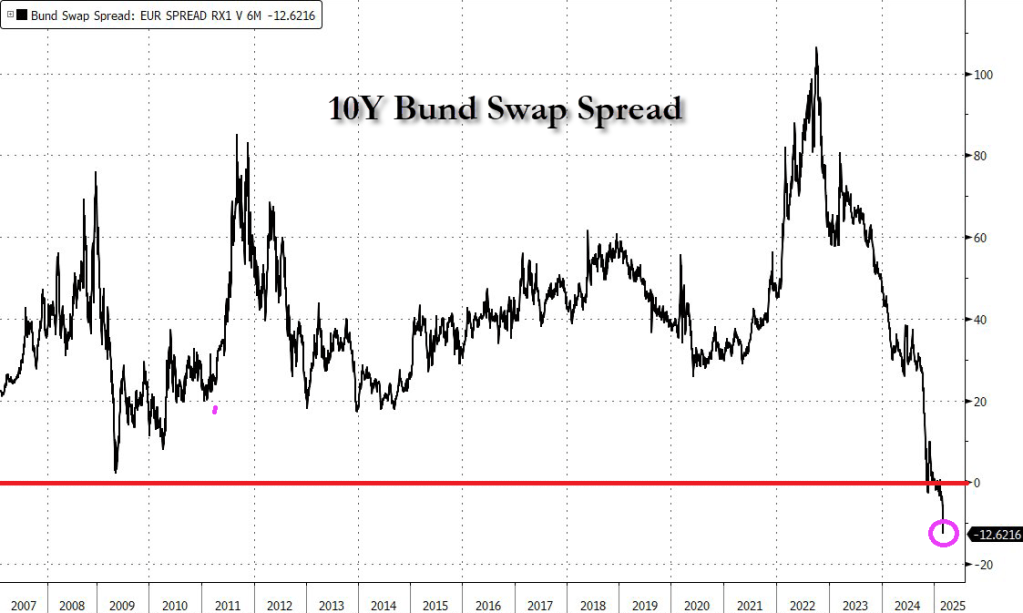
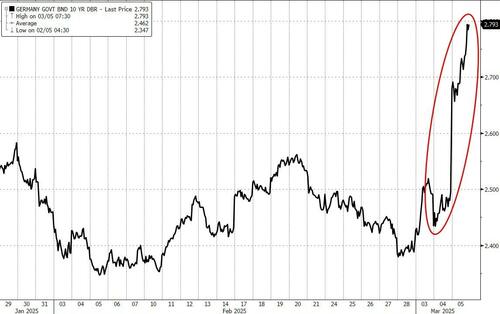
German 10-year bond yields are trading above euro interest rate swaps for the first time in history (-12.62), a watershed moment for these markets that underlines just how much investors have soured on government debt.
Bund yields +30bps today – the biggest spike on record going back to 1990.
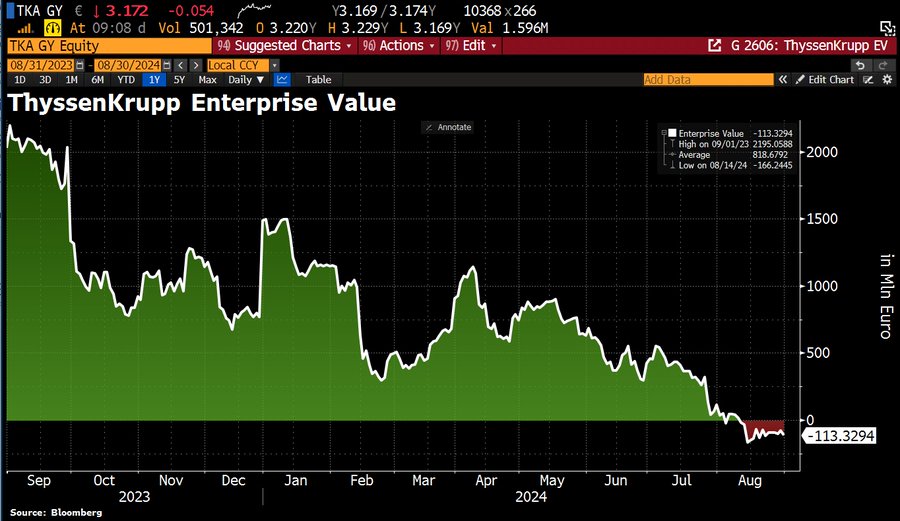
I read “The Arms of Krupp” by William Manchester. A great book about the rise of ThyssenKrupp during World War II. It is one of the world’s largest steel producers, but it now has NEGATIVE ENTERPRISE VALUE.
The cause? Germany is up the creek without an economic paddle after years of gross mismanagement by Angela Merkel and her party. Mass immigration in Germany and a slowdown in the global economy aren’t helping.
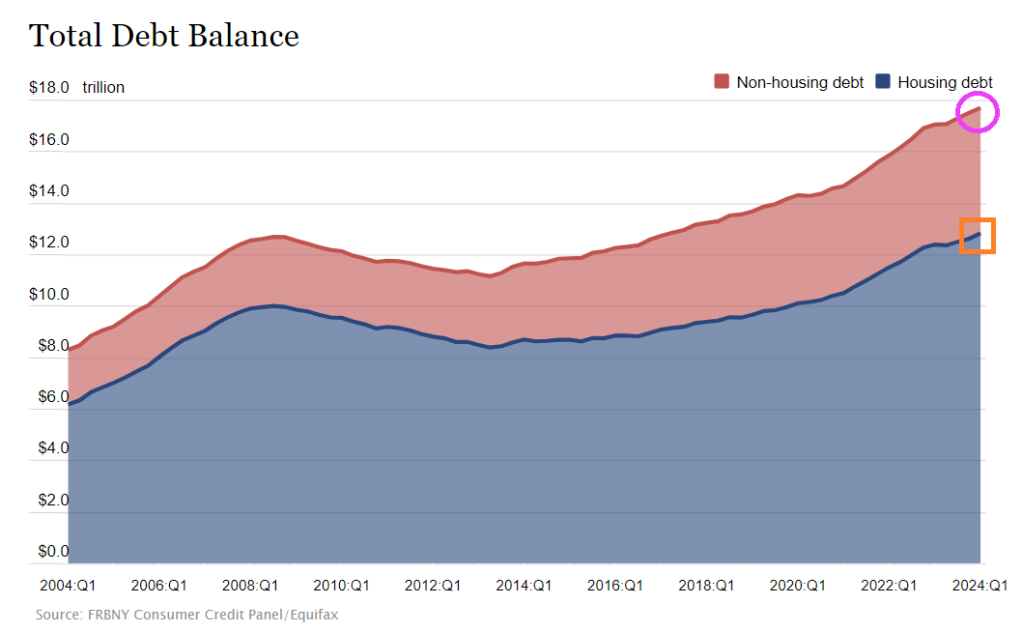
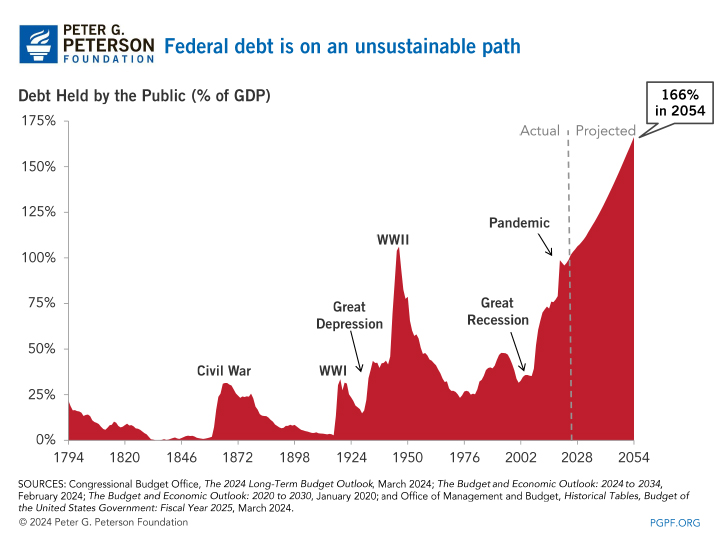
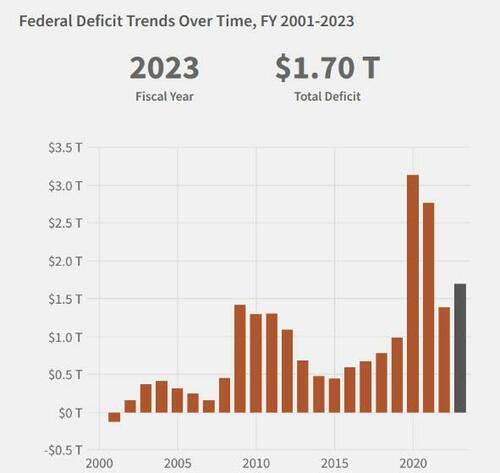
Too much debt should be the theme song for the US! Both for consumers and the Feral government (not a typo!)
Consumer credit increased by +$6.403 billion in April, much softer than consensus estimate of +$10 billion … more notable, however, was March data, given initial read of +$6.274 billion was revised down to -$1.099 billion.
Not to mention $13 trillion in mortgage debt (1-4 unit housing), but at least that is backed by property. Unlike The Feral government who borrows/prints with only a promise.
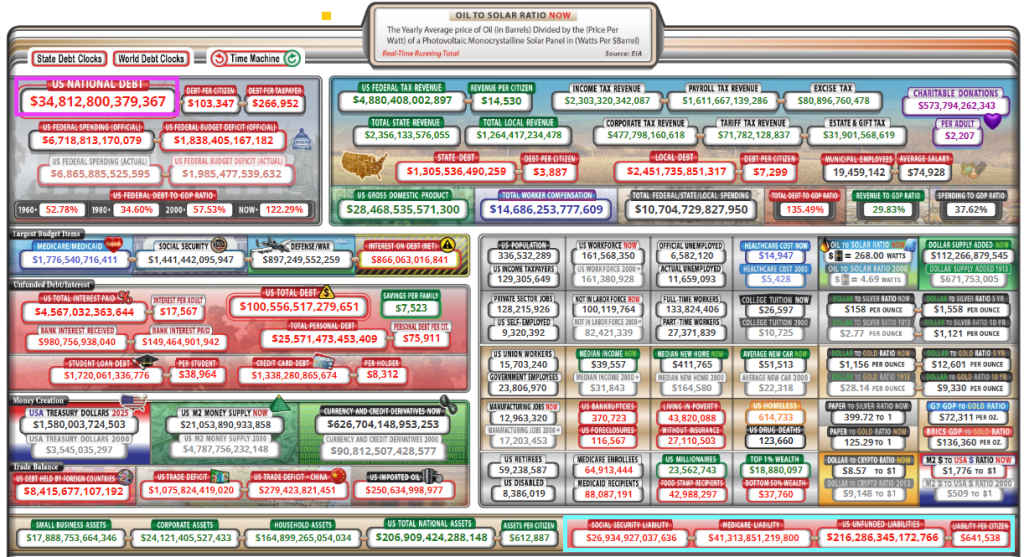
And growing awfully fast. Note that since the “pandamic”, debt as % of GDP has exceeded 100% and is projected to hit 166% by 2054. But look at the UNFUNDED LIABILITIES the need to be paid ($216+ TRILLION ($641.5k per citizen!). Pretty soon, we (the 99%) will be back on the chain gang paying for endless wars and government corruption. I wish Biden, Schumer, McConnell and other swamp creatures would consider all the spending the government is on the hook for rather than focus on spending that will help them get elected perpetually. There is no middle of the road anymore. The US is broke and has too much debt.
Of course, President Biden wants endless spending on wars (Ukraine, Israel, etc) and now wants an unlimited check to pay for the next pandemics. The Pretenders’ song “My City Was Gone” seems to be appropriate for the US as “My County Is Gone.”
Of course, some “economists” claim that the US can borrow/print unlimited amounts of money … until they can’t.
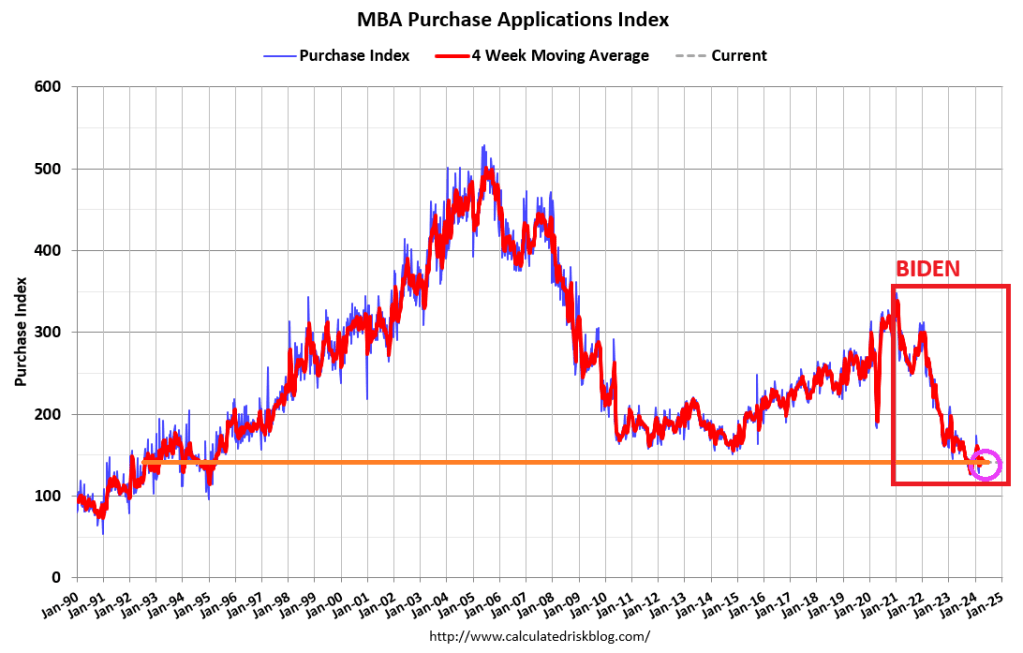
Housing in the US is simply unaffordable, particularly after HUD levied new regulation rising the cost of new housing up to $31,000. Wait for this to kick into the data for mortgage demand!
Mortgage applications decreased 2.3 percent from one week earlier, according to data from the Mortgage Bankers Association’s (MBA) Weekly Mortgage Applications Survey for the week ending April 26, 2024.
The Market Composite Index, a measure of mortgage loan application volume, decreased 2.3 percent on a seasonally adjusted basis from one week earlier. On an unadjusted basis, the Index decreased 1.4 percent compared with the previous week. The seasonally adjusted Purchase Index decreased 2 percent from one week earlier. The unadjusted Purchase Index decreased 1 percent compared with the previous week and was14 percent lower than the same week one year ago.
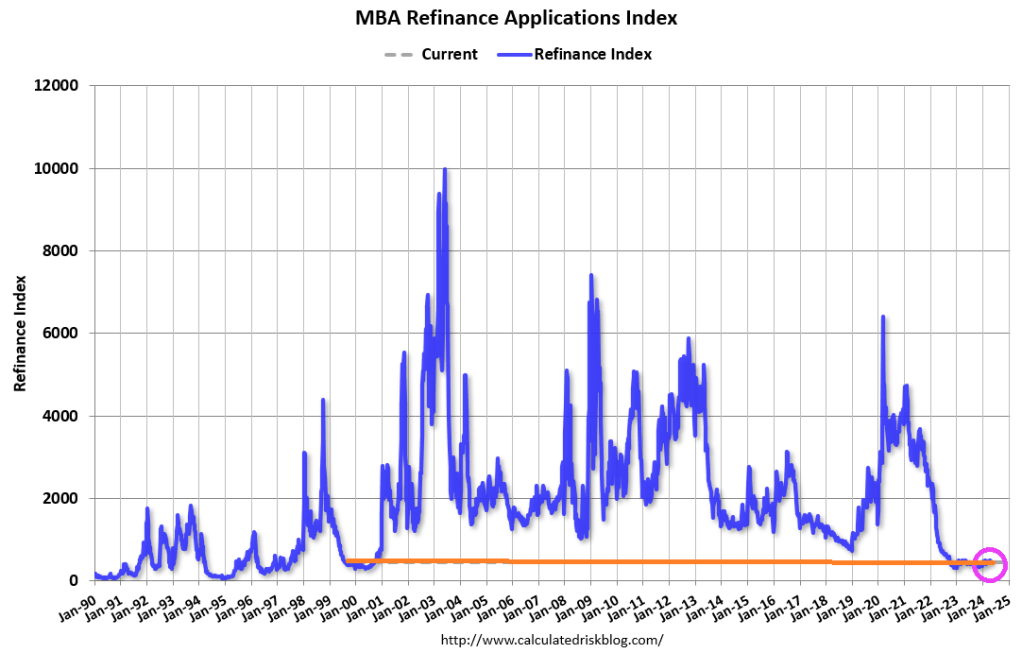
The Refinance Index decreased 3 percent from the previous week and was 1 percent lower than the same week one year ago.
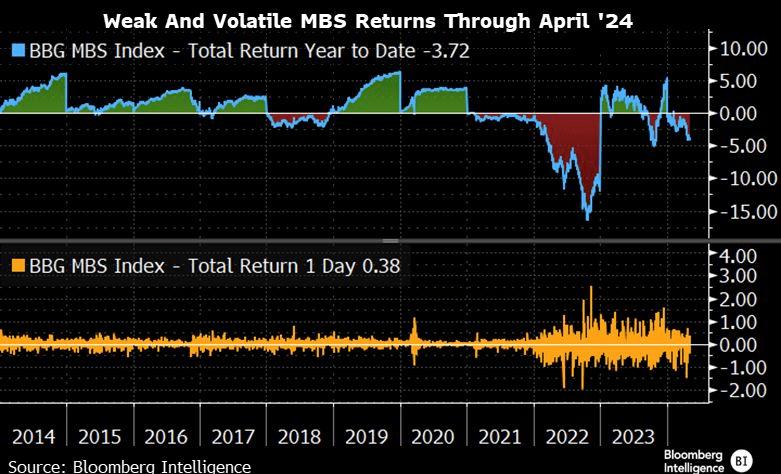
MBS returns are weak and volatile.
How is the Biden Regime making homeownership more affordable? They aren’t. The are using regulations, to drive the cost of new housing way up. New HUD energy rules will raise the cost of home construction by imposing stricter building codes. The National Association of Home Builders says the energy rules can add as much as $31,000 to the price of a new home. Payback time is 90 years (how long it will take the recoup the initial investment).
Under Biden’s “leadership” we are all addicted to gov. But at least Ukraine and Zelenskyy will be getting a guaranteed 10 years of financial support from the US … while E Palestine Ohio and Maui remain destroyed.
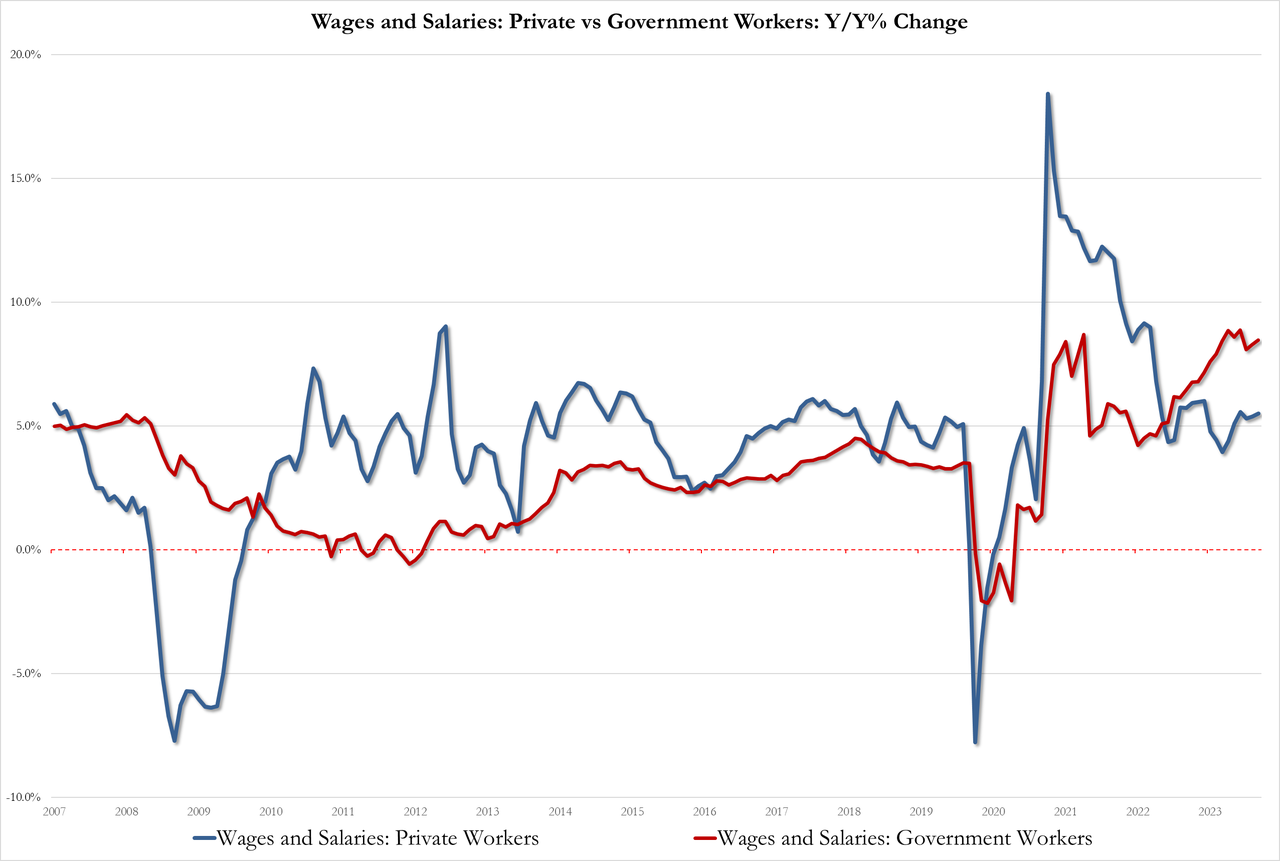
Today’s economic news highlights “Government Power.” Unproductive government jobs saw wages rise 8.5% YoY while productive private sector jobs saw wages rise by only 5.5% YoY. This is Bidenomics!!!
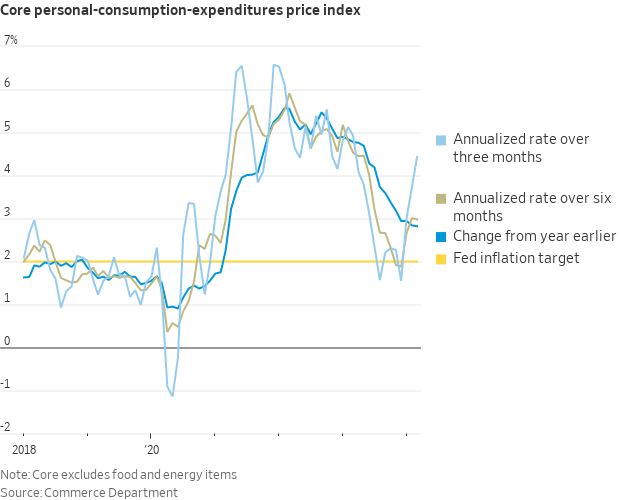
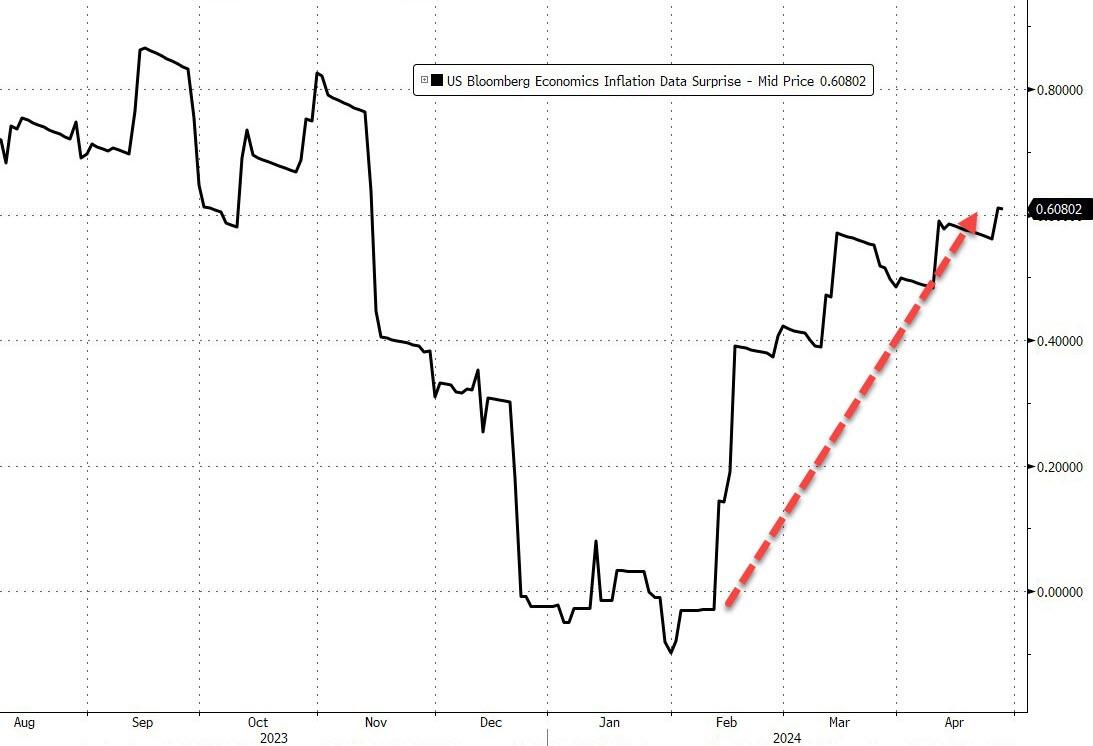
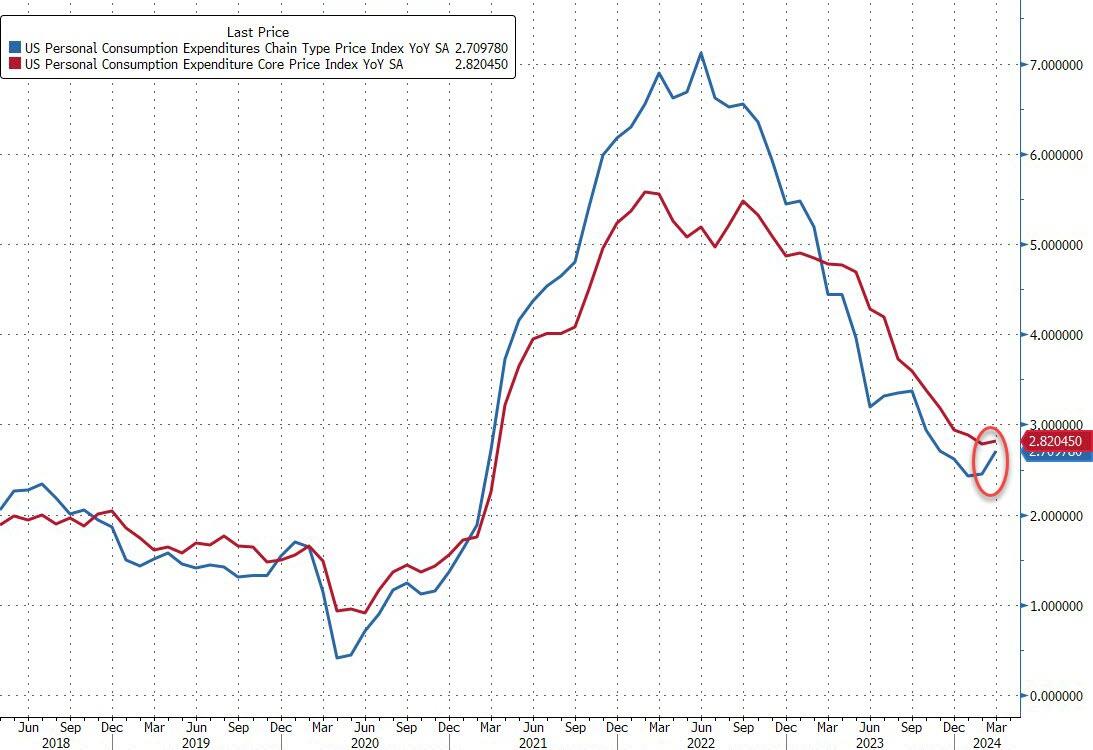
…the doves’ last chance for sooner than later rate-cuts is today’s Core PCE Deflator – often described as The Fed’s favorite inflation signal. Last month saw an uptick in the headline deflator and following yesterday’s core PCE rise for Q1, all eyes are on the March data released this morning.
However, both the headline and core PCE Deflator data printed hotter than expected (+2.7% vs +2.6% exp vs +2.5% prior and +2.8% vs +2.7% exp vs +2.8% prior respectively)…
Source: Bloomberg
The silver lining is that this hot PCE print is ‘dovish’ relative to the GDP-based data we saw yesterday, with whisper numbers of +0.4 to +0.5% MoM (vs the +0.3% print).
But still – it’s not good for the doves.
As WSJ Fed Whisperer Nick Timiraos notes, the 3-Month annualized core PCE jumped to 4.4%…
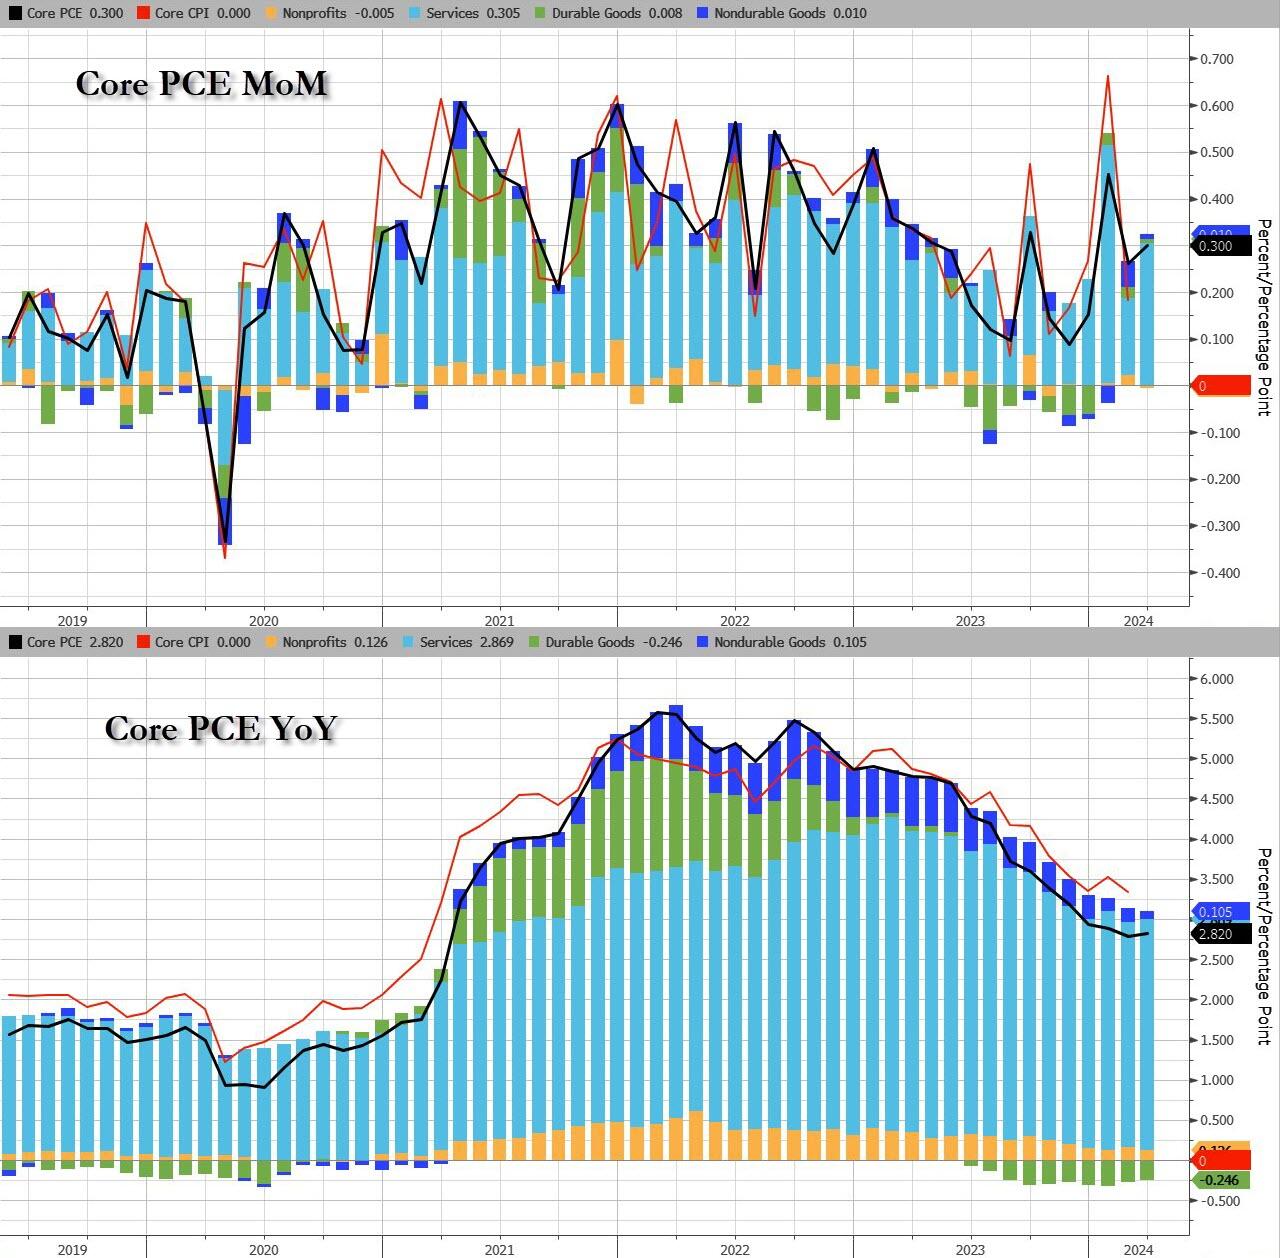
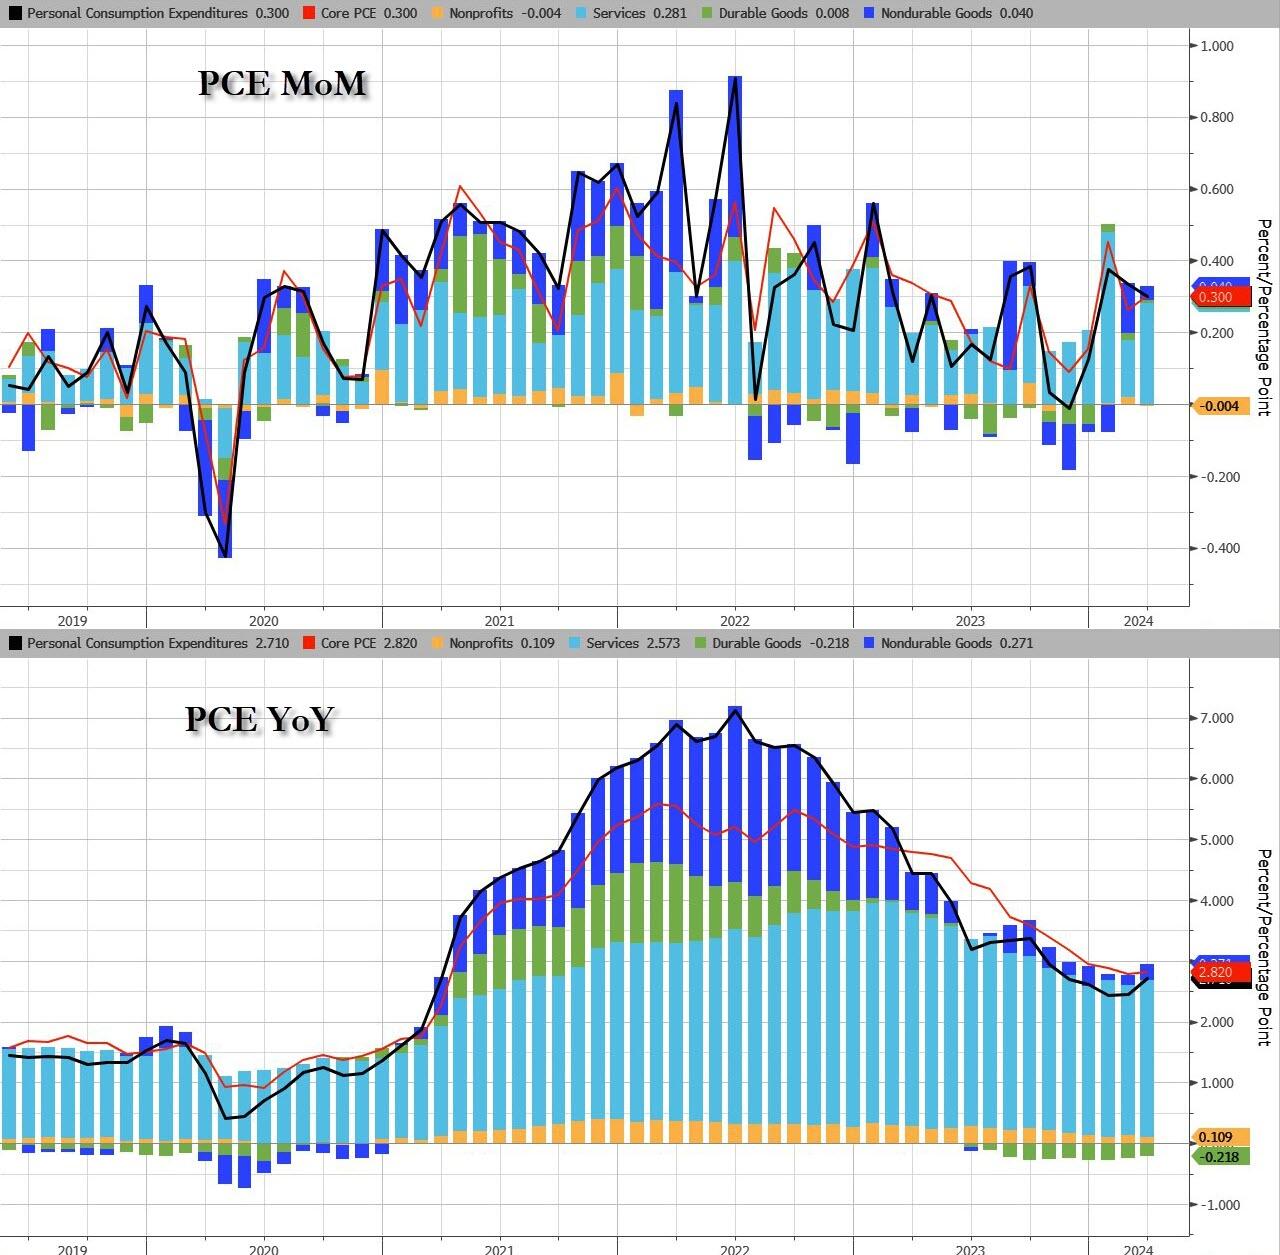
The Service sector led the MoM and YoY acceleration in headline PCE…
Source: Bloomberg
And for Core PCE, it was Services prices too that drove the acceleration…
Source: Bloomberg
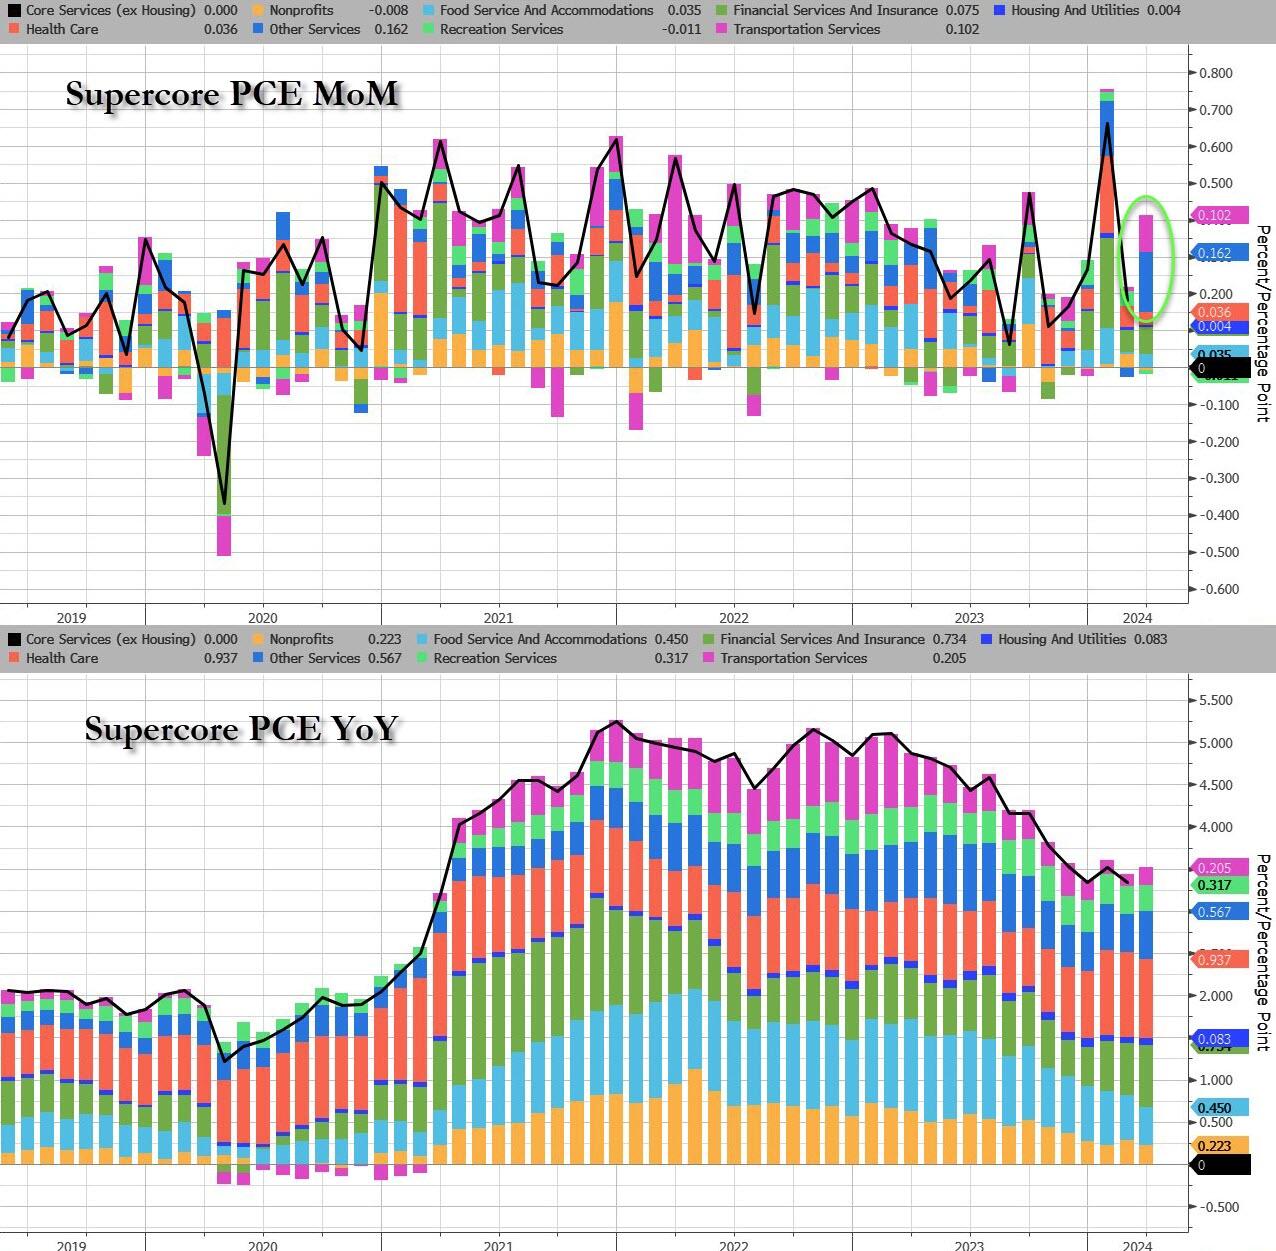
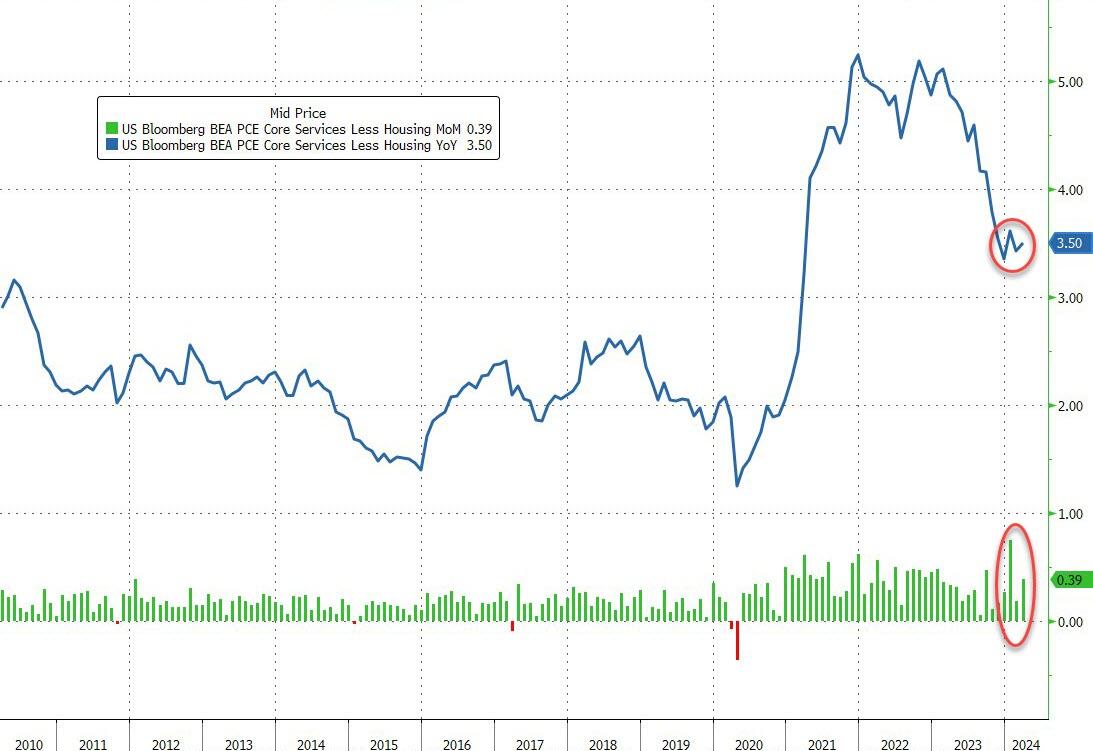
The so-called SuperCore – Services inflation ex-Shelter – rose once again, and was revised higher…
Source: Bloomberg
Stripping it back even further, Transportation Services and ‘Other Services’ were the biggest gainers in SuperCore…
Source: Bloomberg
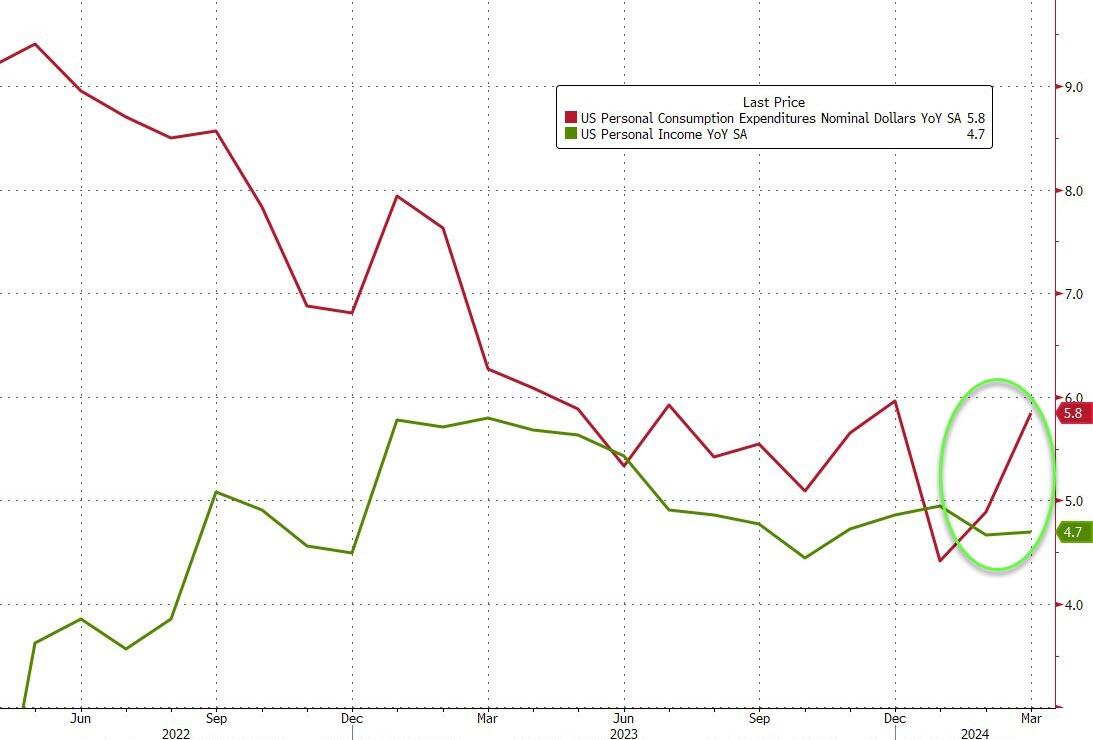
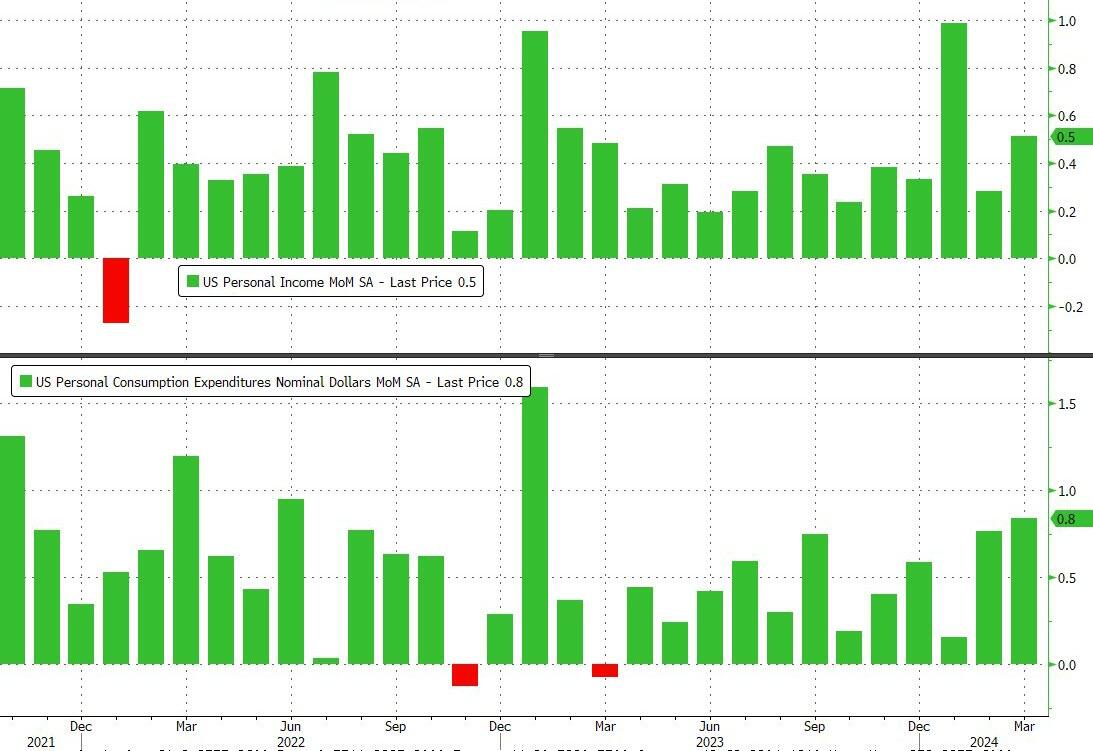
Income and Spending both rose again on a MoM basis with spending outpacing income (again). The 0.8% MoM rise in spending was the highest since Jan 2023…
Source: Bloomberg
Spending is accelerating fast relative to incomes (on a YoY basis) – and remember this is all nominal…
Source: Bloomberg
On the income side, government and private wage growth accelerated:
Govt wages rose to 8.5% YoY, from 8.3%, the highest Dec 22
Private wages rose to 5.5% YoY, from 5.4%, highest since Dec 22 as well
Source: Bloomberg
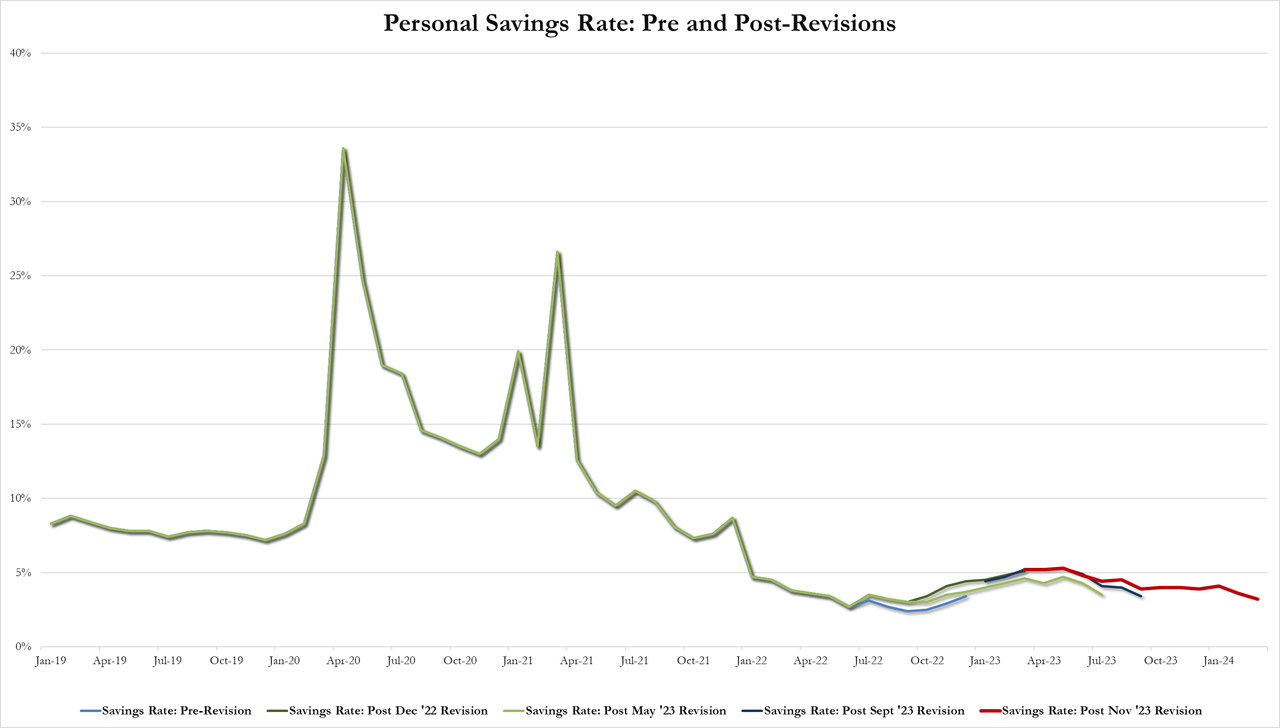
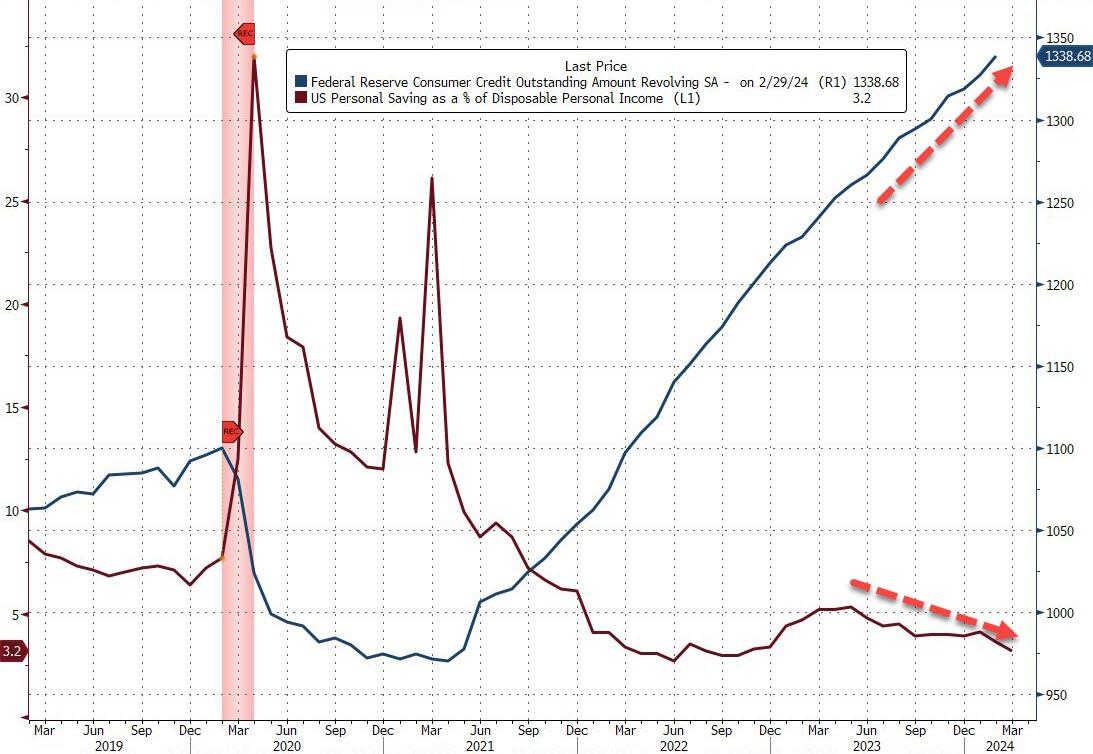
Which meant the personal savings rate plunged to 3.2% from 3.6% – its lowest since Nov 2022…
And the soaring credit card balance explains how people are getting by…
Source: Bloomberg
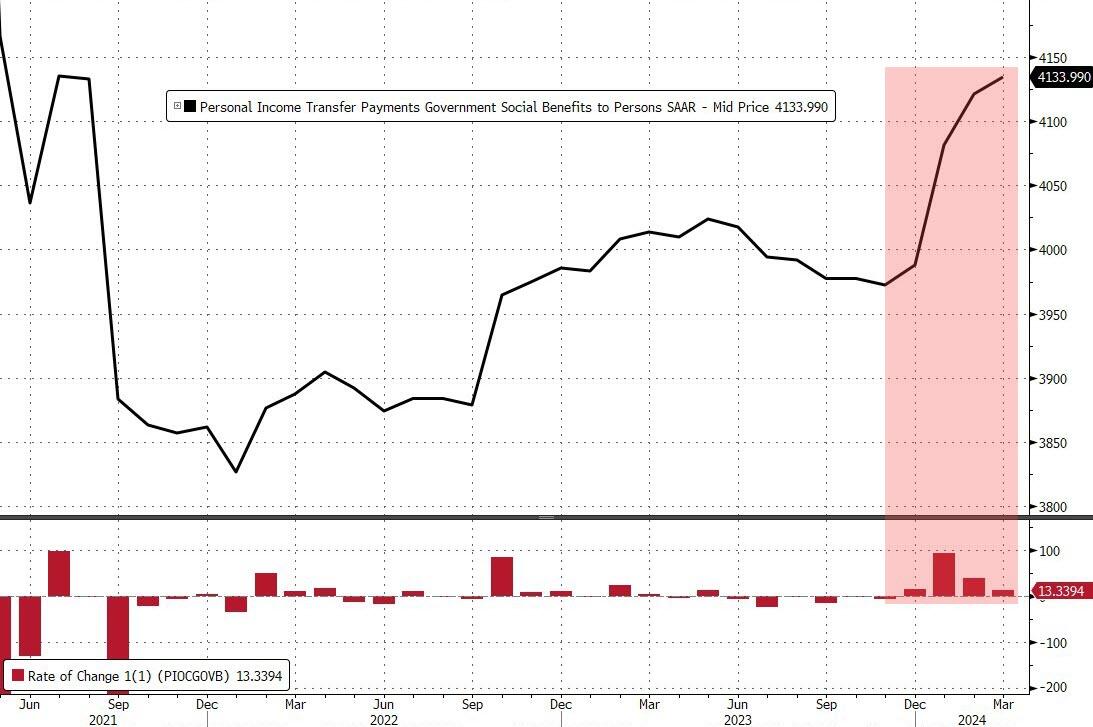
And all this amid the fourth straight month of government handouts…
Source: Bloomberg
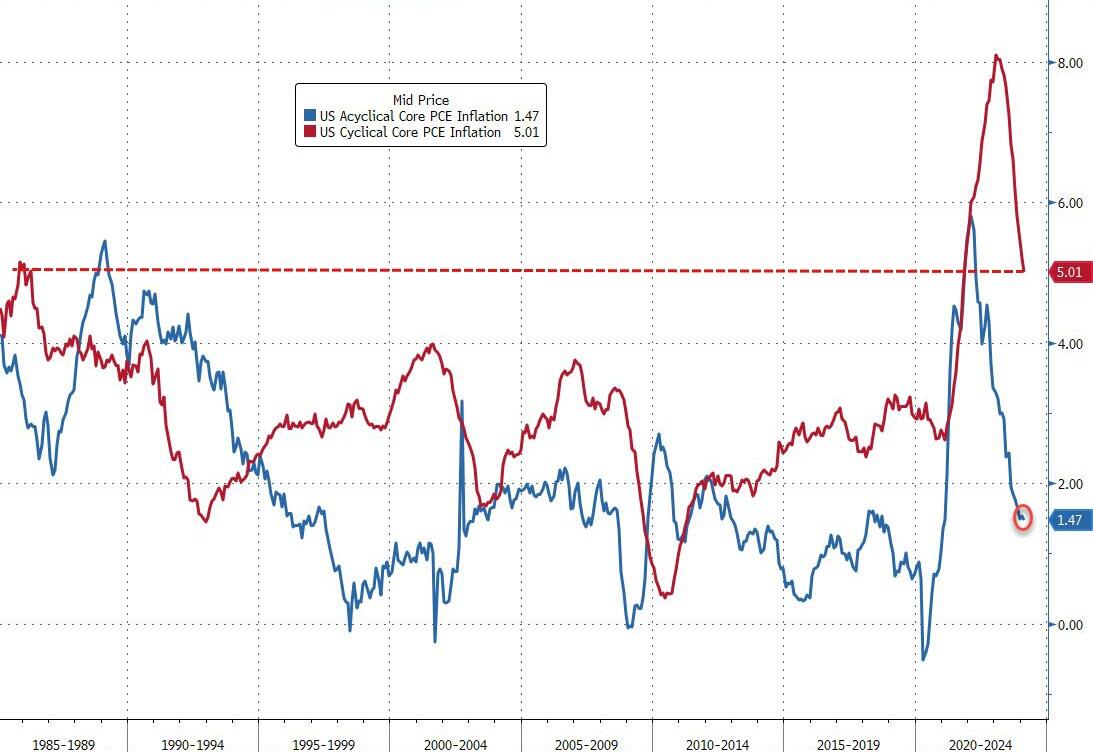
Finally, while the markets are exuberant at the survey-based disinflation, we do note that it’s not all sunshine and unicorns. The vast majority of the reduction in inflation has been ‘cyclical’…
Source: Bloomberg
Acyclical Core PCE inflation remains extremely high, although it has fallen from its highs.
Is The (apolitical) Fed going to be able to cut at all this year like Joe Biden said they would?
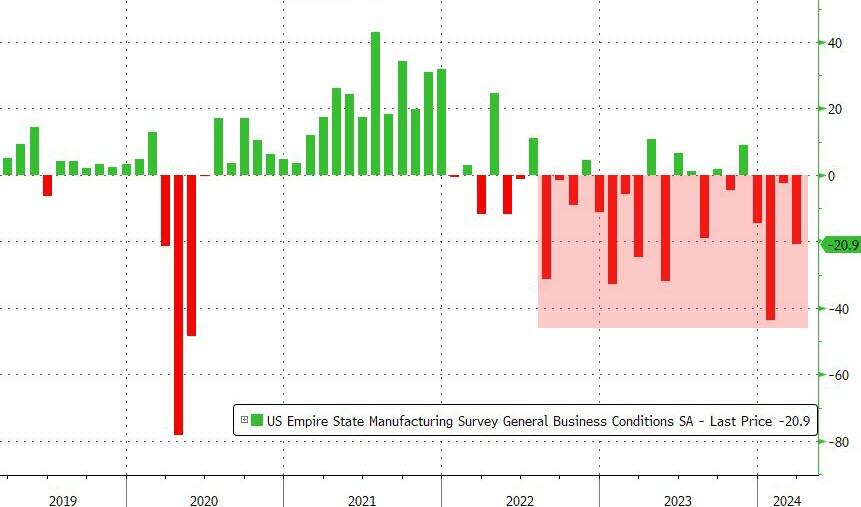
The NY Fed’s Empire State Manufacturing crashed and burned in March. NYFRB’s general business conditions index plunged 18.5pts in March to -20.9. A reading below zero indicates contraction, and the measure was weaker than all estimates in a Bloomberg survey of economists. Hey, I though illegal immigrantion was good for the economy!!!
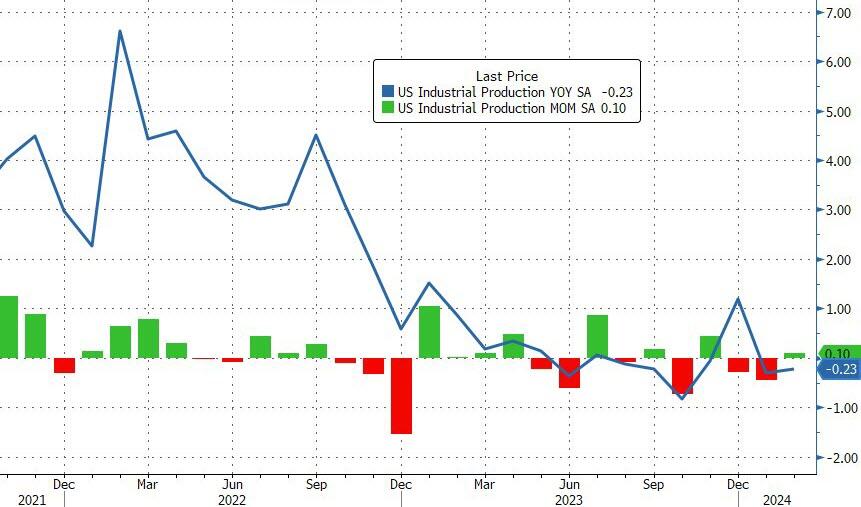
Industrial production fell tp -0.23 YoY in February, not a stellar sign for the economy.
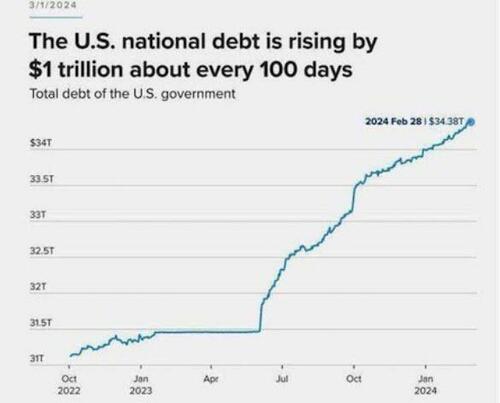
Too much debt! US politicians are spending too much money and borrowing too much. Unfortunately, that is what Biden and Bidenomics is all about: Federal targeted spending and loads of debt.
Now it requires $1 trillion of new debt every 100 days to achieve nothing but remaining static economically. The regime media pundits and the cabal on Wall Street tell us the economy is doing great. No recession in sight. All is well. The dumbed down and distracted ignorant masses don’t realize all the reported “economic growth” is “created” by the government, enabled by The Fed, spending billions on their wars in Ukraine and the Middle East, funneling the money into the Military Industrial Complex corporations; paying for the transportation, feeding, and housing of the illegal invading hordes; hiring more government drones to harass the citizenry, and desperately trying to prop up a corrupt tottering empire in its final death throes.
Anyone with even the slightest mathematical acumen knows increasing the national debt at a rate of $1 trillion every 100 days is a death wish. Why would those pulling the strings behind the scenes of this acceleration towards the cliff of national suicide be doing so at this point in time? It’s almost as if the November elections are a deadline for them to complete their exit strategy plan.
I believe we are entering the Great Taking phase of this clown show.
They are purposely creating a global financial disaster in order to take everything you and I have. It sounds crazy, but so is adding $1 trillion of debt every 100 days.
This headline from Zero Hedge makes me so glad I have eaten heart-healthy Quaker Oats and Cheerios every morning for the last 20 years! Study Finds 80% Of Americans Exposed To Fertility-Lowering Chemicals In Cheerios, Quaker Oats. The chemical (chlormequat chloride) was detected in “92 percent of oat-based foods purchased in May 2023, including Quaker Oats and Cheerios.” But that was nothing compared to this Zero Hedge headline: EU “Suicide Pact” Threatens To Flood Continent With 75 Million More Migrants. Makes me wonder if Biden/Mayorkas are under orders from the UN/WEF/Soros to let immigrants pour across our southern border (including 20,000+ Chinese military age males). But back to the economy.
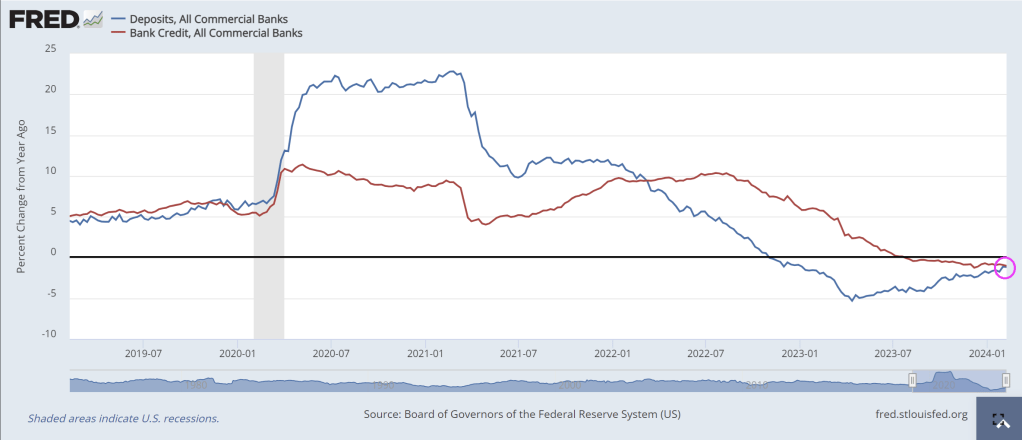
Both bank credit growth year-over-year (YoY) and bank deposit growth (YoY) are NEGATIVE. Covid resulted in massive Federal government stimulus spending (and Federal Reserve hyper stimulus) in 2020, but as the stimulus wears out, so does bank lending and deposits.
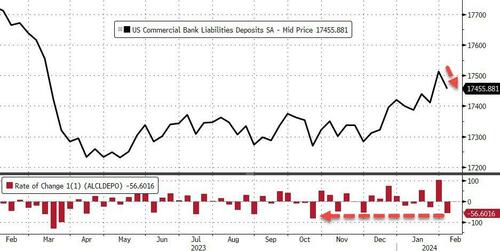
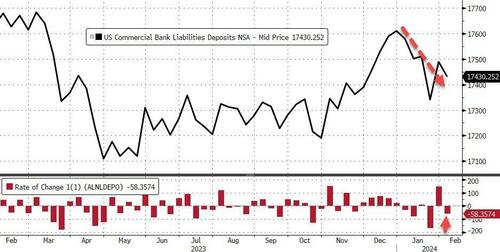
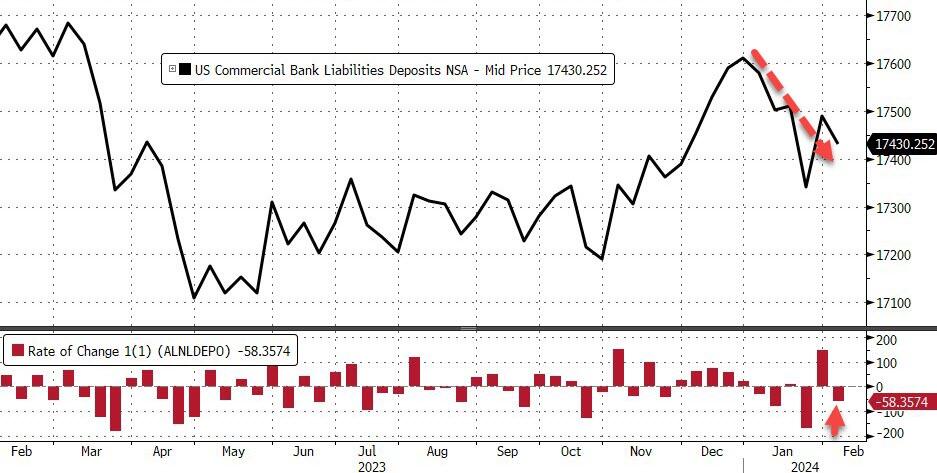
And after the prior week’s miraculous surge in deposits (again, according to The Fed), last week saw total bank deposits (seasonally-adjusted) drop $57BN – the biggest weekly drop since October…
This data is from the week when Regional bank shares shit the bed thanks to NYCB…
Interestingly, on a non-seasonally-adjusted basis, total bank deposits declined about the same as SA -$58BN (and are down $180BN YTD)…
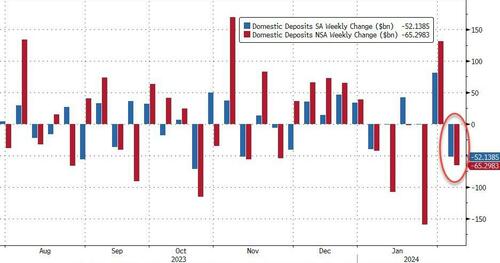
And, excluding foreign banks, domestic deposits dropped $52BN SA (Large Banks -$40BN, Small Banks -$12BN), and tumbled $65BN NSA (Large Banks -$57BN, Small Banks -$$8BN)
As the chart above shows, on an NSA basis, domestic banks have only seen one week of inflows in 2024.
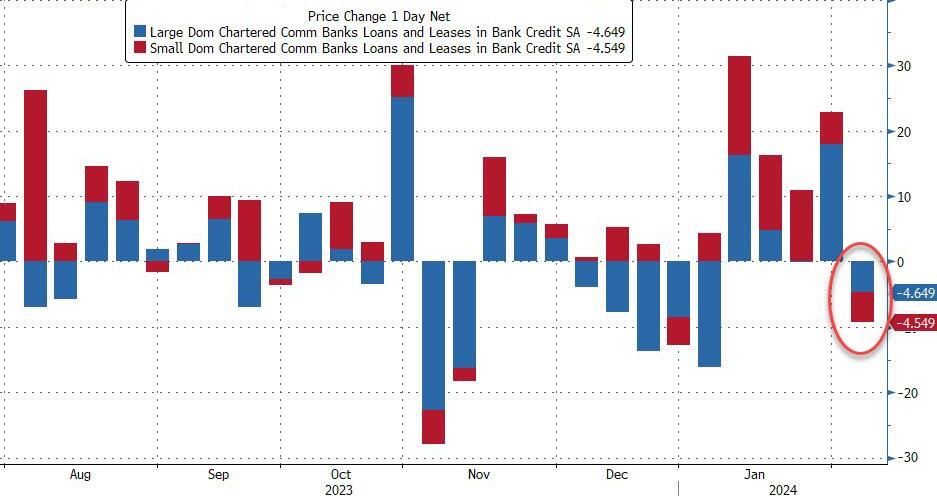
As one might expect, loan volumes shrank during that week by just over $9BN (Large banks -$4.6BN, Small banks -$4.4BN)…
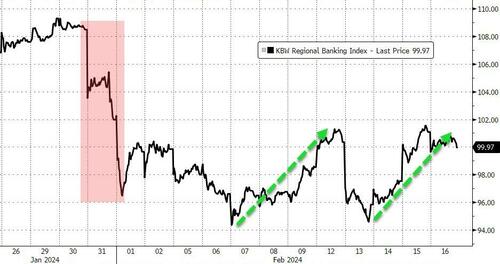
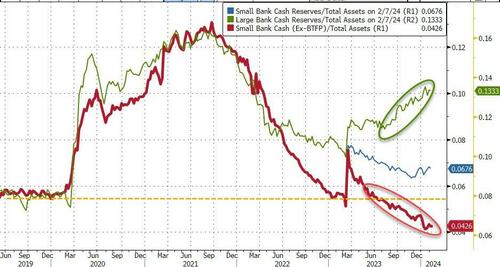
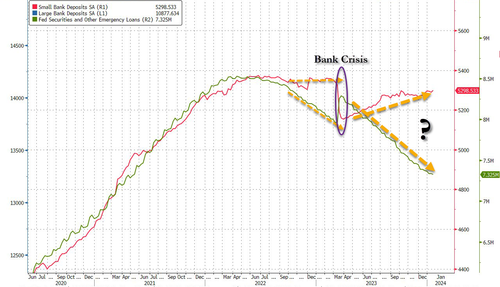
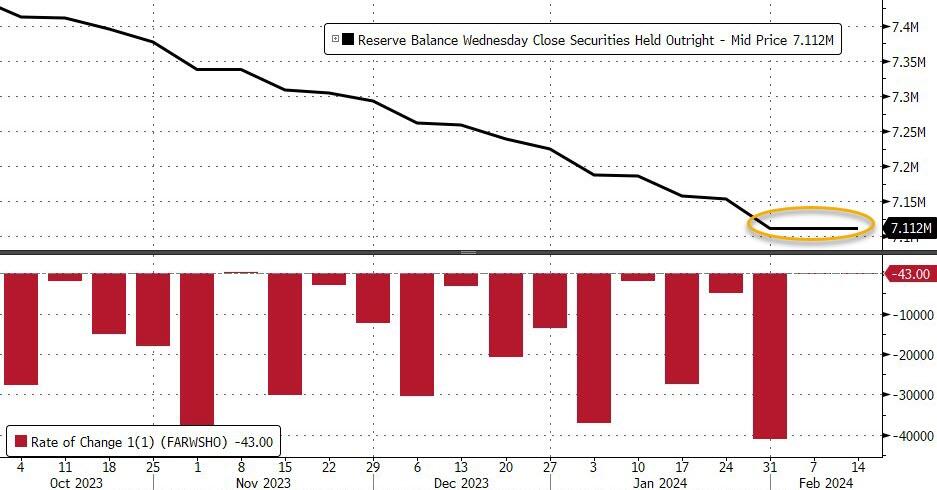
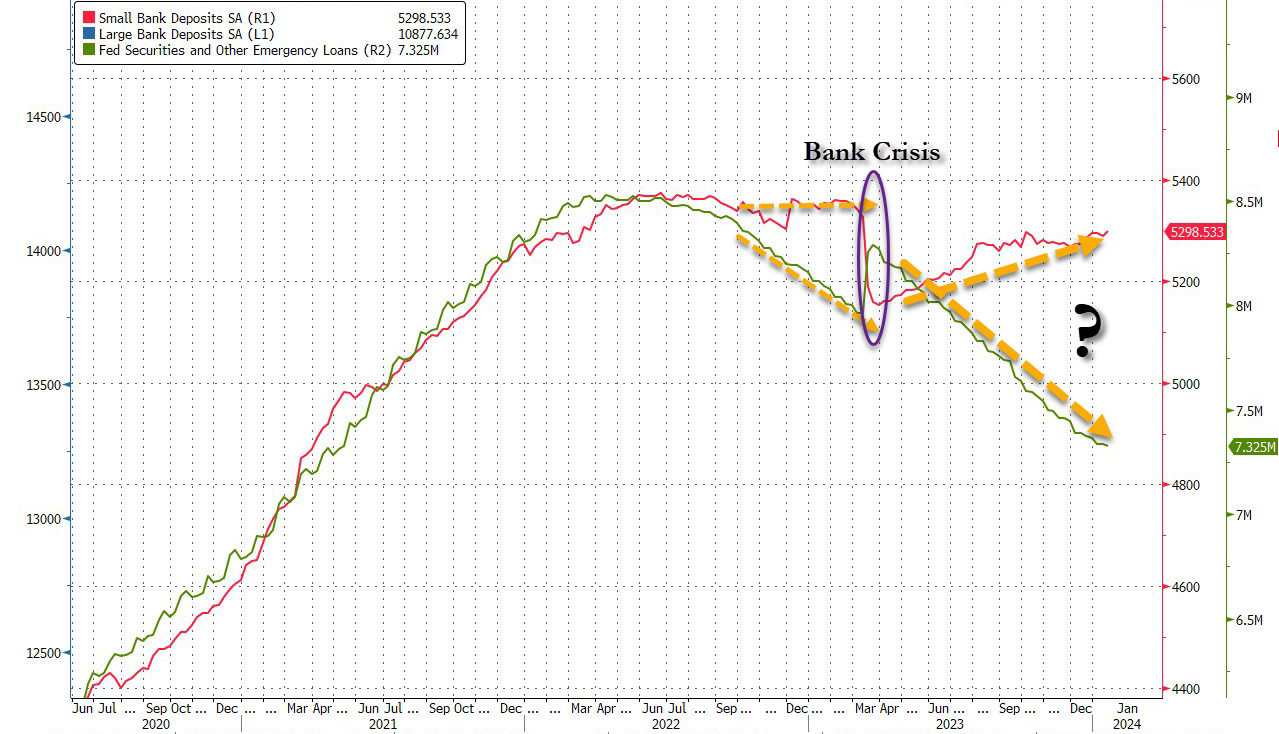
And finally, as a reminder – despite the rebound off the lows again this week in regional bank shares, which must mean everything is awesome, right? – the regional bank crisis is still very much alive as evidenced by the red line below (without The Fed’s imminently expiring BTFP facility)…
…what else are big banks (green line) going to do with all that cash burning a hole in their pockets?
The bottom line is – this looks a lot like a ‘Small Bank’ crisis. The last time this happened, the crisis sparked a sudden $300BN ‘run’ in small bank deposits…
Is The Fed ‘hoping’ for a controlled bank-run this time – so as many small bank deposits are drained voluntarily, before they are drained all at once in a panic (and the Reverse Repo facility is empty, unable to provide any cushion)?
It is looking like a recession in mid-2024 as Covid Stimulypto has run its course. Is the US economy so lame that is requires constant Federal government and Federal Reserve manipulation??
Joe Biden (President of the top 1% of Americans) and his likely replacement “Greasy Gavin” Newsom, wrecker of the California economy. Two economy wreckers on the same stage.
Remember when Democrats were the party of the working man and Republicans (like George HW Bush) were called “Country Club Republicans”? Now Biden and Democrats represent the elitist top 1% of wealth and Trump/Republicans (that Biden snidely calls “Maga Republicans”) represent the bottom 99%. Who woulda thunk??
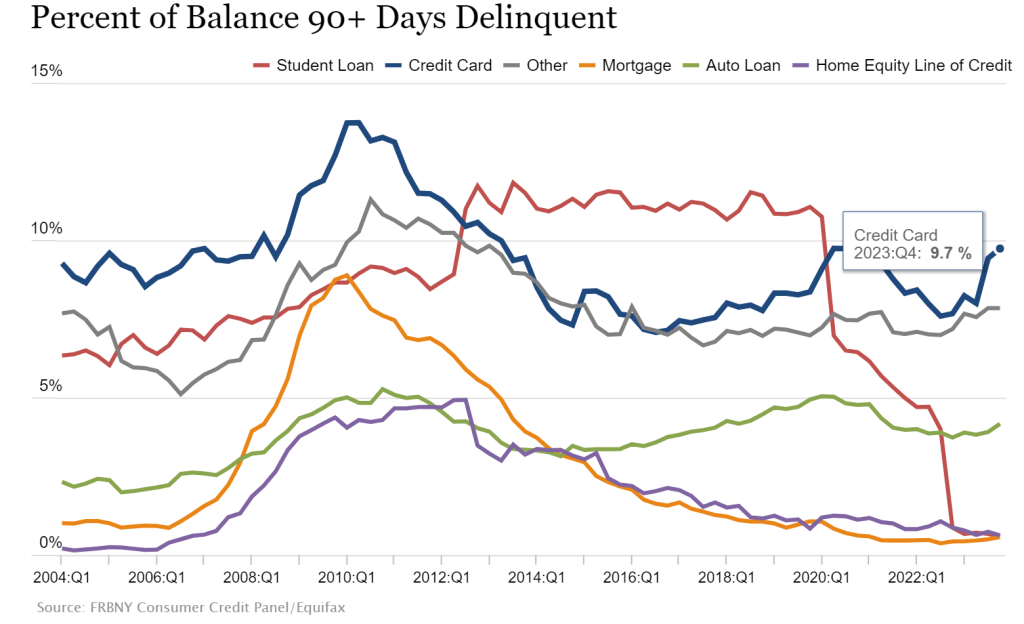
Credit card delinquecies (90+ days) rose to almost 10% in Q4 2023.
Credit card delinquencies surged more than 50% in 2023 as total consumer debt swelled to $17.5 trillion, the New York Federal Reserve reported Tuesday.
Debt that has transitioned into “serious delinquency,” or 90 days or more past due, increased across multiple categories during the year, but none more so than credit cards.
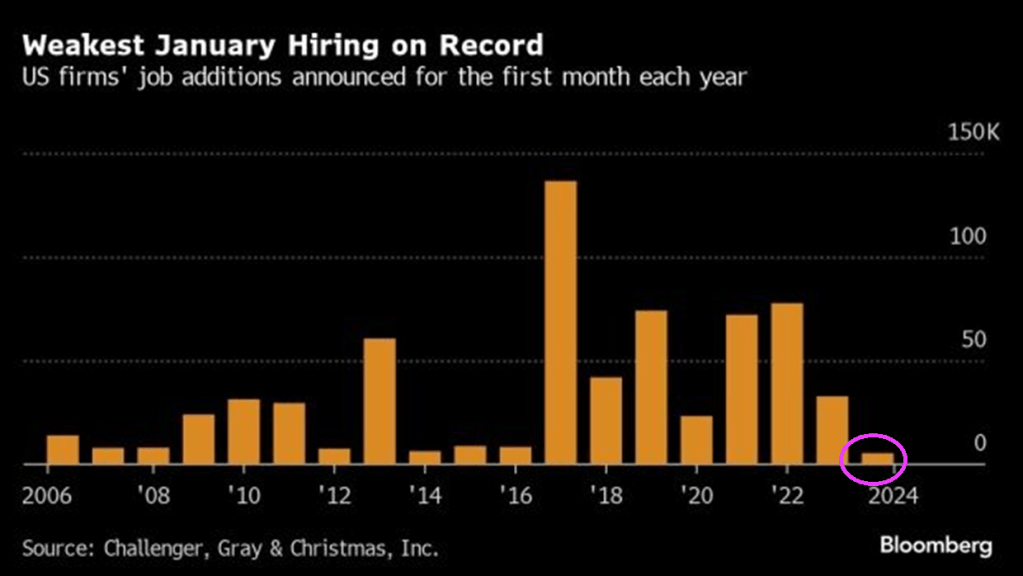
Rising credit card delinquencies combined with the worst job additions in January on record.
But at least the 10Y-2Y US Treasury yield curve is ALMOST flat (h


You must be logged in to post a comment.