Winter Is Coming! Mortgage Rates, Gasoline Prices, Food Price Growth Slowing As Money Printing Slows (Just Wait For Winter!)

Politicians like to (falsely) take credit for things, such as Biden bragging about gasoline prices declining. Bear in mind that regular gasoline prices were $2.88 when Biden was inaugurated as President, rose to over $5 a gallon in June and now have declined to $3.98 for which Biden is taking credit. So, regular gasoline prices are still up 34% under Biden. Ouch!

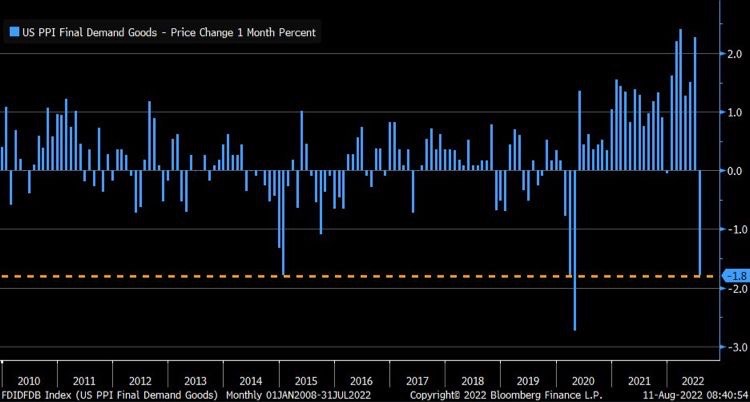
But other rates and prices are dropping too. Bankrate’s 30yr mortgage rate started at , broke the 6% plane on June 21, 2022 only to drop to 5.53% on Friday. CRB’s foodstuffs price index started at 370.58 on Biden’s inauguration as President, rose to 606.71 on May 17, 2022 then retreated to 561.32 on Friday, August 13th. Even headline inflation (CPI YoY) is cooling … slightly.

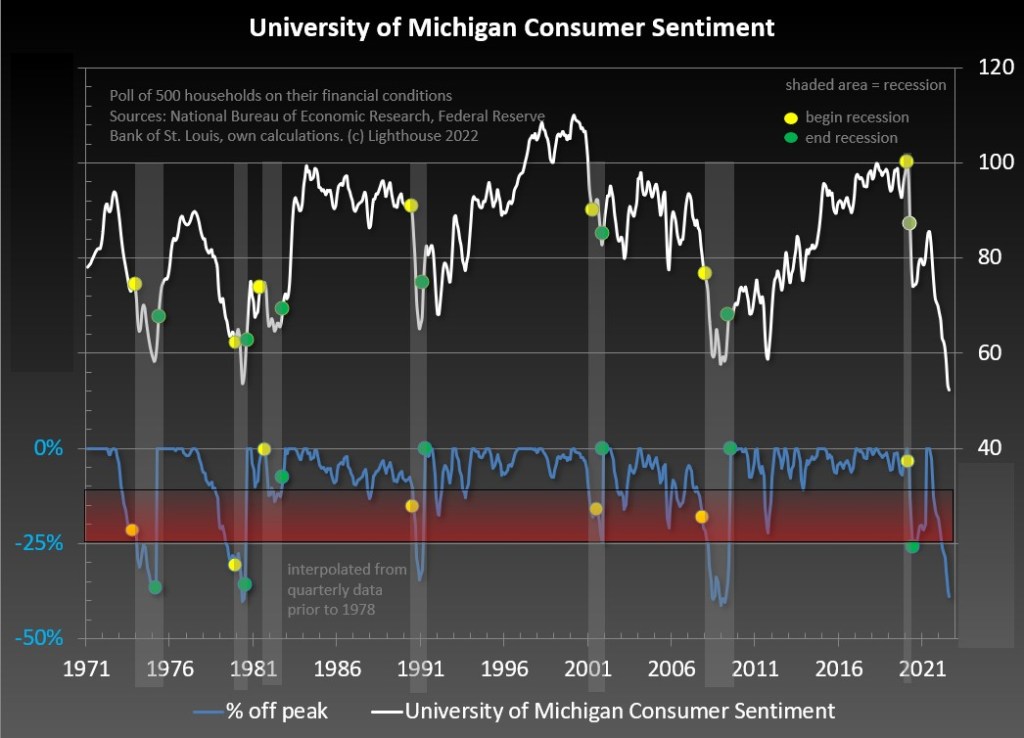
You can see the recent declines in mortgage rates, gasoline and food prices (pink box) that corresponds to a shrinking of the US M2 Money stock growth. M2 Money is still growing at torrid pace (8.5% YoY) almost back to pre-Covid stimulypto levels of 6.8% YoY. So shrinking M2 Money growth is helping reduce mortgage rates and inflation, food/gasoline prices.

Instead of trying to remove Fed stimulus even more, Biden and Congress passed the “Inflation Reduction Act” which will barely scratch inflation and raises taxes across the board (despite Biden’s promise that no one making under $400,000 will see a cent of increase taxes). And Biden’s preposterous promise ignores the inflation tax which has been severe and still growing at 8.5% YoY. Not 0% as Biden and Harris claimed.

But wait for winter as food, gasoline and heating prices start to soar again.

My favorite dim-witted explanation of inflation belongs to Democrat Representative Pramila Jayapal who recently claimed that “inflation is a theoretical word that economists use.” Like the brilliant Milton Friedman???

University Of Michigan Consumer Sentiment Index Improves From Disastrous To Horrible (Buying Conditions For Houses Remains Horrible)

The University of Michigan consumer survey is out for August and the results show improvement … from disastrous to just plain horrible.

The University of Michigan Buying Conditions for Houses remained depressed and didn’t improve.

Bear in mind that today’s consumer sentiment reading in the lowest since 1970, lower than during any recession.

The Conference Board’s leading economic indicator plunged in June despite nearly $8 trillion in Fed stimulus still outstanding.

The good news? President Biden and his son Hunter boarded Air Force One for a carbon-spewing plane trip to South Carolina for a one-week vacation. At least he can do less damage to the US while on vacation.

US Producer Price Index Cools To 9.8% YoY In July As M2 Money Growth Cools And Recession Probability Increases

Somehow I doubt if Biden, Harris and Jean-Pierre (Biden’s Press Secretary) will go on the talk show circuit talking about the Producer Price Index Final Demand at 9.8% YoY, meaning that inflation is still raging.

But the curious thing about the PPI Final Demand numbers. While lower than June’s reading of 11.3% YoY, it also coincides with declining gasoline prices and declining growth in M2 Money stock. Which is still growing at 5.9% YoY. The probability of recession is rising (even though technically the US is in recession after 2 consecutive quarters of negative GDP growth.

Here is the more striking chart.

So is the US “improving” on prices because of brilliant Biden strategies (I just laughed at my own “bon mot”)? Or are prices (PPI, gasoline) slowing because of declining demand as the US slips into recession?

Lawrence Summers was once again in the news saying that the way to cool inflation is to raises taxes (and cool demand). Only a true Statist would say something like that. Larry, how about Biden and Congress stop spending so much money that is helping to fuel inflation?

One Washington DC types would rest their hopes on cooling inflation by having the US slip into recession AND raises taxes.

Biden looking for a way out.

Jurassic MBS Market! Agency MBS Prices Swoon With Implied Fed Hikes (Duration Risk Increases Too)

Agency mortgage-backed securities (MBS) prices started to degrade as The Federal Reserve started to try to combat inflation caused by Biden’s energy policies and rampant Federal spending. That is, under June when the implied Fed O/N rate (red line) cooled and the 30-year mortgage rate (blue line) has come down a little.

In terms of duration risk, the FNCL 3% MBS duration has risen with anticipated Fed tightening.

So, further Fed tightening will result in greater MBS losses AND rising duration risk.

Hold on to your butts!

What Biden Meant When He Said Zero Inflation (July CPI Rose 0% In July) While REAL Earnings Growth Remains Negative And Rent CPI Soars

Joe Biden is without a doubt the worst communicator in Presidential history.

Here is clip of him explaining how wonderful the US economy is under his leadership. 0% CPI growth in July after a great jobs report where 528k jobs were added.

While President Biden is technically correct (CPI didn’t increase from June to July), he left out that headline inflation was still painful at 8.5% YoY and core inflation was 5.9% YoY. He also left out that CORE inflation rose 0.3% in July. And he left out that REAL earnings growth was still negative.

The midterm elections are approaching fast and, of course, Biden and his crew have to put the best face of his and the Democrats accomplishments. But seriously Joe, REAL weekly earnings growth is negative meaning that inflation is crushing wage growth. Meanwhile, CPI rent is skyrocketing and was 5.8% YoY in July.

As we know, the CPI measure of rent is terrible and does not reflect the actual rise in rents. Zillow’s Rent index YoY is slowing, but remains at 14.75% YoY, far higher than the CPI rent measure of 5.8%.

So, the Federal Government and Federal Reserve keeps pumping trillions into the economy, so it is not surprising that we have rampant inflation crushing renters.

Goin’ Down! US Treasury 2-year Yield Drops 15 Basis Points In AM (10Y-2Y Treasury Yield Curve Remains Inverted At -38.870 BPS)

Goin’ down!

Lots of volatility in markets culminating in a 15 basis point drop in the US Treasury Note yield.

Since the 10-year Treasury yield dropped only -2.7 basis points, the 10Y-2Y yield curve rose slightly to -38.87 basis points.

US Treasury Yield Curve Descends Further Into Darkness (-48.4 BPS) As Supply Of Homes Increases 30.7% In June (Fed Is Cooling Off Housing Market)

The US Treasury 10Y-2Y yield curve is descending further into darkness (aka, inversion).

The 10Y-2Y yield curve hit the worst inversion since 2000 as the curve slope hit -47.7 basis points, inverting another -2.267 basis points today.

Yes, the 10Y-2Y Treasury yield curve is SCREAMING RECESSION.

(Bloomberg) – Prashant Gopal – The supply of homes for sale across the US grew at a record rate last month, another sign that higher mortgage costs are cooling down the housing market.

The number of active listings nationwide jumped 31% from a year earlier, a record-high increase for a third straight month, according to a report Tuesday by Realtor.com. 

And according to Redfin, stale inventory is accelerating.

The Federal Reserve is no friend of the US middle class and low wage worker.

Labor Blues! US Labor Productivity Declines -4.6% In Q2 As Unit Labor Costs Sizzles At 10.8% (Fed Balance Sheet Still Out In Force)

Labor Blues!

US labor productivity declined in Q2, down -4.6% since Q1. At the same time, unit labor costs continue to soar at a rate of 10.8%.

You can see that The Federal Reserve has begun to SLOWLY reduce it balance sheet.

Somehow, I don’t think Biden’s team will be discussing today’s news, other than report that “It’s A Beautiful Day Today.”

Pushin’ Too Hard? US Treasury Yield Curve Inverts To -45 Basis Points (Most Inverted Since 2000) Despite Senate Passing “Inflation Reduction” Boondoggle

Is The Federal Reserve pushin’ too hard on raising their target rate?

The US Treasury 10Y-2Y yield curve descended further into inversion, signaling impending recession.

The US unemployment rate (U-3) tends to be the lowest when the 10Y-2Y yield curve inverts, then explodes when recession strikes.

The spread between the Bankrate 30-year mortgage rate and the Bankrate 5/1 ARM rate widened to 139 basis points.

This is happening as The Fed is expected to keep raising their target rate (yellow line) and the US Senate passed its massive “inflation reduction” boondoggle that is expected to NOT reduce inflation, but raise taxes on the middle class and low-wage workers.

Simply Unaffordable! Gap Between Real Home Price Growth (+11.17% YoY) And Real Wage Growth (-2.15% YoY) Near Highest Since 1988 (REAL 30Y Mortgage Rate Is Now -3.23%)

The US housing market is simply unaffordable for millions of Americans. To illustrate the problem, here is a chart of the Case-Shiller National home price index less CPI YoY graphed against Average Hourly Wages less CPI YoY.

The gap between the REAL national home price index YoY and REAL US average hourly earnings YoY is near the largest since 1988. Inflation is making matters far worse since REAL average hourly earnings growth continues to decline.

The only thing positive to say is that REAL home price growth YoY is lower now than at the peak of the 2005 home price bubble that burst catastrophically.

Another “positive” is that the REAL 30-year mortgage rate has fallen to -3.23%. At the peak of the house price bubble in June 2005, the REAL 30-year mortgage rate was +2.58%. THAT is one big difference between the pre-2008 recession and today’s impending recession.